
By CountingPips.com COT Home | Data Tables | Data Downloads | Newsletter
Here are the latest charts and statistics for the Commitment of Traders (COT) data published by the Commodities Futures Trading Commission (CFTC).
The latest COT data is updated through Tuesday September 14th 2021 and shows a quick view of how large traders (for-profit speculators and commercial entities) were positioned in the futures markets. All currency positions are in direct relation to the US dollar where, for example, a bet for the euro is a bet that the euro will rise versus the dollar while a bet against the euro will be a bet that the euro will decline versus the dollar.
US Dollar Index Futures:
 The US Dollar Index large speculator standing this week recorded a net position of 24,273 contracts in the data reported through Tuesday. This was a weekly increase of 2,808 contracts from the previous week which had a total of 21,465 net contracts.
This week’s current strength score (the trader positioning range over the past three years, measured from 0 to 100) shows the speculators are currently Bullish with a score of 67.7 percent. The commercials are Bearish with a score of 25.1 percent and the small traders (not shown in chart) are Bullish-Extreme with a score of 97.1 percent.
| US DOLLAR INDEX Statistics | SPECULATORS | COMMERCIALS | SMALL TRADERS |
| – Percent of Open Interest Longs: | 78.4 | 2.7 | 16.2 |
| – Percent of Open Interest Shorts: | 23.7 | 69.8 | 3.8 |
| – Net Position: | 24,273 | -29,775 | 5,502 |
| – Gross Longs: | 34,805 | 1,219 | 7,185 |
| – Gross Shorts: | 10,532 | 30,994 | 1,683 |
| – Long to Short Ratio: | 3.3 to 1 | 0.0 to 1 | 4.3 to 1 |
| NET POSITION TREND: | |||
| – COT Index Score (3 Year Range Pct): | 67.7 | 25.1 | 97.1 |
| – COT Index Reading (3 Year Range): | Bullish | Bearish | Bullish-Extreme |
| NET POSITION MOVEMENT INDEX: | |||
| – 6-Week Change in Strength Index: | 9.3 | -10.8 | 15.5 |
Free Reports:
 Get our Weekly Commitment of Traders Reports - See where the biggest traders (Hedge Funds and Commercial Hedgers) are positioned in the futures markets on a weekly basis.
 Download Our Metatrader 4 Indicators – Put Our Free MetaTrader 4 Custom Indicators on your charts when you join our Weekly Newsletter
Euro Currency Futures:
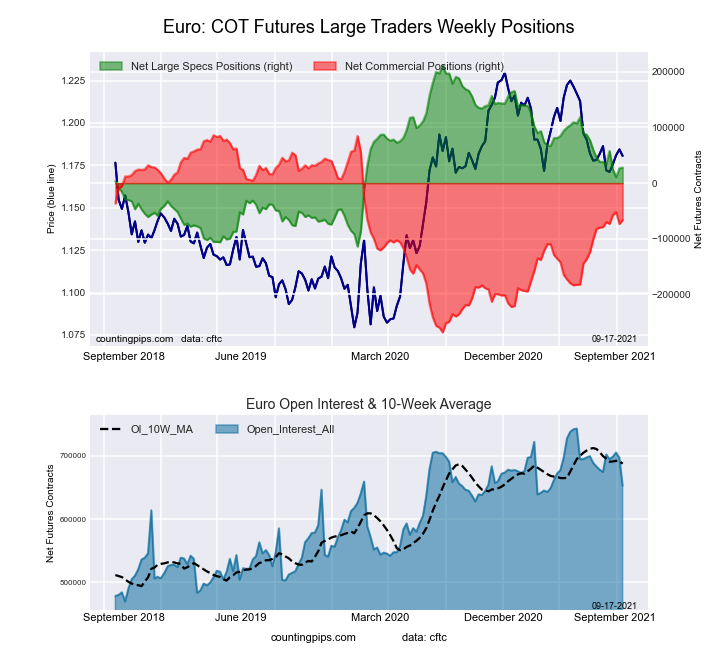 The Euro Currency large speculator standing this week recorded a net position of 27,805 contracts in the data reported through Tuesday. This was a weekly boost of 1,497 contracts from the previous week which had a total of 26,308 net contracts.
This week’s current strength score (the trader positioning range over the past three years, measured from 0 to 100) shows the speculators are currently Bearish with a score of 43.5 percent. The commercials are Bullish with a score of 57.0 percent and the small traders (not shown in chart) are Bearish with a score of 40.8 percent.
| EURO Currency Statistics | SPECULATORS | COMMERCIALS | SMALL TRADERS |
| – Percent of Open Interest Longs: | 28.6 | 56.4 | 13.8 |
| – Percent of Open Interest Shorts: | 24.3 | 66.6 | 7.9 |
| – Net Position: | 27,805 | -66,260 | 38,455 |
| – Gross Longs: | 186,554 | 368,593 | 90,270 |
| – Gross Shorts: | 158,749 | 434,853 | 51,815 |
| – Long to Short Ratio: | 1.2 to 1 | 0.8 to 1 | 1.7 to 1 |
| NET POSITION TREND: | |||
| – COT Index Score (3 Year Range Pct): | 43.5 | 57.0 | 40.8 |
| – COT Index Reading (3 Year Range): | Bearish | Bullish | Bearish |
| NET POSITION MOVEMENT INDEX: | |||
| – 6-Week Change in Strength Index: | -3.1 | 3.6 | -4.1 |
British Pound Sterling Futures:
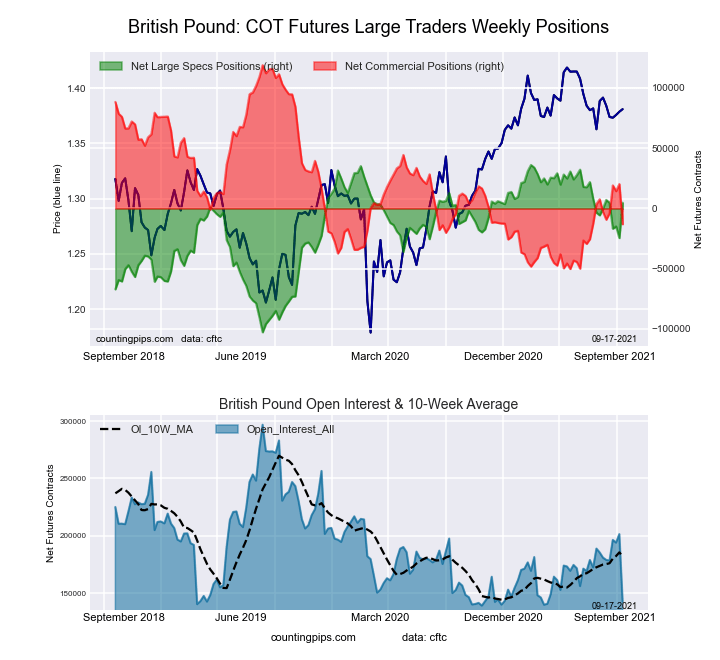 The British Pound Sterling large speculator standing this week recorded a net position of 4,790 contracts in the data reported through Tuesday. This was a weekly advance of 29,314 contracts from the previous week which had a total of -24,524 net contracts.
This week’s current strength score (the trader positioning range over the past three years, measured from 0 to 100) shows the speculators are currently Bullish with a score of 77.5 percent. The commercials are Bearish with a score of 21.9 percent and the small traders (not shown in chart) are Bullish with a score of 72.8 percent.
| BRITISH POUND Statistics | SPECULATORS | COMMERCIALS | SMALL TRADERS |
| – Percent of Open Interest Longs: | 31.0 | 46.1 | 22.9 |
| – Percent of Open Interest Shorts: | 27.6 | 55.2 | 17.0 |
| – Net Position: | 4,790 | -13,077 | 8,287 |
| – Gross Longs: | 44,161 | 65,679 | 32,596 |
| – Gross Shorts: | 39,371 | 78,756 | 24,309 |
| – Long to Short Ratio: | 1.1 to 1 | 0.8 to 1 | 1.3 to 1 |
| NET POSITION TREND: | |||
| – COT Index Score (3 Year Range Pct): | 77.5 | 21.9 | 72.8 |
| – COT Index Reading (3 Year Range): | Bullish | Bearish | Bullish |
| NET POSITION MOVEMENT INDEX: | |||
| – 6-Week Change in Strength Index: | 3.5 | -6.0 | 10.9 |
Japanese Yen Futures:
 The Japanese Yen large speculator standing this week recorded a net position of -60,295 contracts in the data reported through Tuesday. This was a weekly increase of 2,030 contracts from the previous week which had a total of -62,325 net contracts.
This week’s current strength score (the trader positioning range over the past three years, measured from 0 to 100) shows the speculators are currently Bearish with a score of 33.1 percent. The commercials are Bullish with a score of 66.8 percent and the small traders (not shown in chart) are Bearish with a score of 40.3 percent.
| JAPANESE YEN Statistics | SPECULATORS | COMMERCIALS | SMALL TRADERS |
| – Percent of Open Interest Longs: | 11.3 | 76.4 | 11.4 |
| – Percent of Open Interest Shorts: | 42.7 | 41.0 | 15.5 |
| – Net Position: | -60,295 | 68,035 | -7,740 |
| – Gross Longs: | 21,728 | 146,716 | 21,950 |
| – Gross Shorts: | 82,023 | 78,681 | 29,690 |
| – Long to Short Ratio: | 0.3 to 1 | 1.9 to 1 | 0.7 to 1 |
| NET POSITION TREND: | |||
| – COT Index Score (3 Year Range Pct): | 33.1 | 66.8 | 40.3 |
| – COT Index Reading (3 Year Range): | Bearish | Bullish | Bearish |
| NET POSITION MOVEMENT INDEX: | |||
| – 6-Week Change in Strength Index: | -3.1 | 0.2 | 9.1 |
Swiss Franc Futures:
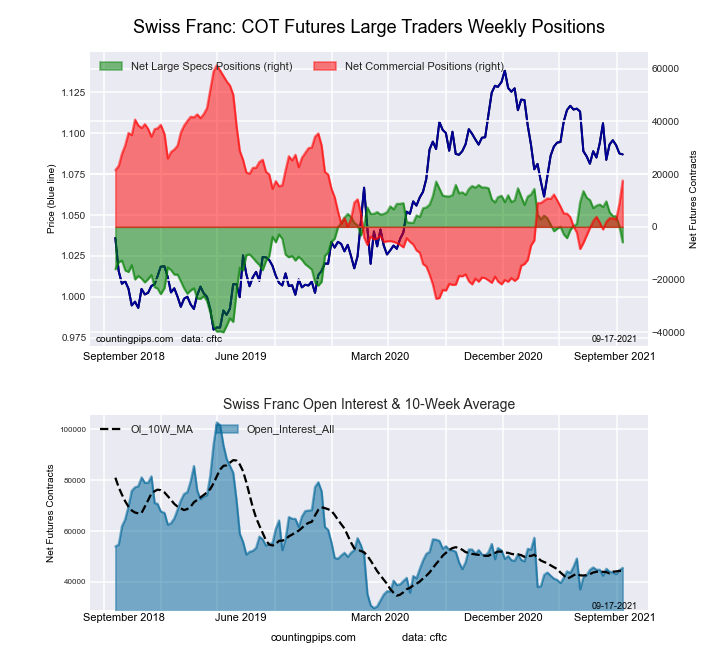 The Swiss Franc large speculator standing this week recorded a net position of -5,878 contracts in the data reported through Tuesday. This was a weekly fall of -6,098 contracts from the previous week which had a total of 220 net contracts.
This week’s current strength score (the trader positioning range over the past three years, measured from 0 to 100) shows the speculators are currently Bullish with a score of 59.7 percent. The commercials are Bullish with a score of 50.6 percent and the small traders (not shown in chart) are Bearish with a score of 29.0 percent.
| SWISS FRANC Statistics | SPECULATORS | COMMERCIALS | SMALL TRADERS |
| – Percent of Open Interest Longs: | 13.6 | 66.0 | 19.9 |
| – Percent of Open Interest Shorts: | 26.5 | 27.4 | 45.6 |
| – Net Position: | -5,878 | 17,574 | -11,696 |
| – Gross Longs: | 6,170 | 30,053 | 9,048 |
| – Gross Shorts: | 12,048 | 12,479 | 20,744 |
| – Long to Short Ratio: | 0.5 to 1 | 2.4 to 1 | 0.4 to 1 |
| NET POSITION TREND: | |||
| – COT Index Score (3 Year Range Pct): | 59.7 | 50.6 | 29.0 |
| – COT Index Reading (3 Year Range): | Bullish | Bullish | Bearish |
| NET POSITION MOVEMENT INDEX: | |||
| – 6-Week Change in Strength Index: | -23.5 | 20.9 | -15.1 |
Canadian Dollar Futures:
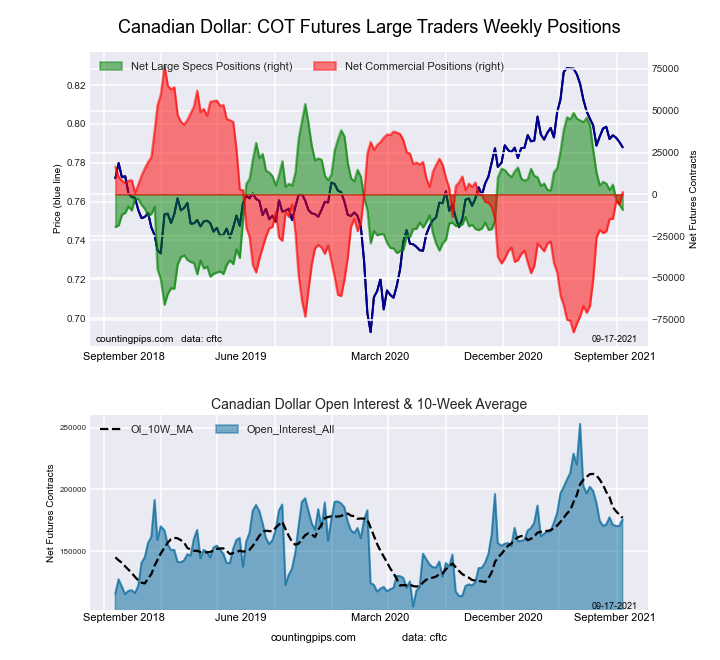 The Canadian Dollar large speculator standing this week recorded a net position of -9,283 contracts in the data reported through Tuesday. This was a weekly reduction of -3,273 contracts from the previous week which had a total of -6,010 net contracts.
This week’s current strength score (the trader positioning range over the past three years, measured from 0 to 100) shows the speculators are currently Bearish with a score of 47.3 percent. The commercials are Bullish with a score of 52.5 percent and the small traders (not shown in chart) are Bullish with a score of 58.7 percent.
| CANADIAN DOLLAR Statistics | SPECULATORS | COMMERCIALS | SMALL TRADERS |
| – Percent of Open Interest Longs: | 20.9 | 58.5 | 19.1 |
| – Percent of Open Interest Shorts: | 26.2 | 57.7 | 14.6 |
| – Net Position: | -9,283 | 1,424 | 7,859 |
| – Gross Longs: | 36,677 | 102,846 | 33,509 |
| – Gross Shorts: | 45,960 | 101,422 | 25,650 |
| – Long to Short Ratio: | 0.8 to 1 | 1.0 to 1 | 1.3 to 1 |
| NET POSITION TREND: | |||
| – COT Index Score (3 Year Range Pct): | 47.3 | 52.5 | 58.7 |
| – COT Index Reading (3 Year Range): | Bearish | Bullish | Bullish |
| NET POSITION MOVEMENT INDEX: | |||
| – 6-Week Change in Strength Index: | -14.0 | 15.3 | -11.7 |
Australian Dollar Futures:
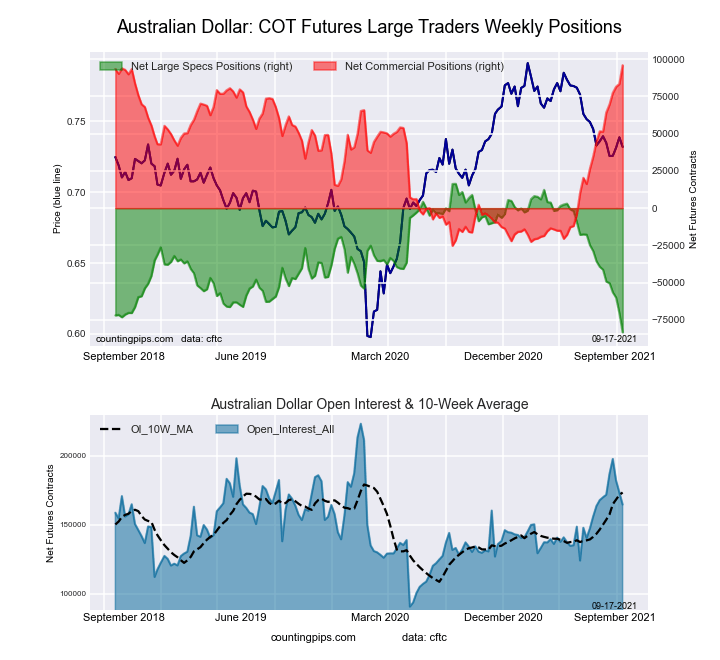 The Australian Dollar large speculator standing this week recorded a net position of -83,383 contracts in the data reported through Tuesday. This was a weekly reduction of -12,895 contracts from the previous week which had a total of -70,488 net contracts.
This week’s current strength score (the trader positioning range over the past three years, measured from 0 to 100) shows the speculators are currently Bearish-Extreme with a score of 0.0 percent. The commercials are Bullish-Extreme with a score of 100.0 percent and the small traders (not shown in chart) are Bearish with a score of 24.3 percent.
| AUSTRALIAN DOLLAR Statistics | SPECULATORS | COMMERCIALS | SMALL TRADERS |
| – Percent of Open Interest Longs: | 8.0 | 79.6 | 9.9 |
| – Percent of Open Interest Shorts: | 58.6 | 21.3 | 17.6 |
| – Net Position: | -83,383 | 96,033 | -12,650 |
| – Gross Longs: | 13,116 | 131,163 | 16,375 |
| – Gross Shorts: | 96,499 | 35,130 | 29,025 |
| – Long to Short Ratio: | 0.1 to 1 | 3.7 to 1 | 0.6 to 1 |
| NET POSITION TREND: | |||
| – COT Index Score (3 Year Range Pct): | 0.0 | 100.0 | 24.3 |
| – COT Index Reading (3 Year Range): | Bearish-Extreme | Bullish-Extreme | Bearish |
| NET POSITION MOVEMENT INDEX: | |||
| – 6-Week Change in Strength Index: | -42.2 | 36.8 | -5.9 |
New Zealand Dollar Futures:
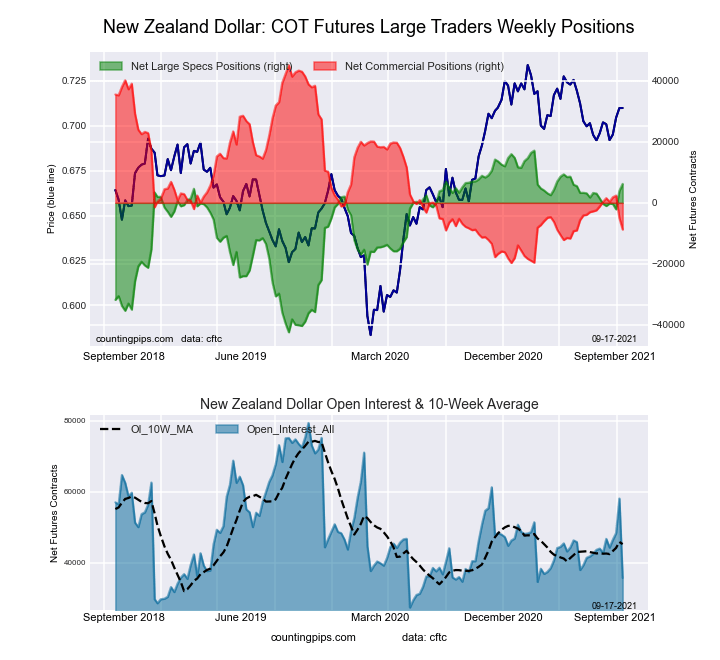 The New Zealand Dollar large speculator standing this week recorded a net position of 6,206 contracts in the data reported through Tuesday. This was a weekly rise of 2,343 contracts from the previous week which had a total of 3,863 net contracts.
This week’s current strength score (the trader positioning range over the past three years, measured from 0 to 100) shows the speculators are currently Bullish-Extreme with a score of 81.7 percent. The commercials are Bearish-Extreme with a score of 16.9 percent and the small traders (not shown in chart) are Bullish-Extreme with a score of 81.6 percent.
| NEW ZEALAND DOLLAR Statistics | SPECULATORS | COMMERCIALS | SMALL TRADERS |
| – Percent of Open Interest Longs: | 49.2 | 31.4 | 16.5 |
| – Percent of Open Interest Shorts: | 31.8 | 55.9 | 9.3 |
| – Net Position: | 6,206 | -8,755 | 2,549 |
| – Gross Longs: | 17,554 | 11,196 | 5,873 |
| – Gross Shorts: | 11,348 | 19,951 | 3,324 |
| – Long to Short Ratio: | 1.5 to 1 | 0.6 to 1 | 1.8 to 1 |
| NET POSITION TREND: | |||
| – COT Index Score (3 Year Range Pct): | 81.7 | 16.9 | 81.6 |
| – COT Index Reading (3 Year Range): | Bullish-Extreme | Bearish-Extreme | Bullish-Extreme |
| NET POSITION MOVEMENT INDEX: | |||
| – 6-Week Change in Strength Index: | 11.0 | -14.0 | 28.3 |
Mexican Peso Futures:
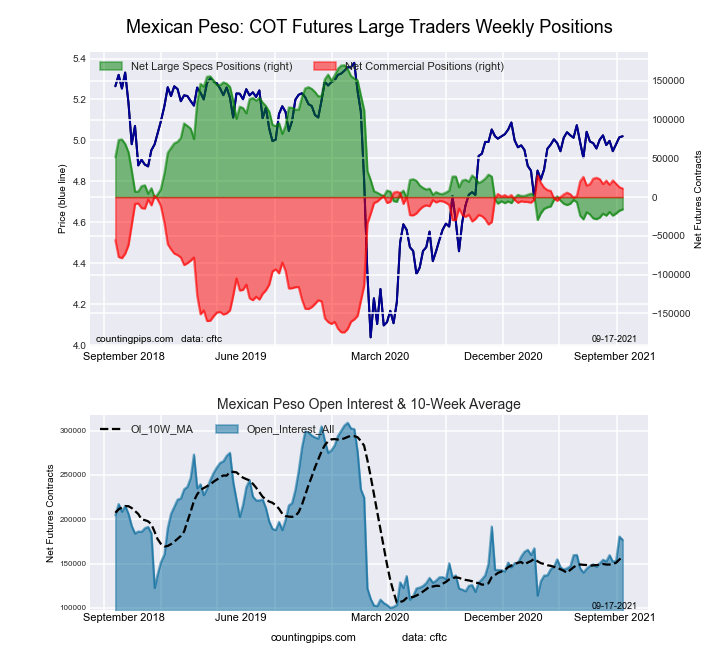 The Mexican Peso large speculator standing this week recorded a net position of -15,852 contracts in the data reported through Tuesday. This was a weekly boost of 1,665 contracts from the previous week which had a total of -17,517 net contracts.
This week’s current strength score (the trader positioning range over the past three years, measured from 0 to 100) shows the speculators are currently Bearish-Extreme with a score of 6.8 percent. The commercials are Bullish-Extreme with a score of 91.6 percent and the small traders (not shown in chart) are Bullish with a score of 63.3 percent.
| MEXICAN PESO Statistics | SPECULATORS | COMMERCIALS | SMALL TRADERS |
| – Percent of Open Interest Longs: | 54.3 | 41.1 | 4.1 |
| – Percent of Open Interest Shorts: | 63.2 | 34.8 | 1.4 |
| – Net Position: | -15,852 | 11,073 | 4,779 |
| – Gross Longs: | 95,948 | 72,569 | 7,213 |
| – Gross Shorts: | 111,800 | 61,496 | 2,434 |
| – Long to Short Ratio: | 0.9 to 1 | 1.2 to 1 | 3.0 to 1 |
| NET POSITION TREND: | |||
| – COT Index Score (3 Year Range Pct): | 6.8 | 91.6 | 63.3 |
| – COT Index Reading (3 Year Range): | Bearish-Extreme | Bullish-Extreme | Bullish |
| NET POSITION MOVEMENT INDEX: | |||
| – 6-Week Change in Strength Index: | 2.7 | -2.9 | 1.9 |
Brazilian Real Futures:
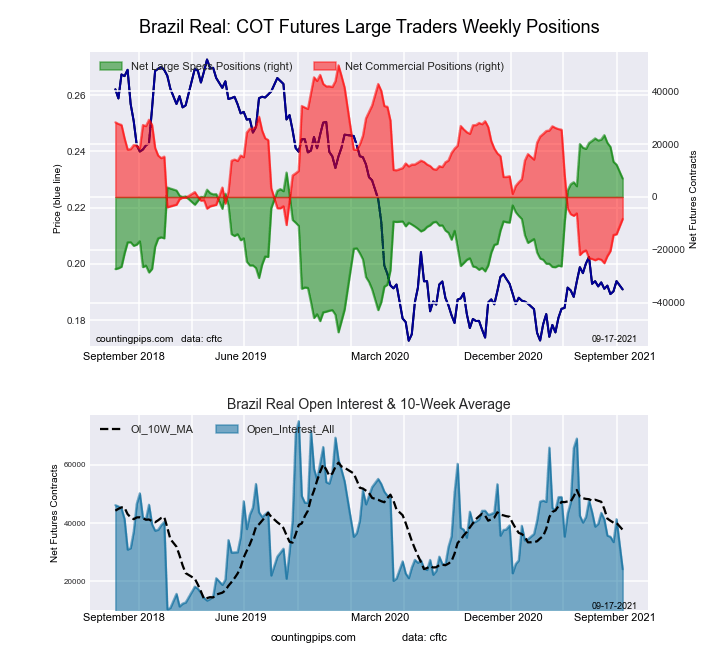 The Brazilian Real large speculator standing this week recorded a net position of 6,994 contracts in the data reported through Tuesday. This was a weekly advance of 660 contracts from the previous week which had a total of 12,258 net contracts.
This week’s current strength score (the trader positioning range over the past three years, measured from 0 to 100) shows the speculators are currently Bullish with a score of 78.0 percent. The commercials are Bearish with a score of 22.3 percent and the small traders (not shown in chart) are Bullish-Extreme with a score of 83.2 percent.
| BRAZIL REAL Statistics | SPECULATORS | COMMERCIALS | SMALL TRADERS |
| – Percent of Open Interest Longs: | 57.8 | 29.2 | 12.9 |
| – Percent of Open Interest Shorts: | 28.9 | 63.7 | 7.4 |
| – Net Position: | 6,994 | -8,346 | 1,352 |
| – Gross Longs: | 13,983 | 7,055 | 3,130 |
| – Gross Shorts: | 6,989 | 15,401 | 1,778 |
| – Long to Short Ratio: | 2.0 to 1 | 0.5 to 1 | 1.8 to 1 |
| NET POSITION TREND: | |||
| – COT Index Score (3 Year Range Pct): | 78.0 | 22.3 | 83.2 |
| – COT Index Reading (3 Year Range): | Bullish | Bearish | Bullish-Extreme |
| NET POSITION MOVEMENT INDEX: | |||
| – 6-Week Change in Strength Index: | -22.0 | 22.3 | -3.3 |
Russian Ruble Futures:
 The Russian Ruble large speculator standing this week recorded a net position of 20,223 contracts in the data reported through Tuesday. This was a weekly decline of -722 contracts from the previous week which had a total of 20,945 net contracts.
This week’s current strength score (the trader positioning range over the past three years, measured from 0 to 100) shows the speculators are currently Bullish with a score of 61.3 percent. The commercials are Bearish with a score of 34.8 percent and the small traders (not shown in chart) are Bullish-Extreme with a score of 98.6 percent.
| RUSSIAN RUBLE Statistics | SPECULATORS | COMMERCIALS | SMALL TRADERS |
| – Percent of Open Interest Longs: | 41.7 | 48.2 | 4.0 |
| – Percent of Open Interest Shorts: | 12.0 | 80.7 | 1.2 |
| – Net Position: | 20,223 | -22,149 | 1,926 |
| – Gross Longs: | 28,376 | 32,836 | 2,737 |
| – Gross Shorts: | 8,153 | 54,985 | 811 |
| – Long to Short Ratio: | 3.5 to 1 | 0.6 to 1 | 3.4 to 1 |
| NET POSITION TREND: | |||
| – COT Index Score (3 Year Range Pct): | 61.3 | 34.8 | 98.6 |
| – COT Index Reading (3 Year Range): | Bullish | Bearish | Bullish-Extreme |
| NET POSITION MOVEMENT INDEX: | |||
| – 6-Week Change in Strength Index: | 26.7 | -25.8 | -1.4 |
Bitcoin Futures:
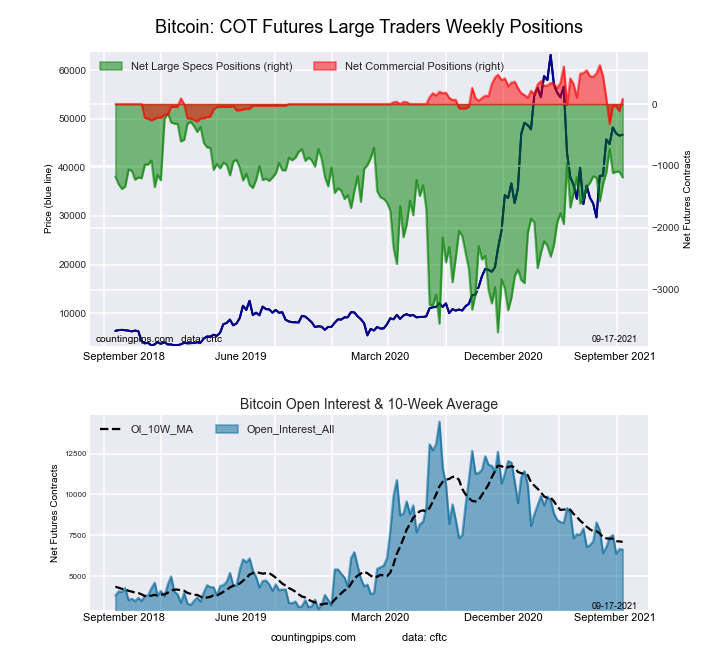 The Bitcoin large speculator standing this week recorded a net position of -1,187 contracts in the data reported through Tuesday. This was a weekly reduction of -93 contracts from the previous week which had a total of -1,094 net contracts.
This week’s current strength score (the trader positioning range over the past three years, measured from 0 to 100) shows the speculators are currently Bullish with a score of 70.5 percent. The commercials are Bearish with a score of 42.9 percent and the small traders (not shown in chart) are Bearish with a score of 25.9 percent.
| BITCOIN Statistics | SPECULATORS | COMMERCIALS | SMALL TRADERS |
| – Percent of Open Interest Longs: | 58.4 | 5.8 | 27.4 |
| – Percent of Open Interest Shorts: | 76.3 | 4.5 | 10.7 |
| – Net Position: | -1,187 | 86 | 1,101 |
| – Gross Longs: | 3,866 | 385 | 1,811 |
| – Gross Shorts: | 5,053 | 299 | 710 |
| – Long to Short Ratio: | 0.8 to 1 | 1.3 to 1 | 2.6 to 1 |
| NET POSITION TREND: | |||
| – COT Index Score (3 Year Range Pct): | 70.5 | 42.9 | 25.9 |
| – COT Index Reading (3 Year Range): | Bullish | Bearish | Bearish |
| NET POSITION MOVEMENT INDEX: | |||
| – 6-Week Change in Strength Index: | 2.9 | -37.9 | 8.5 |
Article By CountingPips.com – Receive our weekly COT Reports by Email
*COT Report: The COT data, released weekly to the public each Friday, is updated through the most recent Tuesday (data is 3 days old) and shows a quick view of how large speculators or non-commercials (for-profit traders) were positioned in the futures markets.
The CFTC categorizes trader positions according to commercial hedgers (traders who use futures contracts for hedging as part of the business), non-commercials (large traders who speculate to realize trading profits) and nonreportable traders (usually small traders/speculators).
Find CFTC criteria here: (http://www.cftc.gov/MarketReports/CommitmentsofTraders/ExplanatoryNotes/index.htm).

- COT Metals Charts: Weekly Speculator Bets led by Copper & Steel Jul 18, 2026
- COT Bonds Charts: Weekly Speculator Bets led by 2-Year, SOFR 3M & 5-Year Bonds Jul 18, 2026
- COT Energy Charts: Weekly Speculator Bets led by Brent Oil & Heating Oil Jul 18, 2026
- COT Soft Commodities Charts: Weekly Speculator Bets led by Wheat, Corn & Soybean Meal Jul 18, 2026
- The Bank of Canada kept its interest rate unchanged. Platinum prices reached a three‑week high Jul 16, 2026
- Stock indices rose after the release of US inflation data. China’s GDP slowed sharply Jul 15, 2026
- GBP/USD Awaits Political News: What Will Happen Next Jul 15, 2026
- USD/JPY Holds at Highs: Pressure Lingers on Yen Jul 14, 2026
- Oil prices jumped 4% amid a new wave of escalation between the US and Iran Jul 13, 2026
- EUR/USD: US Inflation Will Determine Everything Jul 13, 2026