by JustForex
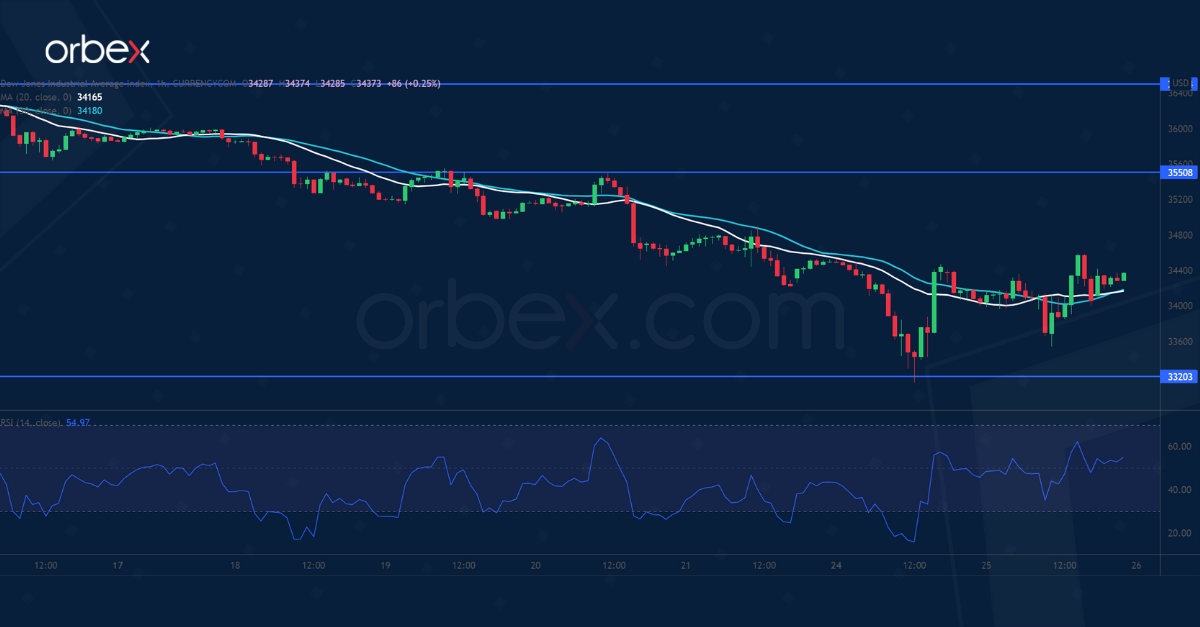
The US statistical data was positive yesterday. The number of new jobless claims in the USA was 260,000, while analysts expected 265,000. The US GDP grew by 6.9% in the fourth quarter, while the growth by 5.5% was expected. The dollar index significantly strengthened yesterday, which led to the decrease of other currencies against the dollar. At the same time, stock indices fell despite good reports from tech companies. The Dow Jones index (US30) decreased by 0.02%, the S&P 500 index (US500) fell by 0.54%, and the NASDAQ technology index (US100) lost 1.4% at the close of the stock market.
Intel Corp. stock prices decreased by 7% yesterday. One of the world’s top computer component makers cut net income by 21% in the fourth quarter of 2021 but increased revenue by 3%. Apple reported record sales over the holiday season despite a global shortage of computer chips. The company’s stock jumped by 5% on the postmarket. Meanwhile, shares of MasterCard and Visa rose on reports. In the fourth quarter of 2021, the payment companies boosted net and adjusted earnings, as well as increased revenue.
Strategists at investment bank Goldman Sachs recommend investors buy out the drawdowns now. “Any further strong weakness in the index should be seen as a buying opportunity,” the bank’s analysts, led by Peter Oppenheimer, said on Wednesday. In addition, the bank does not believe the correction will deepen into a bear market.
On Tuesday, stock indices in Europe rose at the close of trading amid positive company reports. The German DAX (DE30) gained 0.42%, the French CAC 40 (FR40) added 0.6%, the Spanish IBEX 35 (ES35) increased by 1%, and the British FTSE 100 (UK100) jumped by 1.13%. France’s economic growth in 2021 was the strongest in 52 years at 7%.
According to Gazprom, less than a quarter of the gas pumped during the summer season remains in underground gas storage facilities (UGSF) in Europe. As of Jan. 25, withdrawal reached 75.9%. According to the analyst, Europe is having a fairly mild winter so far, which is why it has been able to stretch the gas available in its underground storage facilities.
Britain and the EU are working out sanctions against new Russian gas projects in case Russia attacks Ukraine. Russia is one of the world’s largest oil and gas producers, but its energy sector relies on joint ventures with foreign companies, where financing and technology transfer may be limited.
Oil prices remain at $87 to $89 a barrel. Prices have risen about 15% since the start of the new year amid geopolitical tensions over Ukraine and threats to the United Arab Emirates by Yemeni Hussites. Analysts expect supply to remain limited as OPEC+ will maintain the existing policy of gradual increase in production, so investors should not expect a decrease in quotes soon.
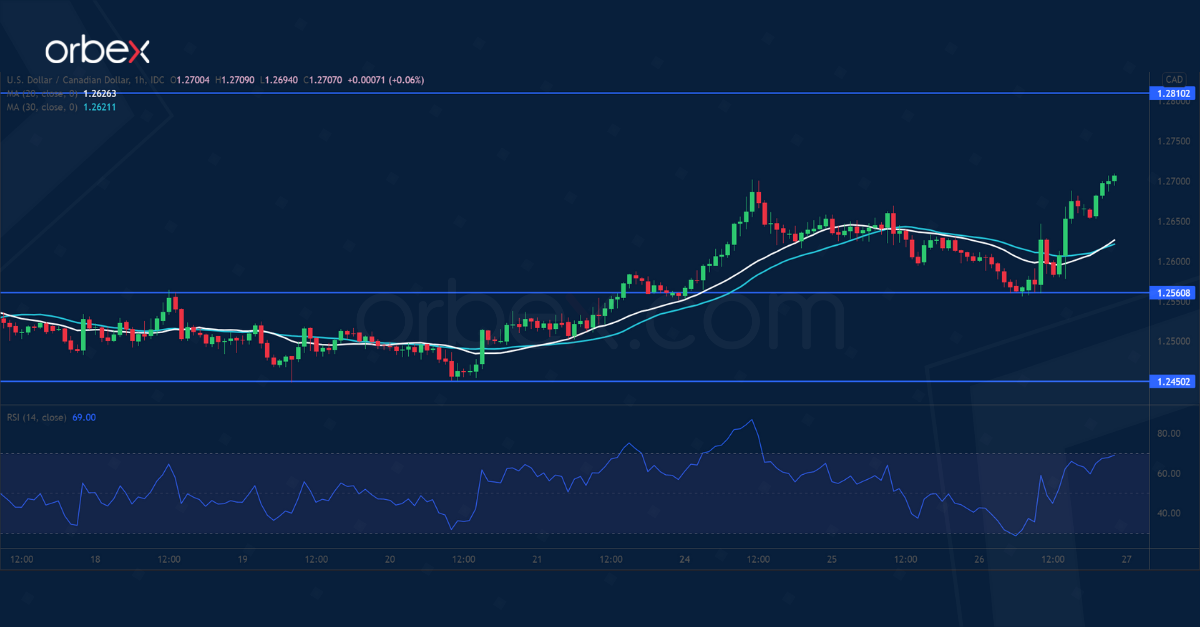
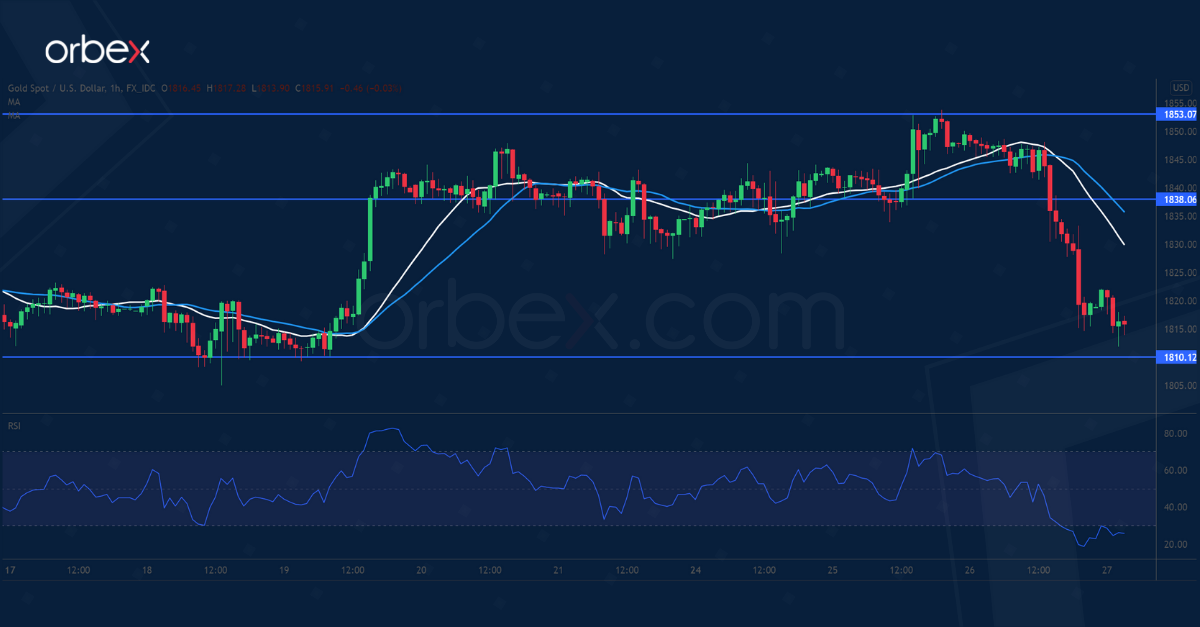
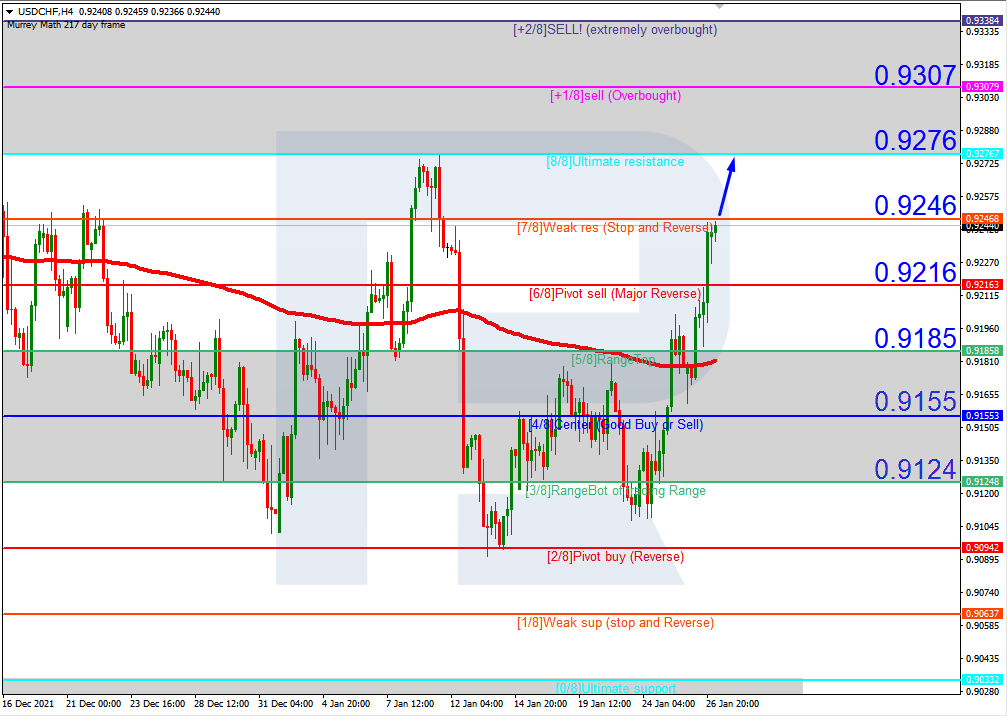
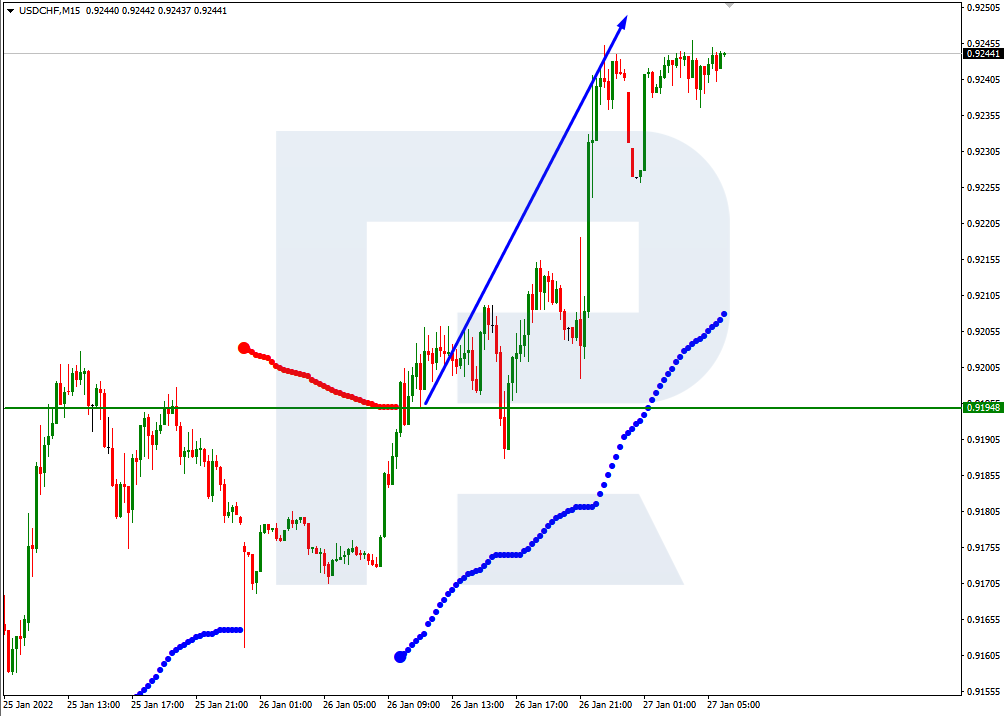
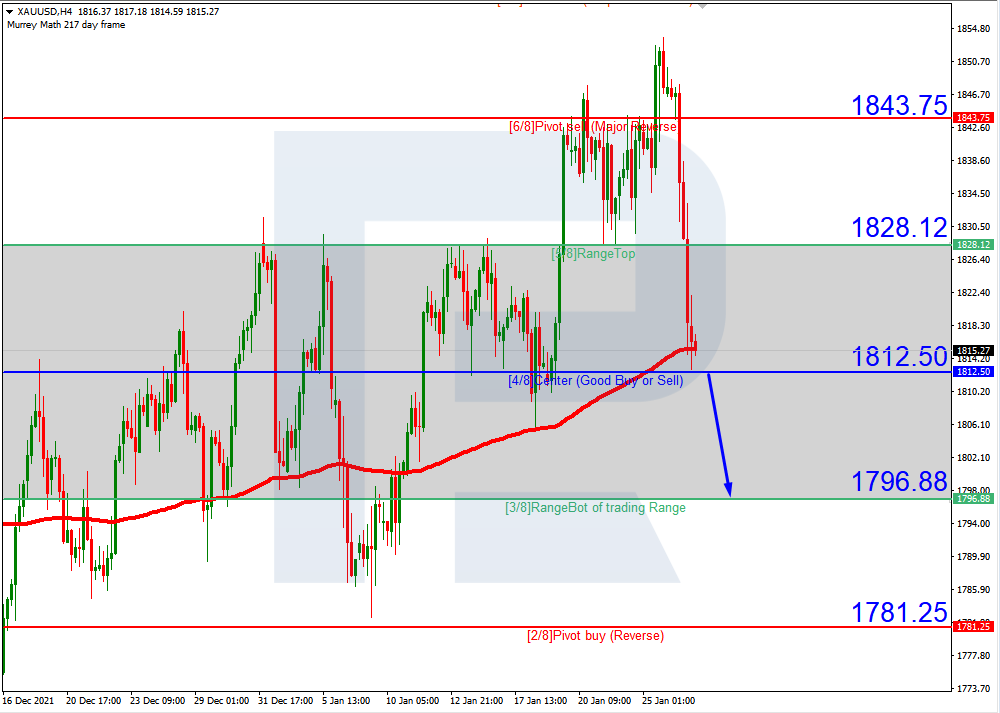
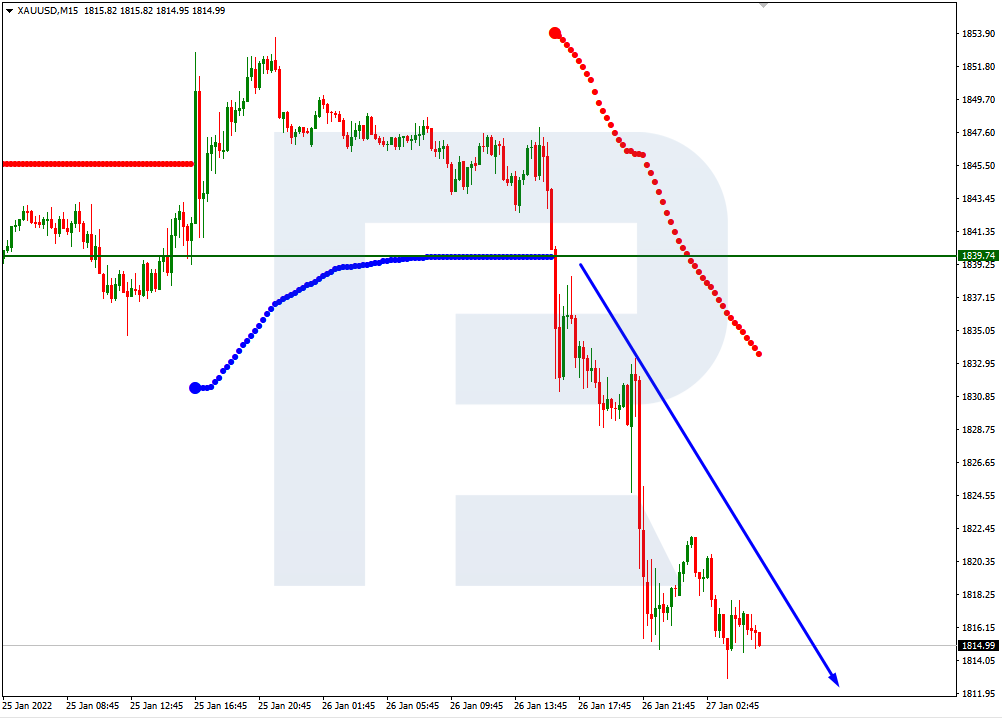
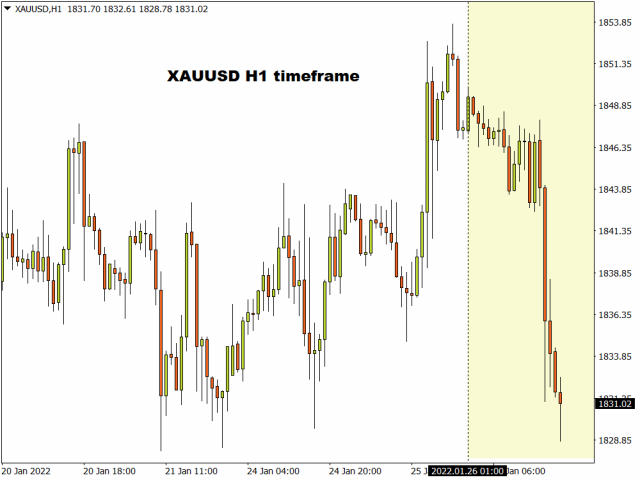
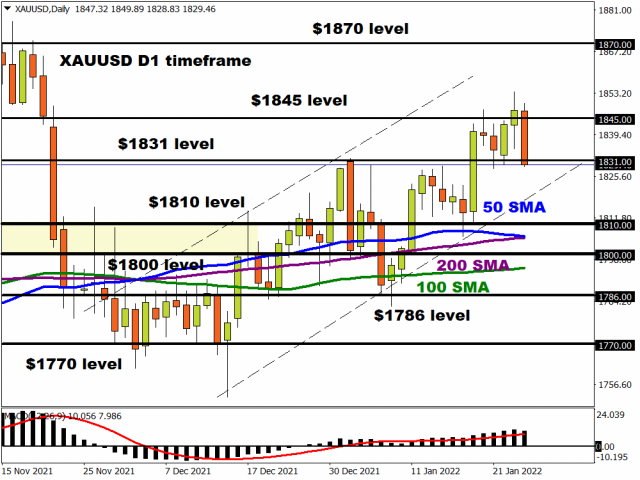
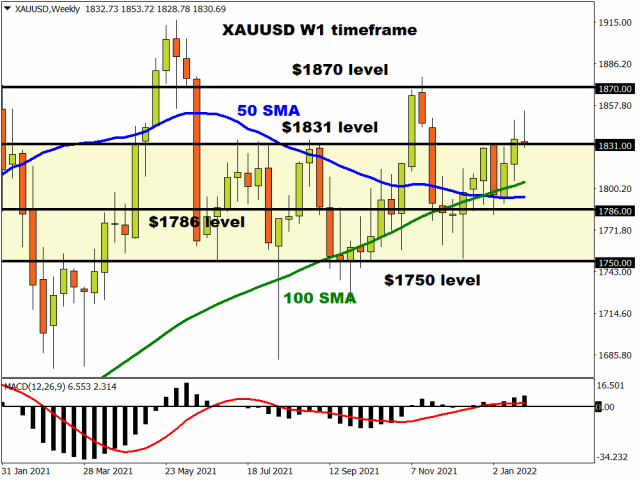
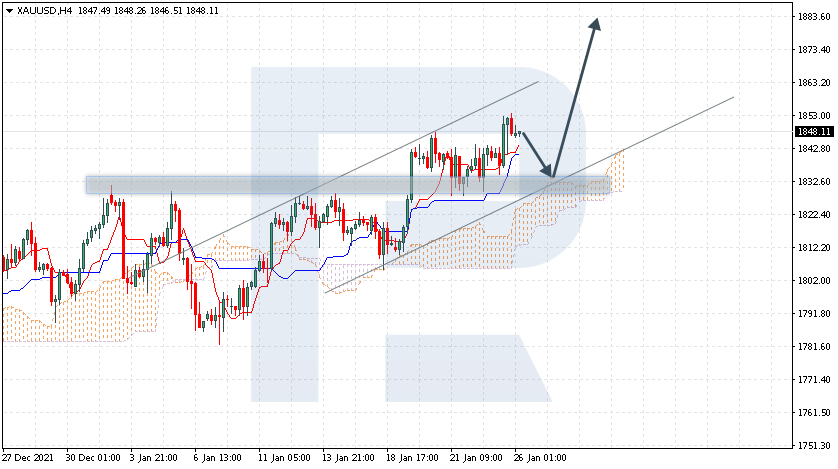
Against the background of the growth of the dollar index, the quotes of gold and silver are rapidly falling. This year, the precious metals have no fundamental support, as rising interest rates usually lead to rising government bond yields and the dollar index, which will negatively impact gold and silver.
Asian stock indices are mostly rising on Friday. Japan’s Nikkei 225 (JP225) rose 2.09% from the open, Australia’s ASX 200 gained 2.19%, but Hong Kong’s Hang Seng (HK50) decreased by 1.13%. China’s regulator said China and the US were making progress on rules for Chinese firms registered in the United States. Main market quotes:
Main market quotes:
S&P 500 (F) (US500) 4,326.51 −23.42 (−0.54%)
Dow Jones (US30) 34,160.78 −7.31 (−0.021%)
DAX (DE40) 15,524.27 +64.88 (+0.42%)
FTSE 100 (UK100) 7,554.31 +84.53 (+1.13%)
USD Index 97.23 +1.29 (+1.34%)
- – Japan Tokyo core CPI (m/m) at 01:30 (GMT+2);
- – Australia Producer Price Index (m/m) at 02:30 (GMT+2);
- – Eurozone French GDP (q/q) at 08:30 (GMT+2);
- – Eurozone Spanish GDP (q/q) at 10:00 (GMT+2);
- – Germany GDP (q/q) at 11:00 (GMT+2);
- – US PCE price index (m/m) at 15:30 (GMT+2);
- – US Michigan Consumer Sentiment (m/m) at 17:00 (GMT+2).
by JustForex
This article reflects a personal opinion and should not be interpreted as an investment advice, and/or offer, and/or a persistent request for carrying out financial transactions, and/or a guarantee, and/or a forecast of future events.