By InvestMacro
Here are the latest charts and statistics for the Commitment of Traders (COT) reports data published by the Commodities Futures Trading Commission (CFTC).
The latest COT data is updated through Tuesday June 10th and shows a quick view of how large traders (for-profit speculators and commercial entities) were positioned in the futures markets.
Weekly Speculator Changes led by Lean Hogs & Live Cattle

The COT soft commodities markets speculator bets were slightly higher this week as six out of the eleven softs markets we cover had higher positioning while the other five markets had lower speculator contracts.
Leading the gains for the softs markets was Lean Hogs (13,426 contracts) with Live Cattle (11,892 contracts), Soybeans (10,449 contracts), Soybean Meal (6,403 contracts), Wheat (3,211 contracts) and Coffee (2,289 contracts) also showing positive weeks.
The markets with the declines in speculator bets this week were Sugar (-15,671 contracts), Corn (-14,435 contracts), Cotton (-4,430 contracts), Soybean Oil (-685 contracts) and with Cocoa (-232 contracts) also registering lower bets on the week.
Price changes for the week:
– Soybean oil: up almost 6%
– Soybeans: higher by almost 2%
– Lean hogs: rose 1.4%
– Soybean meal: up 1%
– Coffee: down almost 4%
– Cocoa: down almost 3.5%
– Sugar, live cattle, wheat, corn: down over 1%
– Cotton: down almost half a percent
Soft Commodities Data:

Legend: Weekly Speculators Change | Speculators Current Net Position | Speculators Strength Score compared to last 3-Years (0-100 range)
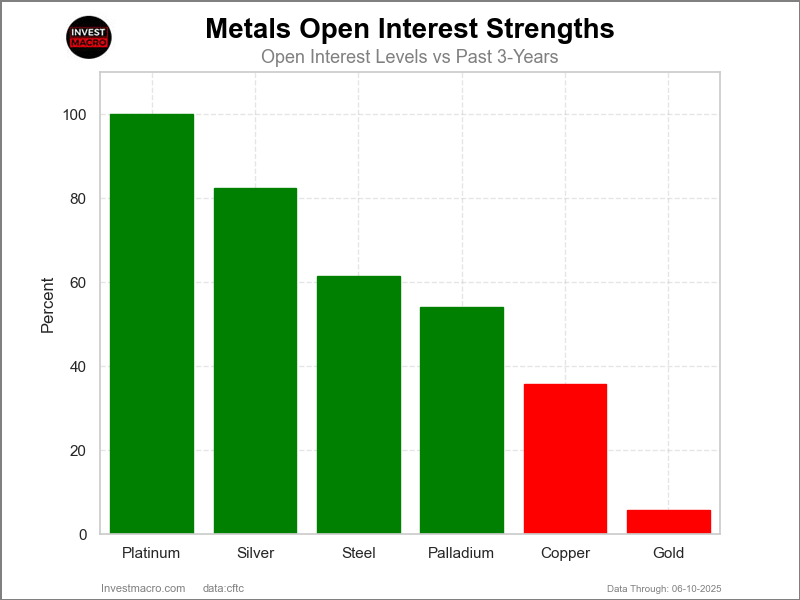
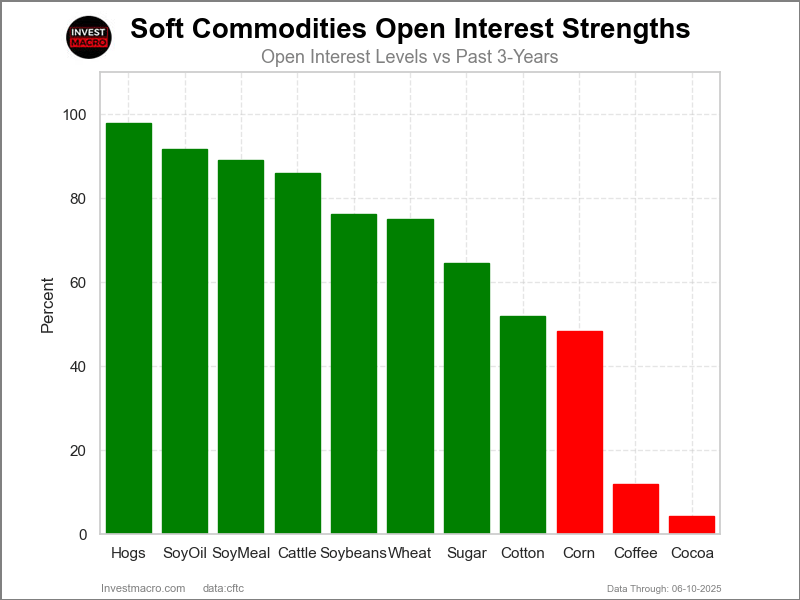
Strength Scores led by Live Cattle & Lean Hogs

COT Strength Scores (a normalized measure of Speculator positions over a 3-Year range, from 0 to 100 where above 80 is Extreme-Bullish and below 20 is Extreme-Bearish) showed that Live Cattle (92 percent) and Lean Hogs (90 percent) lead the softs markets this week. Soybeans (69 percent), Soybean Oil (65 percent) and Coffee (62 percent) come in as the next highest in the weekly strength scores.
On the downside, Sugar (4 percent), Soybean Meal (8 percent), Cotton (15 percent) and the Wheat (18 percent) come in at the lowest strength levels currently and are in Extreme-Bearish territory (below 20 percent).
Strength Statistics:
Corn (23.2 percent) vs Corn previous week (25.2 percent)
Sugar (4.3 percent) vs Sugar previous week (9.4 percent)
Coffee (62.0 percent) vs Coffee previous week (59.8 percent)
Soybeans (68.5 percent) vs Soybeans previous week (65.9 percent)
Soybean Oil (64.6 percent) vs Soybean Oil previous week (65.0 percent)
Soybean Meal (7.7 percent) vs Soybean Meal previous week (5.0 percent)
Live Cattle (91.8 percent) vs Live Cattle previous week (80.3 percent)
Lean Hogs (89.6 percent) vs Lean Hogs previous week (79.3 percent)
Cotton (15.5 percent) vs Cotton previous week (18.2 percent)
Cocoa (29.6 percent) vs Cocoa previous week (29.8 percent)
Wheat (17.7 percent) vs Wheat previous week (15.3 percent)
Lean Hogs & Wheat top the 6-Week Strength Trends

COT Strength Score Trends (or move index, calculates the 6-week changes in strength scores) showed that Lean Hogs (35 percent) and Wheat (17 percent) lead the past six weeks trends for soft commodities. Live Cattle (12 percent), Soybeans (3 percent) and Soybean Meal (2 percent) are the next highest positive movers in the latest trends data.
Corn (-37 percent) leads the downside trend scores currently with Sugar (-19 percent), Soybean Oil (-16 percent) and Cotton (-15 percent) following next with lower trend scores.
Strength Trend Statistics:
Corn (-36.9 percent) vs Corn previous week (-41.0 percent)
Sugar (-18.6 percent) vs Sugar previous week (-11.9 percent)
Coffee (-11.6 percent) vs Coffee previous week (-5.8 percent)
Soybeans (2.8 percent) vs Soybeans previous week (1.1 percent)
Soybean Oil (-16.0 percent) vs Soybean Oil previous week (-10.2 percent)
Soybean Meal (2.3 percent) vs Soybean Meal previous week (-9.7 percent)
Live Cattle (11.7 percent) vs Live Cattle previous week (4.1 percent)
Lean Hogs (34.9 percent) vs Lean Hogs previous week (27.2 percent)
Cotton (-15.2 percent) vs Cotton previous week (-4.4 percent)
Cocoa (1.9 percent) vs Cocoa previous week (4.0 percent)
Wheat (16.7 percent) vs Wheat previous week (-2.3 percent)
Individual Soft Commodities Markets:
CORN Futures:
 The CORN large speculator standing this week resulted in a net position of -95,494 contracts in the data reported through Tuesday. This was a weekly lowering of -14,435 contracts from the previous week which had a total of -81,059 net contracts.
This week’s current strength score (the trader positioning range over the past three years, measured from 0 to 100) shows the speculators are currently Bearish with a score of 23.2 percent. The commercials are Bullish with a score of 74.5 percent and the small traders (not shown in chart) are Bullish-Extreme with a score of 84.4 percent.
Price Trend-Following Model: Downtrend
Our weekly trend-following model classifies the current market price position as: Downtrend.
| CORN Futures Statistics | SPECULATORS | COMMERCIALS | SMALL TRADERS |
| – Percent of Open Interest Longs: | 19.9 | 45.9 | 9.5 |
| – Percent of Open Interest Shorts: | 25.9 | 38.8 | 10.7 |
| – Net Position: | -95,494 | 114,551 | -19,057 |
| – Gross Longs: | 321,967 | 740,542 | 153,928 |
| – Gross Shorts: | 417,461 | 625,991 | 172,985 |
| – Long to Short Ratio: | 0.8 to 1 | 1.2 to 1 | 0.9 to 1 |
| NET POSITION TREND: | | | |
| – Strength Index Score (3 Year Range Pct): | 23.2 | 74.5 | 84.4 |
| – Strength Index Reading (3 Year Range): | Bearish | Bullish | Bullish-Extreme |
| NET POSITION MOVEMENT INDEX: | | | |
| – 6-Week Change in Strength Index: | -36.9 | 36.9 | 32.3 |
SUGAR Futures:
 The SUGAR large speculator standing this week resulted in a net position of -19,515 contracts in the data reported through Tuesday. This was a weekly lowering of -15,671 contracts from the previous week which had a total of -3,844 net contracts.
This week’s current strength score (the trader positioning range over the past three years, measured from 0 to 100) shows the speculators are currently Bearish-Extreme with a score of 4.3 percent. The commercials are Bullish-Extreme with a score of 97.7 percent and the small traders (not shown in chart) are Bearish-Extreme with a score of 11.3 percent.
Price Trend-Following Model: Strong Downtrend
Our weekly trend-following model classifies the current market price position as: Strong Downtrend.
| SUGAR Futures Statistics | SPECULATORS | COMMERCIALS | SMALL TRADERS |
| – Percent of Open Interest Longs: | 24.1 | 51.4 | 7.9 |
| – Percent of Open Interest Shorts: | 26.2 | 48.5 | 8.7 |
| – Net Position: | -19,515 | 26,368 | -6,853 |
| – Gross Longs: | 217,346 | 464,706 | 71,741 |
| – Gross Shorts: | 236,861 | 438,338 | 78,594 |
| – Long to Short Ratio: | 0.9 to 1 | 1.1 to 1 | 0.9 to 1 |
| NET POSITION TREND: | | | |
| – Strength Index Score (3 Year Range Pct): | 4.3 | 97.7 | 11.3 |
| – Strength Index Reading (3 Year Range): | Bearish-Extreme | Bullish-Extreme | Bearish-Extreme |
| NET POSITION MOVEMENT INDEX: | | | |
| – 6-Week Change in Strength Index: | -18.6 | 16.5 | -3.9 |
COFFEE Futures:
 The COFFEE large speculator standing this week resulted in a net position of 37,306 contracts in the data reported through Tuesday. This was a weekly advance of 2,289 contracts from the previous week which had a total of 35,017 net contracts.
This week’s current strength score (the trader positioning range over the past three years, measured from 0 to 100) shows the speculators are currently Bullish with a score of 62.0 percent. The commercials are Bearish with a score of 38.9 percent and the small traders (not shown in chart) are Bullish with a score of 60.8 percent.
Price Trend-Following Model: Strong Downtrend
Our weekly trend-following model classifies the current market price position as: Strong Downtrend.
| COFFEE Futures Statistics | SPECULATORS | COMMERCIALS | SMALL TRADERS |
| – Percent of Open Interest Longs: | 30.8 | 40.9 | 5.9 |
| – Percent of Open Interest Shorts: | 7.3 | 66.0 | 4.3 |
| – Net Position: | 37,306 | -39,846 | 2,540 |
| – Gross Longs: | 48,931 | 65,047 | 9,338 |
| – Gross Shorts: | 11,625 | 104,893 | 6,798 |
| – Long to Short Ratio: | 4.2 to 1 | 0.6 to 1 | 1.4 to 1 |
| NET POSITION TREND: | | | |
| – Strength Index Score (3 Year Range Pct): | 62.0 | 38.9 | 60.8 |
| – Strength Index Reading (3 Year Range): | Bullish | Bearish | Bullish |
| NET POSITION MOVEMENT INDEX: | | | |
| – 6-Week Change in Strength Index: | -11.6 | 11.8 | -6.2 |
SOYBEANS Futures:
 The SOYBEANS large speculator standing this week resulted in a net position of 70,396 contracts in the data reported through Tuesday. This was a weekly advance of 10,449 contracts from the previous week which had a total of 59,947 net contracts.
This week’s current strength score (the trader positioning range over the past three years, measured from 0 to 100) shows the speculators are currently Bullish with a score of 68.5 percent. The commercials are Bearish with a score of 28.4 percent and the small traders (not shown in chart) are Bullish-Extreme with a score of 80.4 percent.
Price Trend-Following Model: Weak Downtrend
Our weekly trend-following model classifies the current market price position as: Weak Downtrend.
| SOYBEANS Futures Statistics | SPECULATORS | COMMERCIALS | SMALL TRADERS |
| – Percent of Open Interest Longs: | 22.2 | 48.4 | 6.1 |
| – Percent of Open Interest Shorts: | 14.0 | 55.2 | 7.5 |
| – Net Position: | 70,396 | -58,118 | -12,278 |
| – Gross Longs: | 190,383 | 415,951 | 52,035 |
| – Gross Shorts: | 119,987 | 474,069 | 64,313 |
| – Long to Short Ratio: | 1.6 to 1 | 0.9 to 1 | 0.8 to 1 |
| NET POSITION TREND: | | | |
| – Strength Index Score (3 Year Range Pct): | 68.5 | 28.4 | 80.4 |
| – Strength Index Reading (3 Year Range): | Bullish | Bearish | Bullish-Extreme |
| NET POSITION MOVEMENT INDEX: | | | |
| – 6-Week Change in Strength Index: | 2.8 | -5.2 | 21.4 |
SOYBEAN OIL Futures:
 The SOYBEAN OIL large speculator standing this week resulted in a net position of 41,254 contracts in the data reported through Tuesday. This was a weekly fall of -685 contracts from the previous week which had a total of 41,939 net contracts.
This week’s current strength score (the trader positioning range over the past three years, measured from 0 to 100) shows the speculators are currently Bullish with a score of 64.6 percent. The commercials are Bearish with a score of 37.6 percent and the small traders (not shown in chart) are Bearish with a score of 49.2 percent.
Price Trend-Following Model: Strong Uptrend
Our weekly trend-following model classifies the current market price position as: Strong Uptrend.
| SOYBEAN OIL Futures Statistics | SPECULATORS | COMMERCIALS | SMALL TRADERS |
| – Percent of Open Interest Longs: | 21.1 | 49.8 | 5.6 |
| – Percent of Open Interest Shorts: | 14.0 | 57.9 | 4.6 |
| – Net Position: | 41,254 | -47,032 | 5,778 |
| – Gross Longs: | 122,719 | 289,840 | 32,315 |
| – Gross Shorts: | 81,465 | 336,872 | 26,537 |
| – Long to Short Ratio: | 1.5 to 1 | 0.9 to 1 | 1.2 to 1 |
| NET POSITION TREND: | | | |
| – Strength Index Score (3 Year Range Pct): | 64.6 | 37.6 | 49.2 |
| – Strength Index Reading (3 Year Range): | Bullish | Bearish | Bearish |
| NET POSITION MOVEMENT INDEX: | | | |
| – 6-Week Change in Strength Index: | -16.0 | 17.2 | -24.6 |
SOYBEAN MEAL Futures:
 The SOYBEAN MEAL large speculator standing this week resulted in a net position of -48,116 contracts in the data reported through Tuesday. This was a weekly boost of 6,403 contracts from the previous week which had a total of -54,519 net contracts.
This week’s current strength score (the trader positioning range over the past three years, measured from 0 to 100) shows the speculators are currently Bearish-Extreme with a score of 7.7 percent. The commercials are Bullish-Extreme with a score of 88.4 percent and the small traders (not shown in chart) are Bullish with a score of 62.6 percent.
Price Trend-Following Model: Downtrend
Our weekly trend-following model classifies the current market price position as: Downtrend.
| SOYBEAN MEAL Futures Statistics | SPECULATORS | COMMERCIALS | SMALL TRADERS |
| – Percent of Open Interest Longs: | 19.6 | 49.6 | 9.1 |
| – Percent of Open Interest Shorts: | 27.6 | 45.2 | 5.6 |
| – Net Position: | -48,116 | 26,910 | 21,206 |
| – Gross Longs: | 119,357 | 301,664 | 55,209 |
| – Gross Shorts: | 167,473 | 274,754 | 34,003 |
| – Long to Short Ratio: | 0.7 to 1 | 1.1 to 1 | 1.6 to 1 |
| NET POSITION TREND: | | | |
| – Strength Index Score (3 Year Range Pct): | 7.7 | 88.4 | 62.6 |
| – Strength Index Reading (3 Year Range): | Bearish-Extreme | Bullish-Extreme | Bullish |
| NET POSITION MOVEMENT INDEX: | | | |
| – 6-Week Change in Strength Index: | 2.3 | -3.4 | 16.7 |
LIVE CATTLE Futures:
 The LIVE CATTLE large speculator standing this week resulted in a net position of 115,175 contracts in the data reported through Tuesday. This was a weekly boost of 11,892 contracts from the previous week which had a total of 103,283 net contracts.
This week’s current strength score (the trader positioning range over the past three years, measured from 0 to 100) shows the speculators are currently Bullish-Extreme with a score of 91.8 percent. The commercials are Bearish-Extreme with a score of 7.3 percent and the small traders (not shown in chart) are Bearish with a score of 24.2 percent.
Price Trend-Following Model: Strong Uptrend
Our weekly trend-following model classifies the current market price position as: Strong Uptrend.
| LIVE CATTLE Futures Statistics | SPECULATORS | COMMERCIALS | SMALL TRADERS |
| – Percent of Open Interest Longs: | 51.2 | 27.0 | 8.4 |
| – Percent of Open Interest Shorts: | 21.5 | 51.4 | 13.8 |
| – Net Position: | 115,175 | -94,472 | -20,703 |
| – Gross Longs: | 198,415 | 104,793 | 32,758 |
| – Gross Shorts: | 83,240 | 199,265 | 53,461 |
| – Long to Short Ratio: | 2.4 to 1 | 0.5 to 1 | 0.6 to 1 |
| NET POSITION TREND: | | | |
| – Strength Index Score (3 Year Range Pct): | 91.8 | 7.3 | 24.2 |
| – Strength Index Reading (3 Year Range): | Bullish-Extreme | Bearish-Extreme | Bearish |
| NET POSITION MOVEMENT INDEX: | | | |
| – 6-Week Change in Strength Index: | 11.7 | -14.1 | -1.8 |
LEAN HOGS Futures:
 The LEAN HOGS large speculator standing this week resulted in a net position of 80,002 contracts in the data reported through Tuesday. This was a weekly gain of 13,426 contracts from the previous week which had a total of 66,576 net contracts.
This week’s current strength score (the trader positioning range over the past three years, measured from 0 to 100) shows the speculators are currently Bullish-Extreme with a score of 89.6 percent. The commercials are Bearish-Extreme with a score of 6.1 percent and the small traders (not shown in chart) are Bullish with a score of 51.7 percent.
Price Trend-Following Model: Strong Uptrend
Our weekly trend-following model classifies the current market price position as: Strong Uptrend.
| LEAN HOGS Futures Statistics | SPECULATORS | COMMERCIALS | SMALL TRADERS |
| – Percent of Open Interest Longs: | 42.5 | 27.4 | 7.1 |
| – Percent of Open Interest Shorts: | 20.5 | 48.2 | 8.3 |
| – Net Position: | 80,002 | -75,715 | -4,287 |
| – Gross Longs: | 154,806 | 99,967 | 26,019 |
| – Gross Shorts: | 74,804 | 175,682 | 30,306 |
| – Long to Short Ratio: | 2.1 to 1 | 0.6 to 1 | 0.9 to 1 |
| NET POSITION TREND: | | | |
| – Strength Index Score (3 Year Range Pct): | 89.6 | 6.1 | 51.7 |
| – Strength Index Reading (3 Year Range): | Bullish-Extreme | Bearish-Extreme | Bullish |
| NET POSITION MOVEMENT INDEX: | | | |
| – 6-Week Change in Strength Index: | 34.9 | -35.1 | -23.9 |
COTTON Futures:
 The COTTON large speculator standing this week resulted in a net position of -36,670 contracts in the data reported through Tuesday. This was a weekly lowering of -4,430 contracts from the previous week which had a total of -32,240 net contracts.
This week’s current strength score (the trader positioning range over the past three years, measured from 0 to 100) shows the speculators are currently Bearish-Extreme with a score of 15.5 percent. The commercials are Bullish-Extreme with a score of 85.8 percent and the small traders (not shown in chart) are Bearish with a score of 20.6 percent.
Price Trend-Following Model: Downtrend
Our weekly trend-following model classifies the current market price position as: Downtrend.
| COTTON Futures Statistics | SPECULATORS | COMMERCIALS | SMALL TRADERS |
| – Percent of Open Interest Longs: | 27.2 | 48.2 | 5.8 |
| – Percent of Open Interest Shorts: | 43.1 | 32.3 | 5.9 |
| – Net Position: | -36,670 | 36,928 | -258 |
| – Gross Longs: | 63,049 | 111,610 | 13,415 |
| – Gross Shorts: | 99,719 | 74,682 | 13,673 |
| – Long to Short Ratio: | 0.6 to 1 | 1.5 to 1 | 1.0 to 1 |
| NET POSITION TREND: | | | |
| – Strength Index Score (3 Year Range Pct): | 15.5 | 85.8 | 20.6 |
| – Strength Index Reading (3 Year Range): | Bearish-Extreme | Bullish-Extreme | Bearish |
| NET POSITION MOVEMENT INDEX: | | | |
| – 6-Week Change in Strength Index: | -15.2 | 12.9 | 17.6 |
COCOA Futures:
 The COCOA large speculator standing this week resulted in a net position of 19,238 contracts in the data reported through Tuesday. This was a weekly decrease of -232 contracts from the previous week which had a total of 19,470 net contracts.
This week’s current strength score (the trader positioning range over the past three years, measured from 0 to 100) shows the speculators are currently Bearish with a score of 29.6 percent. The commercials are Bullish with a score of 67.9 percent and the small traders (not shown in chart) are Bullish-Extreme with a score of 84.0 percent.
Price Trend-Following Model: Downtrend
Our weekly trend-following model classifies the current market price position as: Downtrend.
| COCOA Futures Statistics | SPECULATORS | COMMERCIALS | SMALL TRADERS |
| – Percent of Open Interest Longs: | 32.9 | 36.6 | 11.9 |
| – Percent of Open Interest Shorts: | 13.6 | 62.0 | 5.7 |
| – Net Position: | 19,238 | -25,428 | 6,190 |
| – Gross Longs: | 32,877 | 36,613 | 11,881 |
| – Gross Shorts: | 13,639 | 62,041 | 5,691 |
| – Long to Short Ratio: | 2.4 to 1 | 0.6 to 1 | 2.1 to 1 |
| NET POSITION TREND: | | | |
| – Strength Index Score (3 Year Range Pct): | 29.6 | 67.9 | 84.0 |
| – Strength Index Reading (3 Year Range): | Bearish | Bullish | Bullish-Extreme |
| NET POSITION MOVEMENT INDEX: | | | |
| – 6-Week Change in Strength Index: | 1.9 | -3.8 | 20.1 |
WHEAT Futures:
 The WHEAT large speculator standing this week resulted in a net position of -93,863 contracts in the data reported through Tuesday. This was a weekly gain of 3,211 contracts from the previous week which had a total of -97,074 net contracts.
This week’s current strength score (the trader positioning range over the past three years, measured from 0 to 100) shows the speculators are currently Bearish-Extreme with a score of 17.7 percent. The commercials are Bullish-Extreme with a score of 85.2 percent and the small traders (not shown in chart) are Bullish with a score of 58.1 percent.
Price Trend-Following Model: Downtrend
Our weekly trend-following model classifies the current market price position as: Downtrend.
| WHEAT Futures Statistics | SPECULATORS | COMMERCIALS | SMALL TRADERS |
| – Percent of Open Interest Longs: | 24.6 | 38.2 | 8.4 |
| – Percent of Open Interest Shorts: | 45.8 | 17.0 | 8.3 |
| – Net Position: | -93,863 | 93,573 | 290 |
| – Gross Longs: | 108,768 | 168,704 | 37,049 |
| – Gross Shorts: | 202,631 | 75,131 | 36,759 |
| – Long to Short Ratio: | 0.5 to 1 | 2.2 to 1 | 1.0 to 1 |
| NET POSITION TREND: | | | |
| – Strength Index Score (3 Year Range Pct): | 17.7 | 85.2 | 58.1 |
| – Strength Index Reading (3 Year Range): | Bearish-Extreme | Bullish-Extreme | Bullish |
| NET POSITION MOVEMENT INDEX: | | | |
| – 6-Week Change in Strength Index: | 16.7 | -12.5 | -38.4 |
Article By InvestMacro – Receive our weekly COT Newsletter
*COT Report: The COT data, released weekly to the public each Friday, is updated through the most recent Tuesday (data is 3 days old) and shows a quick view of how large speculators or non-commercials (for-profit traders) were positioned in the futures markets.
The CFTC categorizes trader positions according to commercial hedgers (traders who use futures contracts for hedging as part of the business), non-commercials (large traders who speculate to realize trading profits) and nonreportable traders (usually small traders/speculators) as well as their open interest (contracts open in the market at time of reporting). See CFTC criteria here.