Archive for Financial News – Page 263

Murrey Math Lines 02.12.2022 (Brent, S&P 500)

By RoboForex.com

BRENT

On H4, the quotes are under the 200-day Moving Average, which indicates the prevalence of a downtrend. The RSI has broken through the ascending trendline downwards. Hence, we should expect a test of 3/8 (84.38), a breakaway of it, and falling to the support level of 2/8 (81.25). The scenario can be cancelled by rising over the resistance level of 4/8 (87.50). In this case, the quotes may rise to 5/8 (90.62).

BRENTH4
Risk Warning: the result of previous trading operations do not guarantee the same results in the future

On M15, further decline of the price can be signaled by a breakaway of the lower line of VoltyChannel.

BRENT_M15
Risk Warning: the result of previous trading operations do not guarantee the same results in the future

S&P 500

On H4, the quotes have broken through the 200-day Moving Average and rest above it, which indicates possible development of an uptrend. The RSI has bounced off the ascending trendline and continues going upwards. Hence, we should expect further growth of the quotes to the nearest resistance level of 3/8 (4218.8). The scenario can be cancelled by a downwards breakaway of the support level of 2/8 (4062.5). This might entail further falling of the quotes to 1/8 (3906.2).

S&P 500_H4
Risk Warning: the result of previous trading operations do not guarantee the same results in the future

On M15, the upper line of VoltyChannel is broken away, which increases the probability of price growth to 3/8 (4218.8) on H4.

S&P 500_M15

Article By RoboForex.com

Attention!
Forecasts presented in this section only reflect the author’s private opinion and should not be considered as guidance for trading. RoboForex LP bears no responsibility for trading results based on trading recommendations described in these analytical reviews.

Japanese Candlesticks Analysis 02.12.2022 (EURUSD, USDJPY, EURGBP)

By RoboForex.com

EURUSD, “Euro vs US Dollar”

On H4, at the resistance level, the pair has formed a Shooting Star reversal pattern. Currently, the pair may go by the signal in a correctional wave. The goal of the pullback will be 1.0435. However, the pair might grow to 1.0650, break through the level, and continue the uptrend without any correction to the support level.

EURUSD
Risk Warning: the result of previous trading operations do not guarantee the same results in the future

USDJPY, “US Dollar vs Japanese Yen”

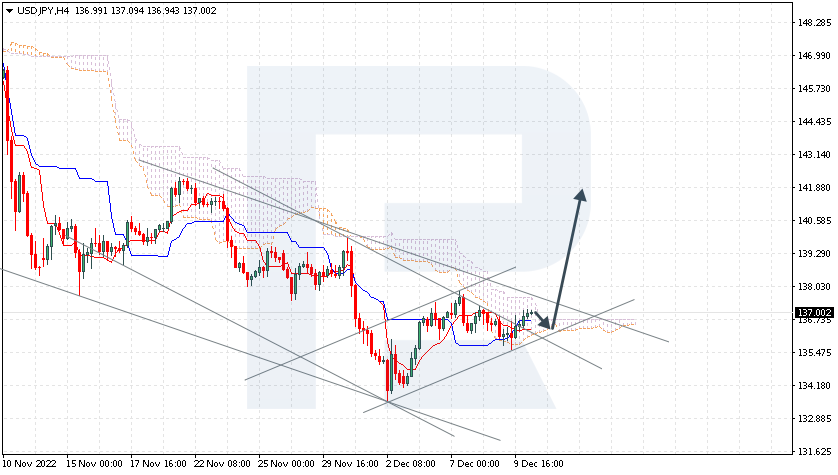
On H4, at the support level, the pair has formed an Inverted Hammer reversal pattern. Currently, the pair may go by the signal in the form of an ascending wave. The goal of the correction will be 136.65. However, the price might fall to 134.00 and continue the downtrend without any correction to the resistance level.

USDJPY
Risk Warning: the result of previous trading operations do not guarantee the same results in the future

EURGBP, “Euro vs Great Britain Pound”

On H4, the pair has formed a Hammer reversal pattern. Currently, the pair may go by the signal in yet another ascending wave. The goal of the growth can be the resistance level of 0.8655. Upon testing it and bouncing off it, the price will get a chance for continuing the downtrend. However, the quotes may drop to 0.8570 without pulling back to the resistance level.

EURGBP

Article By RoboForex.com

Attention!
Forecasts presented in this section only reflect the author’s private opinion and should not be considered as guidance for trading. RoboForex LP bears no responsibility for trading results based on trading recommendations described in these analytical reviews.

The Analytical Overview of the Main Currency Pairs on 2022.12.02

By JustMarkets

The EUR/USD currency pair

Technical indicators of the currency pair:
  • Prev Open: 1.0405
  • Prev Close: 1.0525
  • % chg. over the last day: +1.15 %

Eurozone manufacturing PMI showed a decline from 47.3 to 47.1. Data for European countries were mixed. Germany posted a decline from 46.7 to 46.2, France showed a decline from 49.1 to 48.3, but Spain’s PMI rose from 44.7 to 45.7, and Italy also saw an increase from 46.5 to 48.4. The unemployment rate in Europe declined from 6.6% to 6.5%. A strong labor market is room for the ECB to act more aggressively, but a drop in overall business activity is a sign of rate pressure on the economy. Therefore, the ECB is likely to choose a less aggressive path, especially given the fact that there are signs of slowing inflation.

Trading recommendations
  • Support levels: 1.04554, 1.0361, 1.0332, 1.0284, 1.0193, 1.0092, 1.0043, 0.9968
  • Resistance levels: 1.0504, 1.0562

The trend on the EUR/USD currency pair on the hourly time frame is bullish. The price is trading above the moving averages, and the MACD indicator is in the positive zone, without any signs of reversal but with signs of overbuying. Buy trades are best considered from the support level of 1.0455, but with additional confirmation. Sell deals can be considered from the resistance level of 1.0504 or 1.0562, but it is better with confirmation in the form of reverse initiative.

Alternative scenario: if the price breaks down through the support level of 1.0284 and fixes below it, the downtrend will likely resume.

EUR/USD
News feed for 2022.12.02:
  • – Eurozone ECB President Lagarde Speaks at 04:40 (GMT+3);
  • – Eurozone Producer Price Index (m/m) at 12:00 (GMT+3);
  • – US Nonfarm Payrolls (m/m) at 15:30 (GMT+3);
  • – US Unemployment Rate (m/m) at 15:30 (GMT+3).

The GBP/USD currency pair

Technical indicators of the currency pair:
  • Prev Open: 1.2055
  • Prev Close: 1.2255
  • % chg. over the last day: +1.65 %

The UK Manufacturing Business Activity Index is starting to show small signs of recovery. Whether this is a temporary spike in activity in the run-up to the holidays or whether it is consistent growth, data will show next month. For now, the British pound is rising on the back of a declining dollar index. Data from retail traders show that about 35% have a net long position, and the ratio of short to long traders is 1.87:1. Usually, analysts take the opposite view of the “crowd” sentiment. The fact that traders are closing short positions suggests that GBP/USD prices may continue to rise.

Trading recommendations
  • Support levels: 1.2154, 1.2016, 1.1964, 1.1684, 1.1476, 1.1418
  • Resistance levels: 1.2254, 1.2381, 1.2431

From the technical point of view, the trend on the GBP/USD currency pair on the hourly time frame is bullish. The price is trading above the moving levels MACD indicator is in the positive zone, and there are signs of overbuying. Under such market conditions, it is better to look for buy deals from the support level of 1.2154, but with confirmation. It is better to look for sell deals on intraday time frames from the resistance level of 1.2254, but it is also better with confirmation because the level has already been tested.

Alternative scenario: if the price breaks down of the 1.1900 support level and fixes below it, the downtrend will likely resume.

GBP/USD
There is no news feed for today:

The USD/JPY currency pair

Technical indicators of the currency pair:
  • Prev Open: 138.02
  • Prev Close: 135.33
  • % chg. over the last day: -1.98 %

Bank of Japan Governor Kuroda said Friday that the bank expects inflation in Japan to start slowing in 2023. That suggests the Bank of Japan won’t change its soft monetary policy until at least the spring of 2023, when Mr. Kuroda’s term ends. The Japanese yen is now strengthening only at the expense of the dollar index on the back of the fact that the Fed will slow the pace of interest rate hikes.

Trading recommendations
  • Support levels: 135.20, 133.53
  • Resistance levels: 137.65, 139.09, 140.75, 143.17, 145.16

From the technical point of view, the medium-term trend on the currency pair USD/JPY is bearish. The MACD indicator is in the negative zone, but on the higher time frames, a divergence is formed, which indicates a certain weakness of the sellers. Under such market conditions, buy trades can be sought on the intraday time frames from the support level of 135.20, but only with confirmation. There is none at the moment. Sell deals can be sought from the resistance level of 136.65 or 139.09, provided there is a reverse reaction.

Alternative scenario: If the price fixes above 140.75, the uptrend will likely resume.

USD/JPY
News feed for 2022.12.02:
  • – Japan BoJ Kuroda Speaks at 03:30 (GMT+3).

The USD/CAD currency pair

Technical indicators of the currency pair:
  • Prev Open: 1.3424
  • Prev Close: 1.3431
  • % chg. over the last day: +0.05 %

Canada’s manufacturing economy remained in contractionary territory in November, but only because the rate of decline in output and new orders slowed compared to October. But overall, there are signs of an improving business climate. The Industrial PMI rose from 48.8 to 49.6 and is as close to 50 as possible. Values above 50 mean that the economy is recovering.

Trading recommendations
  • Support levels: 1.3386, 1.3360, 1.3281, 1.3212
  • Resistance levels: 1.3479, 1.3522, 1.3658, 1.3682, 1.3776, 1.3855

From the point of view of technical analysis, the trend on the USD/CAD currency pair has changed to bullish. But the price is close to changing the priority. The MACD indicator is in the negative zone, but sellers’ pressure is weak. The deals to buy should be considered on the lower time frames from the support level of 1.3386 or 1.3360, but with additional confirmation. For sell deals, it is better to consider the resistance level of 1.3479 but with confirmation in the form of reverse initiative.

Alternative scenario: if the price breaks down and consolidates below the support level of 1.3386, the downtrend will likely resume.

USD/CAD
News feed for 2022.12.02:
  • – Canada Unemployment Rate (m/m) at 15:30 (GMT+3).

By JustMarkets


This article reflects a personal opinion and should not be interpreted as an investment advice, and/or offer, and/or a persistent request for carrying out financial transactions, and/or a guarantee, and/or a forecast of future events.

EU governments have set a price ceiling for Russian oil. NFP report in the spotlight today

By JustMarkets

The US stock market traded mixed yesterday ahead of the monthly jobs report due today. The Dow Jones Index (US30) decreased by 0.08% at the stock market’s close yesterday, while the S&P 500 Index (US500) lost 0.08%. The NASDAQ Technology Index (US100) gained 0.13% on Thursday.

Investors are cautiously awaiting the release of key monthly US employment data, which could affect the Federal Reserve’s monetary policy. The monthly employment data is expected to show that the economy created fewer jobs in November than in the previous month. Treasury yields fell sharply yesterday on concerns that the economy could face a deeper recession next year, despite early signs of declining consumer inflation. Although data on Thursday showed that the PCE index, the Federal Reserve’s preferred measure of inflation, remains well above (6%) the Central Bank’s target range (2%).

Equity markets in Europe were mostly up yesterday. German DAX (DE30) gained 0.65%, French CAC 40 (FR40) added 0.23%, Spanish IBEX 35 (ES35) increased by 0.53%, and British FTSE 100 (UK100) closed on Thursday down by 0.19%.

In a speech in Thailand, European Central Bank President Lagarde said that central banks should work to get the Consumer Price Index back to target levels. But monetary policy is complicated by the uncertainty resulting from Russia’s invasion of Ukraine. Ms. Lagarde also added that the fiscal policies of some European governments may lead to excess demand and that fiscal and monetary policies must work in sync to ensure sustainable and balanced economic growth.

Oil prices traded mixed Thursday as worrisome US production data and uncertainty over the course of OPEC+ actions restrained the market. European Union governments have tentatively agreed to set a ceiling on Russian oil at $60 a barrel, which is also restraining oil bulls.

Gold hit a 5-month high on rising hopes of a slowdown in the pace of Fed rate hikes. Gold futures yesterday at $1,815.20 an ounce. Silver, which often follows gold, also rose sharply. The December through February period is a seasonally stronger time for precious metals, so there are many positives here.

Asian markets were mostly up yesterday. Japan’s Nikkei 225 (JP225) gained 0.92% on the day, Hong Kong’s Hang Seng (HK50) added 0.75%, and Australia’s S&P/ASX 200 (AU200) closed up 0.96%.

Bank of Japan Governor Kuroda indicated that a gradual slowdown in global rate increases and gradual growth of the global economy is expected. Global inflation is also expected to exceed the 2021 level in 2022 and then decline in 2023, a forecast that applies to Japan as well.

Reserve Bank of Australia Governor Lowe, speaking at an event in Thailand, pointed out that inflation expectations remain firmly entrenched. However, household spending in Australia is still resilient to higher interest rates. Lowe added that the Reserve Bank of Australia is trying to slow inflation without much negative impact on the economy. Still, this cycle of high rates will be longer than previous ones.

S&P 500 (F) (US500) 4,076.57 −3.54 (−0.087%)

Dow Jones (US30) 34,395.01 −194.76 (−0.56%)

DAX (DE40) 14,490.30 +93.26 (+0.65%)

FTSE 100 (UK100) 7,558.49 −14.56 (−0.19%)

USD Index 104.71 −1.24 (−1.17%)

Important events for today:
  • – Japan BoJ Kuroda Speaks at 03:30 (GMT+3);
  • – Australia RBA Gov Lowe Speaks at 04:40 (GMT+3);
  • – Eurozone ECB President Lagarde Speaks at 04:40 (GMT+3);
  • – New Zealand RBNZ Gov Orr Speaks at 06:30 (GMT+3);
  • – Switzerland Unemployment Rate (m/m) at 09:30 (GMT+3);
  • – Eurozone Producer Price Index (m/m) at 12:00 (GMT+3);
  • – US Nonfarm Payrolls (m/m) at 15:30 (GMT+3);
  • – US Unemployment Rate (m/m) at 15:30 (GMT+3);
  • – Canada Unemployment Rate (m/m) at 15:30 (GMT+3).

By JustMarkets


This article reflects a personal opinion and should not be interpreted as an investment advice, and/or offer, and/or a persistent request for carrying out financial transactions, and/or a guarantee, and/or a forecast of future events.

Week Ahead: Big Week For Oil Markets…

By ForexTime 

Fasten your seatbelts because the next few days could be wild for oil markets.

The global commodity may be injected with fresh volatility due to not only the OPEC+ meeting but developments revolving around European Union sanctions on Russian oil. Other factors like geopolitical risks, economic data and overall sentiment may play an important role in shaping the global commodities outlook for the rest of 2022.

Before we tackle what to expect from oil as December gets in full swing, here are the scheduled economic data releases/events in the coming week:

Sunday, 4 December  

  • OIL: OPEC+ virtual meeting   

Monday, 5 December  

  • CNH: China Caixin services PMI
  • OIL: EU ban on Russian crude  
  • EUR: S&P Global PMI, Eurozone retail sales, ECB President Christine Lagarde speech
  • USD: US factory orders, durable goods, ISM services index

Tuesday, 6 December

  • AUD: Reserve Bank of Australia rate decision   
  • EUR: Germany factory orders, S&P Global PMI
  • USD: US trade data

Wednesday, 7 December

  • EUR: Eurozone GDP, Germany industrial production
  • CAD: Bank of Canada rate decision
  • OIL: EIA crude oil inventory report
  • USD: MBA mortgage applications

Thursday, 8 December

  • JPY: Japan GDP
  • EUR: ECB President Christine Lagarde speech
  • USD: US initial jobless claims

Friday, 9 December

  • CNH: China Inflation, PPI, money supply
  • USD: US PPI, University of Michigan consumer sentiment
  • FIFA World Cup quarterfinal matches

Oil prices nosedived in November as concerns that a rebound in Covid-19 cases in China would hit demand. Rising US stock pilled rubbed salt into the wound with Brent shedding almost 10% last month. Nevertheless, both Crude and Brent are still up roughly 10% year-to-date and could be supported by the key risk events and data releases over the next few days.

Over the weekend, the Organisation of Petroleum Exporting Countries and Co. including Russia are expected to leave production unchanged after the group changed its meeting to an online format. This move comes after the cartel agreed in early October to reduce production by 2 million barrels per day from November despite calls from the United States to pump more oil. The decision to leave production unchanged is based on the growing uncertainty over China’s demand outlook and the looming price cap on Russian crude exports. However, any unexpected decisions could result in explosive volatility in oil markets.

It’s all about the upcoming sanctions on Russian oil which are expected to start on Monday 5th December. Back in June, the EU agreed to ban the purchase of Russian crude in an attempt to limit its earnings – ultimately impacting Moscow’s budget. According to Bloomberg, the EU is closing in a deal to cap Russian crude oil at $60 a barrel before the Monday deadline. Should this deal go through, it could have uncertain effects on the price of oil as concerns over lost supply through the price cap clash with fears over a gloomy demand outlook. Whatever the outcome on Sunday and Monday, it will most likely set the tone for oil as 2022 slowly comes to an end.

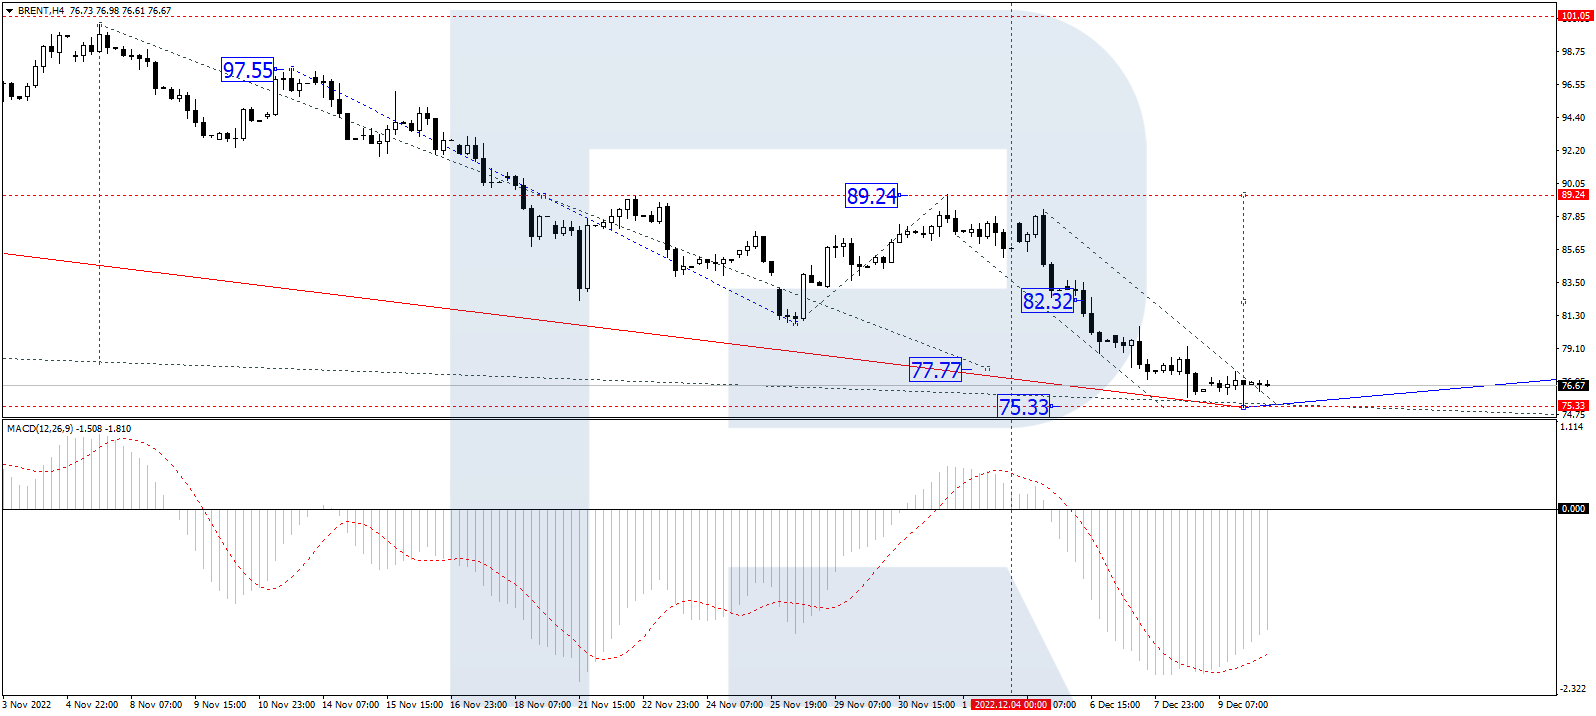
Looking at the technical picture, Brent remains under pressure on the daily charts with prices respecting a bearish channel. Should prices push back below $87 this could encourage a decline back toward $82.50 and $80.00. Alternatively, a strong breakout above $90.00 may open the doors towards $95.00 – a level above the 100-day SMA.


Forex-Time-LogoArticle by ForexTime

ForexTime Ltd (FXTM) is an award winning international online forex broker regulated by CySEC 185/12 www.forextime.com

Expert Says Health Tech Co. Is in Another Buy Spot

Source: Clive Maund  (11/30/22)

Expert Clive Maund reviews the 1-year chart for Reliq Health Technologies to tell you why he believes it is in another buy spot.

We caught a perfect buy spot when we went for Reliq Health Technologies Inc. (RHT:TSX.V; RQHTF:OTCQB; A2AJTB:WKN) at the start of the month (it was recommended in a Market Notebook update), as right after it proceeded to break out of a quite large Head-and-Shoulders bottom to rise quite steeply, resulting in good percentage gains for us in a short space of time.

The purpose of this update is to point out that it still looks good here.

It is, in fact, at another buy spot as it is starting to break out of a completing bull Flag that has formed over the past couple of weeks, as we can see on its latest 1-year chart below.

November 21, 2022, would have been the perfect time to buy, of course, because it ended up adding CA$0.04 by the end of the day, but it still looks good here as a breakout from the Flag should lead to a rally of similar magnitude to the one preceding the Flag.

We, therefore, stay long and this is a good point to add to positions or make fresh purchases. Reliq trades in reasonable volumes on the US OTC market.

Reliq Health Tech closed for trading at CA$0.71, $0.54 on November 21, 2022. It is currently trading at CA$0.69.

CliveMaund.com Disclosures

The above represents the opinion and analysis of Mr. Maund, based on data available to him, at the time of writing. Mr. Maund’s opinions are his own, and are not a recommendation or an offer to buy or sell securities. Mr. Maund is an independent analyst who receives no compensation of any kind from any groups, individuals or corporations mentioned in his reports. As trading and investing in any financial markets may involve serious risk of loss, Mr. Maund recommends that you consult with a qualified investment advisor, one licensed by appropriate regulatory agencies in your legal jurisdiction and do your own due diligence and research when making any kind of a transaction with financial ramifications. Although a qualified and experienced stock market analyst, Clive Maund is not a Registered Securities Advisor. Therefore Mr. Maund’s opinions on the market and stocks can only be construed as a solicitation to buy and sell securities when they are subject to the prior approval and endorsement of a Registered Securities Advisor operating in accordance with the appropriate regulations in your area of jurisdiction.

Disclosures:
1) Clive Maund: I, or members of my immediate household or family, own securities of the following companies mentioned in this article: None. I personally am, or members of my immediate household or family are, paid by the following companies mentioned in this article: None.

2) The following companies mentioned in this article are billboard sponsors of Streetwise Reports: Reliq Health Technologies Inc. Click here for important disclosures about sponsor fees.

3) Statements and opinions expressed are the opinions of the author and not of Streetwise Reports or its officers. The author is wholly responsible for the validity of the statements. The author was not paid by Streetwise Reports for this article. Streetwise Reports was not paid by the author to publish or syndicate this article. Streetwise Reports requires contributing authors to disclose any shareholdings in, or economic relationships with, companies that they write about. Streetwise Reports relies upon the authors to accurately provide this information and Streetwise Reports has no means of verifying its accuracy.

4) This article does not constitute investment advice. Each reader is encouraged to consult with his or her individual financial professional and any action a reader takes as a result of information presented here is his or her own responsibility. By opening this page, each reader accepts and agrees to Streetwise Reports’ terms of use and full legal disclaimer. This article is not a solicitation for investment. Streetwise Reports does not render general or specific investment advice and the information on Streetwise Reports should not be considered a recommendation to buy or sell any security. Streetwise Reports does not endorse or recommend the business, products, services or securities of any company mentioned on Streetwise Reports.

5) From time to time, Streetwise Reports LLC and its directors, officers, employees or members of their families, as well as persons interviewed for articles and interviews on the site, may have a long or short position in securities mentioned. Directors, officers, employees or members of their immediate families are prohibited from making purchases and/or sales of those securities in the open market or otherwise from the time of the decision to publish an article until three business days after the publication of the article. The foregoing prohibition does not apply to articles that in substance only restate previously published company releases. As of the date of this article, officers and/or employees of Streetwise Reports LLC (including members of their household) own securities of Reliq Health Technologies Inc., a company mentioned in this article.

Equipment Dealer Posts Record 88% Increase in Q3 EPS

Source: Streetwise Reports  (12/1/22)

Shares of Titan Machinery Inc. traded 26% higher yesterday to a new 52-week high after the company reported Q3/23 financial results, highlighting a 47.3% YoY increase in revenue. The firm additionally raised its full-year revenue and earnings estimates.

Agricultural and construction equipment dealer

Titan Machinery Inc. (TITN:NASDA), which owns and operates more than 100 full-service stores in the U.S. and Europe, yesterday announced financial results for the third quarter of 2023, which ended October 31, 2022.

The company’s Chairman and CEO, David Meyer, led off the report by stating, “We delivered another consecutive quarter of record financial results, with third-quarter earnings per share of US$1.82. The ongoing strength of the agriculture sector combined with our customer-centric focus drove consolidated revenue growth of 47%, which was supported by strong contributions across each of our revenue streams – equipment, parts, and service . . . Given these strong third-quarter results, coupled with our expectations for the solid market fundamentals continuing through the fourth quarter, we are increasing our earnings per share modeling assumption for the fiscal year 2023 to a midpoint of US$4.70 per share.”

Gross profit in Q3/23 rose to US$139.6 million (20.9%), up from US$92.5 million (20.4%) in Q3/22. The company indicated that the increases were due mostly to stronger margins from equipment sales.

The firm reported that total revenue during Q3/23 increased by 47.3% to US$668.8 million, compared to US$454.0 million in Q3/22.

Revenues across almost all business segments increased versus the same period in the prior year and consisted of US$509.0 million from Equipment sales, US$108.7 million from parts sales, US$39.0 from Service, and US$12.1 million from rental and other sales.

Gross profit in Q3/23 rose to US$139.6 million (20.9%), up from US$92.5 million (20.4%) in Q3/22. The company indicated that the increases were due mostly to stronger margins from equipment sales.

Titan Machinery reported that for Q3/23, it recorded a net income of US$41.3 million, or US$1.83 per diluted share, versus a net income of US$21.8 million, or US$0.97 per share in Q3/22.

The firm added that during Q3/23, adjusted EBITDA increased by 80% to US$63.5 million, compared to US$35.3 million in Q3/22.

The company advised that in Q3/23, agriculture segment revenues grew to US$493.3 million, compared to US$281.5 million in Q3/22. The firm said the gains were the result of a combination of positive organic growth and contributions from three separate company acquisitions.

Titan added that during Q3/23, construction segment revenues increased to US$86.4 million, up from US$79.7 million in Q3/22, driven by increased demand for equipment, and listed that it posted revenues of US$89.0 million in its international segment.

CEO Meyer commented further that “The momentum in our business continues to be visible across all aspects of Titan Machinery, as favorable industry conditions combine with several years of operational improvements and solid growth through accretive and strategic acquisitions . . . Looking ahead, we are very well positioned to serve the strong industries that we operate in with our robust balance sheet and powerful operational performance.”

The company offered some upward adjusted forward guidance and stated that for FY/23, it expects that agriculture revenue will be up 55-60% year-over-year, compared to its prior estimates of 50-55%. The firm stated that construction revenue is expected to decrease by 0-5% y-o-y, and international segment revenue is also projected to be down by 0-5% y-o-y. Titan Machinery added that for FY/23, it now expects it will have diluted earnings per share (EPS) of US$4.55-4.85. Prior estimates called for diluted EPS of US$3.70-4.00.

Titan Machinery owns and operates full-service agricultural and construction equipment dealer locations in North America and Europe. The company is based in West Fargo, N.D., and offers products and services to farmers, ranchers, and other commercial customers from its network of over 100 dealer locations in Europe and 13 U.S. midwestern and western states.

The firm’s international stores are located in Bulgaria, Germany, Romania, and Ukraine. Titan noted that each of its store locations represents one or more of CNH Industrial N.V.’s (CNHI:NYSE; CNHI:MI) equipment brands, including Case Construction, Case IH, CNH Capital, New Holland Agriculture, and New Holland Construction.

Titan Machinery started the day with a market cap of around US$787.17 million yesterday with approximately 22.57 million shares outstanding. TITN shares opened 15% higher yesterday at US$40.20 (+US$5.32, +15.25%) over the previous day’s US$34.88 closing price and reached a new 52-week high price yesterday afternoon of US$44.29. The stock traded yesterday between US$38.31 and US$44.29 per share and closed for trading at US$44.03 (+US$9.15, +26.23%).

Disclosures:

1) Stephen Hytha wrote this article for Streetwise Reports LLC and provides services to Streetwise Reports as an independent contractor. He or members of his household own securities of the following companies mentioned in the article: None. He or members of his household are paid by the following companies mentioned in this article: None.

2) The following companies mentioned in this article are billboard sponsors of Streetwise Reports: None. Click here for important disclosures about sponsor fees.

3) Comments and opinions expressed are those of the specific experts and not of Streetwise Reports or its officers. The information provided above is for informational purposes only and is not a recommendation to buy or sell any security.

4) The article does not constitute investment advice. Each reader is encouraged to consult with his or her individual financial professional and any action a reader takes as a result of information presented here is his or her own responsibility. By opening this page, each reader accepts and agrees to Streetwise Reports’ terms of use and full legal disclaimer. This article is not a solicitation for investment. Streetwise Reports does not render general or specific investment advice and the information on Streetwise Reports should not be considered a recommendation to buy or sell any security. Streetwise Reports does not endorse or recommend the business, products, services or securities of any company mentioned on Streetwise Reports.

5) From time to time, Streetwise Reports LLC and its directors, officers, employees or members of their families, as well as persons interviewed for articles and interviews on the site, may have a long or short position in securities mentioned. Directors, officers, employees or members of their immediate families are prohibited from making purchases and/or sales of those securities in the open market or otherwise from the time of the decision to publish an article until three business days after the publication of the article. The foregoing prohibition does not apply to articles that in substance only restate previously published company releases.

Ichimoku Cloud Analysis 01.12.2022 (EURUSD, XAUUSD, USDCAD)

By RoboForex.com

EURUSD, “Euro vs US Dollar”

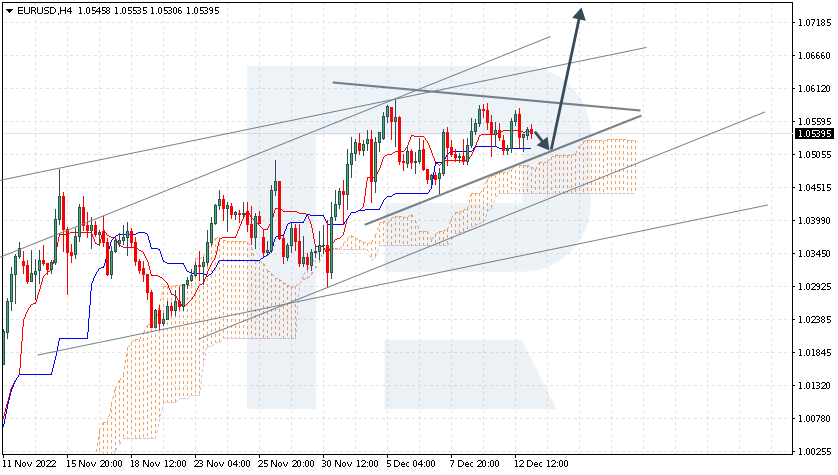
The currency pair is testing the upper border of the Triangle pattern. The instrument is going above the Ichimoku Cloud, which suggests an uptrend. A test of the upper border of the Cloud at 1.0360 is expected, followed by growth to 1.0765. An additional signal confirming the growth will be a bounce off the lower border of the bullish channel. The scenario can be cancelled by a breakaway of the lower border of the Cloud and securing under 1.0245, which will mean further falling to 1.0155. The growth can be supported by a breakaway of the upper border of the Triangle pattern and securing above 1.0555.

EURUSD
Risk Warning: the result of previous trading operations do not guarantee the same results in the future

XAUUSD, “Gold vs US Dollar”

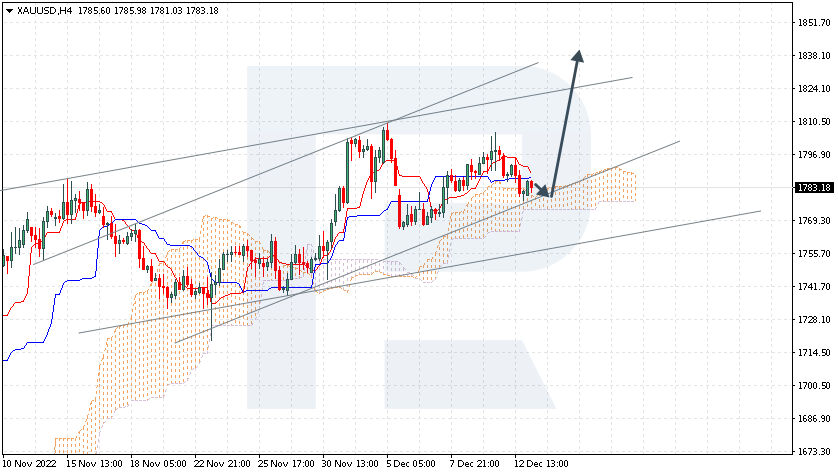
Gold is getting ready to break through the resistance level. The instrument is going above the Ichimoku Cloud, which suggests an uptrend. A test of the upper border of the Cloud at 1755 is expected, followed by growth to 1855. An additional signal confirming the growth will be a bounce off the upper border of the descening channel. The scenario can be cancelled by a breakaway of the lower border of the Cloud and securing under 1725, which will mean further falling to 1675.

XAUUSD
Risk Warning: the result of previous trading operations do not guarantee the same results in the future

USDCAD, “US Dollar vs Canadian Dollar”

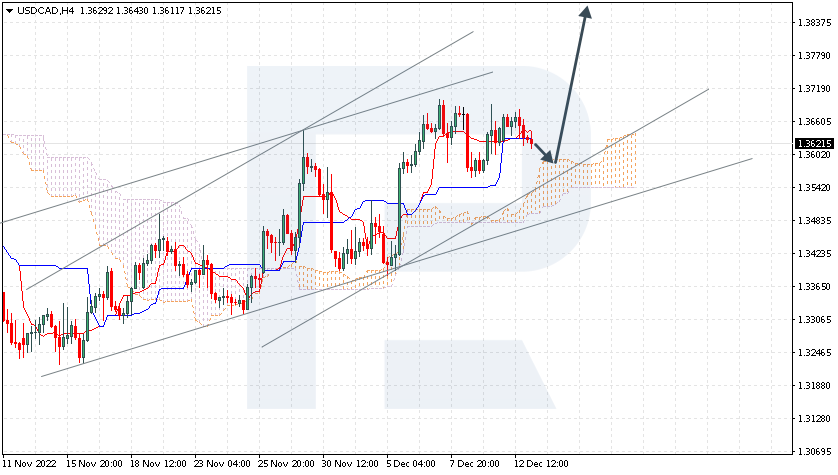
The currency pair is correcting in a bullish channel. The instrument is going above the Ichimoku Cloud, which suggests an uptrend. A test of the upper border of the Cloud at 1.3375 is expected, followed by growth to 1.3750. An additional signal confirming the growth will be a bounce off the lower border of the bullish channel. The scenario can be cancelled by a breakaway of the lower border of the Cloud and securing under 1.3315, which will mean further falling to 1.3220.

USDCAD

Article By RoboForex.com

Attention!
Forecasts presented in this section only reflect the author’s private opinion and should not be considered as guidance for trading. RoboForex LP bears no responsibility for trading results based on trading recommendations described in these analytical reviews.

EUR: what did Powell say? Overview for 01.12.2022

By RoboForex.com

The market major on Thursday is growing. The current quote is 1.0450.

Yesterday was full of statistics, but the key catalyst was different. Activity of investors heated up after the speech of the head of the US Fed Jerome Powell. He confirmed that the next increase in the interest rate might be more modest that the previous ones.

The idea is to raise the interest rate by 50 base points instead of 75 points, like it used to be raised for several meetings in a row. Simultaneously, Powell mentioned that the monetary policy on the whole would remain limiting at least for some time in the future – until there appear some confirmations that the inflation has subsided.

So, according to the CME observations, the market now considers a 50 base point increase of the rate to be 75% possible, so that at the meeting on 14 December the interest rate will reach 4.50% y/y. As for inflation, Powell acknowledged that it was too early to celebrate victory.

It seems that all that Powell has said lately are the main highlights for understanding the future steps of the regulator. Let us just stick to them.

For the USD, the slow-down in the growth of the interest rate became a negative signal.

Article By RoboForex.com

Attention!
Forecasts presented in this section only reflect the author’s private opinion and should not be considered as guidance for trading. RoboForex LP bears no responsibility for trading results based on trading recommendations described in these analytical reviews.

The Analytical Overview of the Main Currency Pairs on 2022.12.01

By JustMarkets

The EUR/USD currency pair

Technical indicators of the currency pair:
  • Prev Open: 1.0329
  • Prev Close: 1.0407
  • % chg. over the last day: +0.76 %

Eurozone’s inflation eased in November from 10.6 to 10% y/y due to falling energy prices. Core inflation remained stable at 5%. Nevertheless, economists warn that lower inflation is unlikely to prevent the European Central Bank from raising interest rates as food inflation continues to rise. Whether this is the peak of overall inflation remains to be seen. But the current economic situation could push the European Central Bank to hike less by 50 basis points next month.

Trading recommendations
  • Support levels: 1.0361, 1.0332, 1.0284, 1.0193, 1.0092, 1.0043, 0.9968
  • Resistance levels: 1.0444, 1.0504

The trend on the EUR/USD currency pair on the hourly time frame is bullish. The price is trading above the moving averages, and the MACD indicator is in the positive zone with no signs of reversal. Buy trades are best considered from the support level of 1.0361, but with additional confirmation. Sell deals can be considered from the resistance level of 1.0444, but it is better with confirmation in the form of reverse initiative.

Alternative scenario: if the price breaks down through the support level of 1.0284 and fixes below it, the downtrend will likely resume.

EUR/USD
News feed for 2022.12.01:
  • – German Retail Sales (m/m) at 09:00 (GMT+3);
  • – Spanish Manufacturing PMI (m/m) at 10:15 (GMT+3);
  • – Italian Manufacturing PMI (m/m) at 10:45 (GMT+3);
  • – French Manufacturing PMI (m/m) at 10:50 (GMT+3);
  • – German Manufacturing PMI (m/m) at 10:55 (GMT+3);
  • – Eurozone Manufacturing PMI (m/m) at 11:00 (GMT+3);
  • – Eurozone Unemployment Rate (m/m) at 12:00 (GMT+3);
  • – US PCE Price index (m/m) at 15:30 (GMT+3);
  • – US Initial Jobless Claims (w/w) at 15:30 (GMT+3);
  • – US FOMC Member Bowman Speaks at 16:30 (GMT+3);
  • – US ISM Manufacturing PMI (m/m) at 17:00 (GMT+3).

The GBP/USD currency pair

Technical indicators of the currency pair:
  • Prev Open: 1.1958
  • Prev Close: 1.2056
  • % chg. over the last day: +0.82 %

A Bank of England spokesman said yesterday that UK inflation will fall rapidly in the 2nd half of 2023. But it is not yet the reason how this will happen, as at the moment, the UK labor market remains weak, and household incomes are shrinking. The Bank of England intends to raise interest rates at the next meeting, which will put even more pressure on the economy.

Trading recommendations
  • Support levels: 1.2015, 1.1964, 1.1684, 1.1476, 1.1418, 1.1172, 1.1093
  • Resistance levels: 1.2113, 1.2147, 1.2167

From the technical point of view, the trend on the GBP/USD currency pair on the hourly time frame is bullish. The price is trading above the moving levels. The MACD indicator became positive, and the buyers’ pressure inside the day. Under such market conditions, it is better to look for buy trades from the support level of 1.2015, but with confirmation. Sell trades are best sought on intraday time frames from resistance levels of 1.2113, but also better with confirmation, as the level has already been tested.

Alternative scenario: if the price breaks down of the 1.1900 support level and fixes below it, the downtrend will likely resume.

GBP/USD
News feed for 2022.12.01:
  • – UK Manufacturing PMI (m/m) at 11:30 (GMT+3).

The USD/JPY currency pair

Technical indicators of the currency pair:
  • Prev Open: 138.63
  • Prev Close: 138.08
  • % chg. over the last day: -0.40%

Japan refrained from intervening in the foreign exchange market in November, the Treasury Department said Wednesday, as rumors grew that the US Federal Reserve would slow the pace of rate hikes as inflation peaked. Weaker-than-expected US inflation data this month somewhat diminished the prospect of aggressive rate hikes by the US Federal Reserve. At the same time, the Bank of Japan remains committed to ultra-low interest rates.

Trading recommendations
  • Support levels: 136.49, 135.20
  • Resistance levels: 137.65, 139.09, 140.75, 143.17, 145.16

From the technical point of view, the medium-term trend on the currency pair USD/JPY is bearish. The MACD indicator is in the negative zone, but on higher time frames, a divergence is formed, which indicates a certain weakness of the sellers. Under such market conditions, buy trades can be looked for on intraday time frames from the support level of 136.49, but only with confirmation. Selling could be sought from the resistance level of 137.65 or 139.09, provided there is a reverse reaction.

Alternative scenario: If the price fixes above 140.75, the uptrend will likely resume.

USD/JPY
News feed for 2022.12.01:
  • – Japan Manufacturing PMI (m/m) at 02:30 (GMT+3).

The USD/CAD currency pair

Technical indicators of the currency pair:
  • Prev Open: 1.3578
  • Prev Close: 1.3414
  • % chg. over the last day: -1.22 %

Dovish comments from Federal Reserve Chairman Jerome Powell and signs of declining inflation in the US raised hopes that the Central Bank would be less aggressive about raising interest rates. The dollar index began to lose ground on such statements, and as a result, USD/CAD went down. The Biden administration is keeping its promise to cut the use of oil reserves in the US, which contributes to the maximum reduction of crude oil reserves in the country in a week. This helped oil prices rise by 3%, which is good for the Canadian currency, as it’s a commodity currency.

Trading recommendations
  • Support levels: 1.3386, 1.3360, 1.3281, 1.3212
  • Resistance levels: 1.3479, 1.3522, 1.3658, 1.3682, 1.3776, 1.3855

From the point of view of technical analysis, the trend on the USD/CAD currency pair has changed to bullish. But the price is close to changing a priority. The MACD indicator is in the negative zone with no signs of reversal. Sellers’ pressure is still present. Buy trades should be considered on the lower time frames from the support level of 1.3386 or 1.3360, but with additional confirmation. For sell deals, it is better to consider the resistance level of 1.3479 but with confirmation in the form of reverse initiative.

Alternative scenario: if the price breaks down and consolidates below the support level of 1.3386, the downtrend will likely resume.

USD/CAD
News feed for 2022.12.01:
  • – Canada Manufacturing PMI (m/m) at 16:30 (GMT+3).

By JustMarkets


This article reflects a personal opinion and should not be interpreted as an investment advice, and/or offer, and/or a persistent request for carrying out financial transactions, and/or a guarantee, and/or a forecast of future events.