
By JustMarkets
The new week started with a more cautious mood in the markets. Stock indices closed lower on Monday as investors refused to buy stocks ahead of the Federal Reserve’s decision and further quarterly earnings. At Monday’s close, the Dow Jones Index (US30) decreased by 0.77%, and the S&P 500 Index (US500) lost 1.30%. The NASDAQ Technology Index (US100) fell by 1.96% yesterday.
According to analysts, the 25 basis point increase has already been accounted for by the market. The Federal Reserve is looking to slow its campaign against inflation but will signal further tightening. Officials note that unjustified easing will make it harder for them to restore price stability. Economists believe rising mortgage rates are cooling the housing market, and higher lending rates could make corporate investments more expensive. A stronger dollar hurts manufacturing by making exports more expensive and imports cheaper. And lower stock and bond prices can help curb consumer spending.
Stock markets in Europe mostly fell yesterday. Germany’s DAX (DE30) decreased by 0.16%, France’s CAC 40 (FR40) lost 0.21%, Spain’s IBEX 35 (ES35) fell by 0.12%, and the British FTSE 100 (UK100) closed up by 0.25% on Monday.
Unexpected data were published yesterday in Spain and Germany. Spain’s harmonized consumer price index rose from 5.7% to 5.8% year-over-year, with a forecast of 4.9%. A rebound in fuel prices drove the result. The core inflation rate rose to a record 7.5% year-over-year, reinforcing fears of tighter price pressures. In Germany, fears of a recession returned. Preliminary GDP data showed that the economy shrank by 0.2% quarterly after rising by 0.5% in the third quarter. Annual GDP growth for 2022 was also revised downward to 1.8% from 1.9% year-over-year.
The flurry of recent data showing that Europe’s economy is starting to grow again has even raised hopes that the Eurozone will avoid a sharp recession. But ECB President Christine Lagarde has repeatedly stressed that rates will continue to rise at a steady pace, and the ECB is expected to raise rates by 50 basis points on Thursday. Most analysts also expect a 50 basis point hike in March, but as inflation begins to decline and GDP in key eurozone economies shrink, there are already signs of a debate among policymakers that the pace should slow down. The focus will be on Lagarde’s comments after the rate decision is announced to hint at the future direction.
In Switzerland, the KOF economic barometer rose for the second month in a row. Nevertheless, the indicator remains below its medium-term value. But the outlook for the Swiss economy at the start of the year is much less bleak than it was last fall. The sectors that are recovering the fastest are manufacturing, hospitality, and services.
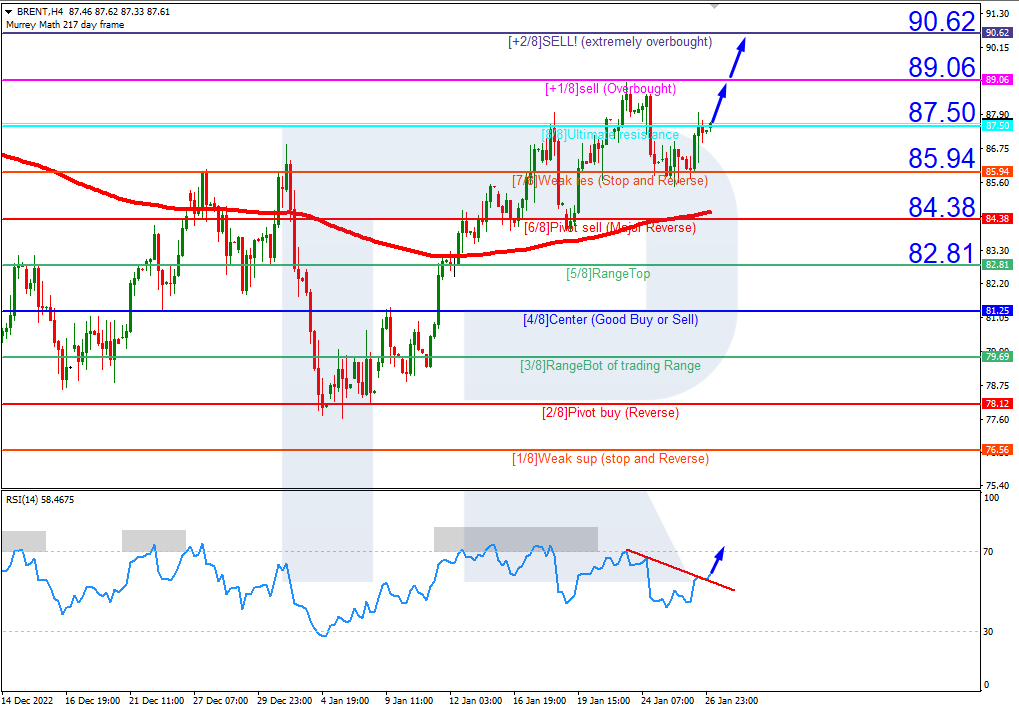
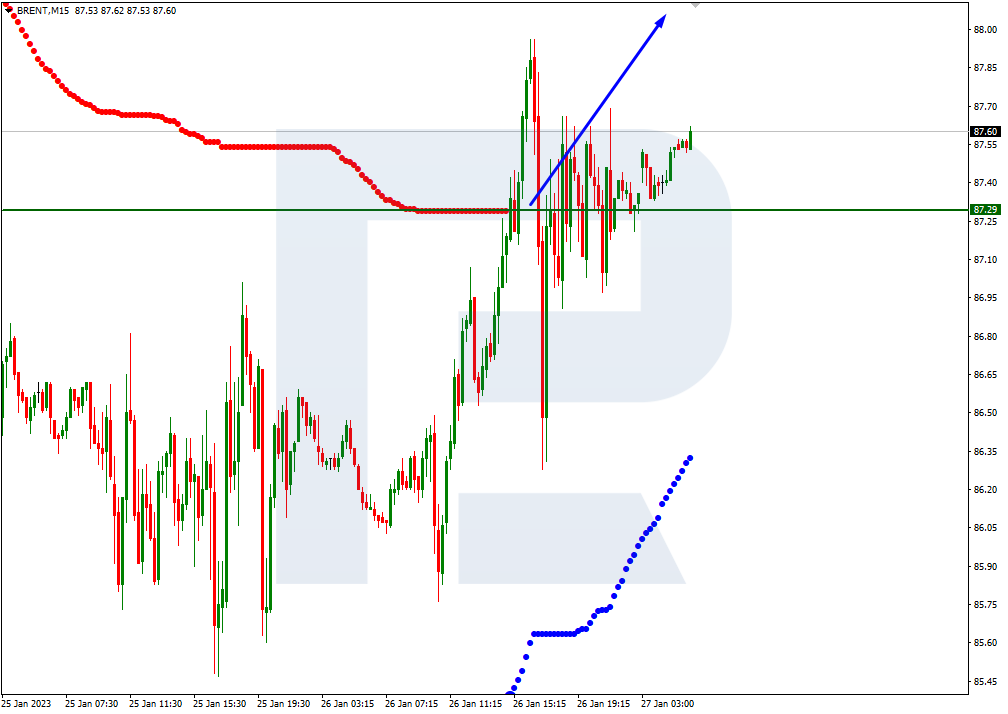
Oil fell by 2% yesterday. It became known that Moscow would not adhere to the Russian oil price cap set by the West. The administration of President Vladimir Putin is allowing Russian oil companies to sell as many barrels of oil as they want at whatever price they can get. There is a huge discrepancy between the Russian government’s policy and actual activity in the physical oil market. Russia is trying to negotiate with OPEC+ countries to maintain price stability and to maintain higher oil prices. Much will depend on whether OPEC+ leaves production levels at current levels.
Asian markets traded flat yesterday. Japan’s Nikkei 225 (JP225) gained 0.19%, China’s FTSE China A50 (CHA50) added 0.76% after the holiday, Hong Kong’s Hang Seng (HK50) fell by 2.73%, India’s NIFTY 50 (IND50) gained 0.25%, and Australia’s S&P/ASX 200 (AU200) ended the day 0.16% negative.
Kuroda’s ten-year tenure at the helm of Japan’s central bank comes to an end in April. Prime Minister. Kishida indicated last week that he would choose a new governor in February. Most Bank of Japan observers surveyed by Bloomberg see current deputy governor Masayoshi Amamiya or his predecessor Hiroshi Nakaso as the most likely successors. In the latest Bloomberg poll of Bank of Japan observers, Amamiya was the favorite to replace Kuroda, with 25 votes out of 37 responses.
China’s business activity index rose for the first time in four months as the economic recovery from Covid Zero continues and the Lunar New Year holiday boosted travel and spending. The pace of activity recovery remains in focus, and one positive sign is that more than 300 million trips were made during the Lunar New Year, nearly 90% of pre-pandemic levels.
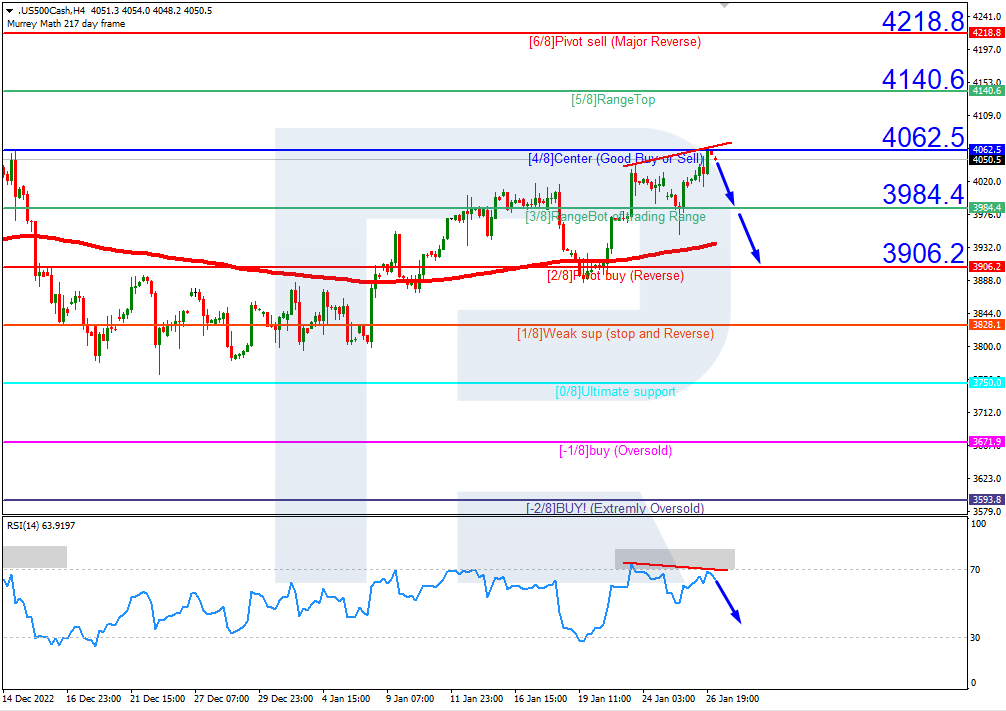
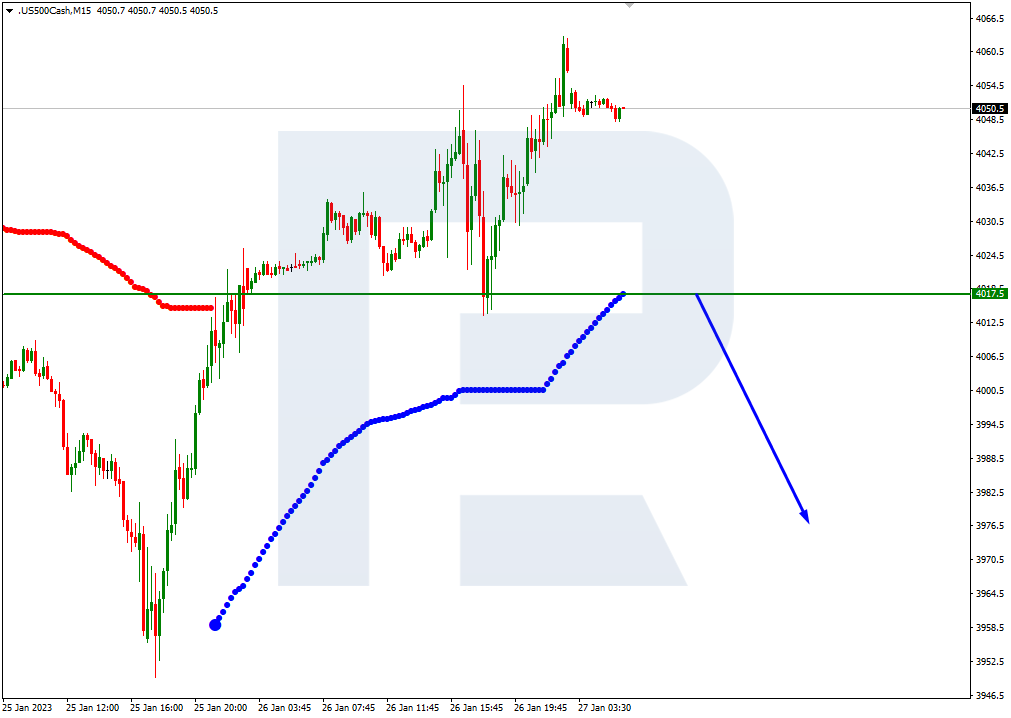
S&P 500 (F) (US500) 4,017.77 −52.79 (−1.30%)
Dow Jones (US30) 33,717.09 −260.99 (−0.77%)
DAX (DE40) 15,126.08 −23.95 (−0.16%)
FTSE 100 (UK100) 7,784.87 +19.72 (+0.25%)
USD Index 102.23 +0.30 (+0.30%)
- – Japan Unemployment Rate (m/m) at 01:30 (GMT+2);
- – Japan Retail Sales at 01:50 (GMT+2);
- – Japan Industrial Production (m/m) at 01:50 (GMT+2);
- – Australia Retail Sales (m/m) at 02:30 (GMT+2);
- – China Manufacturing PMI (m/m) at 03:30 (GMT+2);
- – China Non-Manufacturing PMI (m/m) at 03:30 (GMT+2);
- – French GDP (q/q) at 08:30 (GMT+2);
- – German Retail Sales (m/m) at 09:00 (GMT+2);
- – French Consumer Price Index (m/m) at 09:45 (GMT+2);
- – German Unemployment Rate (m/m) at 10:55 (GMT+2);
- – Eurozone GDP (q/q) at 12:00 (GMT+2);
- – German Consumer Price Index (m/m) at 15:00 (GMT+2);
- – Canada GDP (q/q) at 15:30 (GMT+2);
- – US Chicago PMI (m/m) at 16:45 (GMT+2);
- – US CB Consumer Confidence (m/m) at 17:00 (GMT+2);
- – New Zealand Unemployment Rate (q/q) at 23:45 (GMT+2).
By JustMarkets
This article reflects a personal opinion and should not be interpreted as an investment advice, and/or offer, and/or a persistent request for carrying out financial transactions, and/or a guarantee, and/or a forecast of future events.


