
Source: Michael Ballanger (3/27/23)
Michael Ballanger of GGM Advisory Inc. reviews the current state of the market, where he believes the Fed is heading, and one gold stock he says is a best performer.
It seems like it was only yesterday that the Great Financial Crisis involving an even Greater Financial Bailout was raining massive stock and bond market losses on the investing public, but it was not on anyone’s radar screen until a small, obscure hedge fund run by Bear Stearns traders blew up in spectacular fashion.
That was March 2008, and only after Jamie Dimon wrangled loan guarantees from the Fed and Treasury that JP Morgan bought Bear for the ungodly sum of US$2.00 per share a mere nine months after hitting an all-time high north of US$170.
That event was the first cockroach that anyone had seen in a kitchen that would eventually be teeming with them. With the U.S. real estate market rocketing northward in a greed-fueled orgy of house-flipping, multiple units leveraging, lying, cheating, and outright fraud, then-Fed-Chairman Ben Bernanke swore black and blue that the subprime issue that brought down Bear Stearns was “contained.”
I learned decades ago at the Wharton School that when the Fed is openly hostile to stocks with restrictive monetary policy, keep your money in your pocket.
The second little critter that slithered its way into sight was the Lehman Brothers implosion six months later in September 2008, when Treasury Secretary Hank Paulson, along with all of the member banks of the Federal Reserve, decided to make a martyr out of them, forcing Lehman into bankruptcy and nearly sending the entire financial system into liquidity purgatory.
With Lehman, it was as if someone flipped in the kitchen fluorescent at 3 a.m. because, as Mr. Buffett says, “they all started scurrying around” as it suddenly and shockingly became known that those cockroaches that had been feasting on the spoils of compromised rating agencies and an overly-easy monetary regime were none other than all of the major banks and brokers on Wall Street.
As history unfolded and revelations came to the surface about what really happened, every one of those cockroaches was doomed without a Fed/Treasury department lifeline — bailout — and that is exactly what they got. The problem remained that the issue of moral hazard was severely breached, and for the last fourteen years, the bugs are still feeding on the spilled flour and overturned rice bowls upon which they fed voraciously into the wee hours of the night, which abruptly ended in early 2022.
A couple of months ago, the big crypto bank servicer, FTX, was gutted by a combination of stupidity and greed but had the tight money policies of the U.S. Fed been allowed to prolong the speculative mania, the fraud might have been extended for quite awhile longer. Then two weeks ago, we read of the bank run, and subsequent failure of the eighteenth-largest bank in the U.S., Silicon Valley Bank, along with Signature bank, were taken over by the FDIC in order to protect depositors who were caught in the marked-to-market debacle inflicted upon these regional banks by a Fed that basically ensured investor that inflation (and rising interest rates) were “transitory.”
He Who Loses the Least Wins
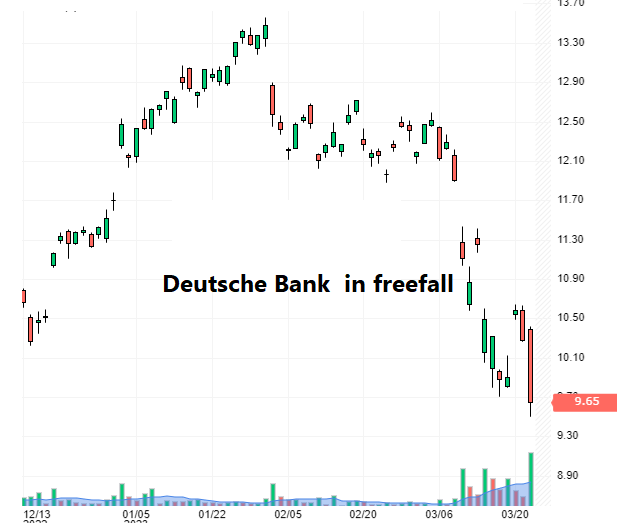
Right on the heels of that fiasco arrives the even-greater plight of Swiss investment banking giant Credit Suisse, and after the powers that be conspire to throw them under a bus with a forced US$3.25 billion buyout by UBS, they now have to deal with another extremely delicate situation with news that Germany’s Deutsche Bank is also now having liquidity issues.
The issues affecting the global banking fraternity are not going to disappear overnight because we have experienced over 14 years of a complete and total disregard for the policies needed to provide a sound money environment for workers and savers.
Protecting U.S. dollar hegemony and suppressing the ability of the free market to accurately identify the proper price for goods and services has taken precedence over natural price discovery which was one of the most important attributes of pre-Bretton Woods where spendthrift countries lost their gold and invited regime change through the proper function of the voting booth.
In 2023, those concepts have gone foreign because in a Constitutional republic like the U.S.A., money, not integrity, controls votes, and once in power, even the most honest of politicians are corrupted by the narcotic allure of political power.
Hence, the issuance of trillions upon trillions of bonds with negative coupons were flogged largely into Europe but irreverently into pension and insurance funds with the wink and nudge from the central bank charlatans that borrowing costs would remain “lower for longer,” thus implying little need for hedging the direction of interest rates.
Now that we have an unknown number of banks that are sitting with large portfolios of high-quality bonds bought at prices that reflect a zero rate versus a 4.5% rate, the evil sorcerer called “duration” has cast an ominous spell on those banks that thought the Fed would “have their backs” rather than twisting a very sharp stiletto into them.
As an investor, I am forced to assume that since the kitchen lights are low that the crunching, munching sound from the pantry is not just the one cockroach that I boot-stomped this morning but rather a legion of insectine brothers, sisters, nieces, and nephews all awaiting the harshness of light before scurrying into the cubbies, nooks, and crannies of the kitchen.
Bottom line: this is a very tough market to trade, but those that have simply kept their feet in the stirrups since mid-October has been the real winners.
Just as subprime was never “contained” to just a couple of wild-eyed hedge fund jockeys at Bear Steans in the Spring of 2008, the current problem with depositors leaving the impaired regional banks in favor of the chosen safety of the bigger, too-big-to-fail, member banks is a problem that will be around for a long time.
It is not “different” this time because the only thing keeping your money in any specific financial institution is trust.
It is said of a certain breed of woman in Eastern Europe that “When the money’s gone, the love is sure to follow.” I would forward the same principle for depositors of savings, and that is: “When the trust is gone, the cash is soon to follow.”
The cartoon shown above is a stark reminder of what happens when “the smartest guys in the room” run out of highly profitable (and highly confusing) products to pitch to their clients with one eye on the risk and the other on their bonus poll and many times with both eyes locked in mortal combat. When markets move higher but without leadership and where tail risk (the chance of a negative market event) is high, the stock market wizards have been known to drop back ten yards and punt, meaning, of course, that they opt for the safety of simplicity.
Listening to CNBC this afternoon, there are more bond bulls these days than I can ever remember, and when asked why the emphasis on bonds, it is always because they want to wait “until things clear up” before committing to equities. The reality is that these were the same geniuses that were piling into the SPACs and FAANGS and “story stocks” back in mid-2021, just before the Fed decided to remove the punch bowl. I learned decades ago at the Wharton School that when the Fed is openly hostile to stocks with restrictive monetary policy, keep your money in your pocket.
In bear markets, as the late Richard Russell would hammer home, “he who loses least wins.”
Gold and Silver
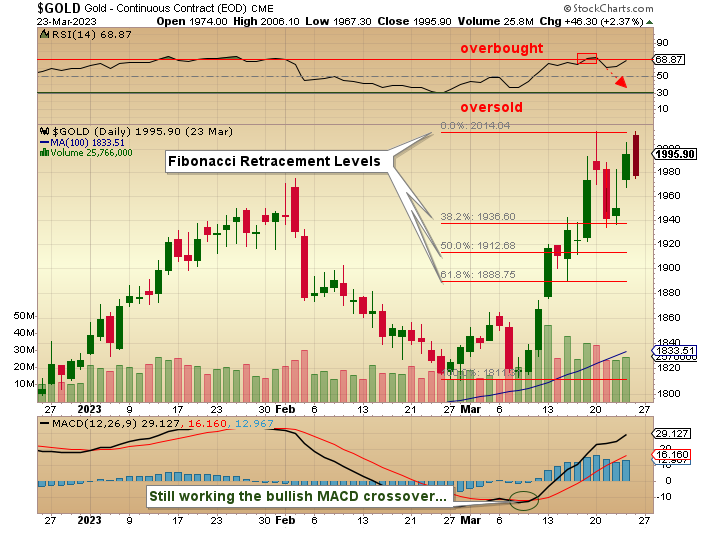
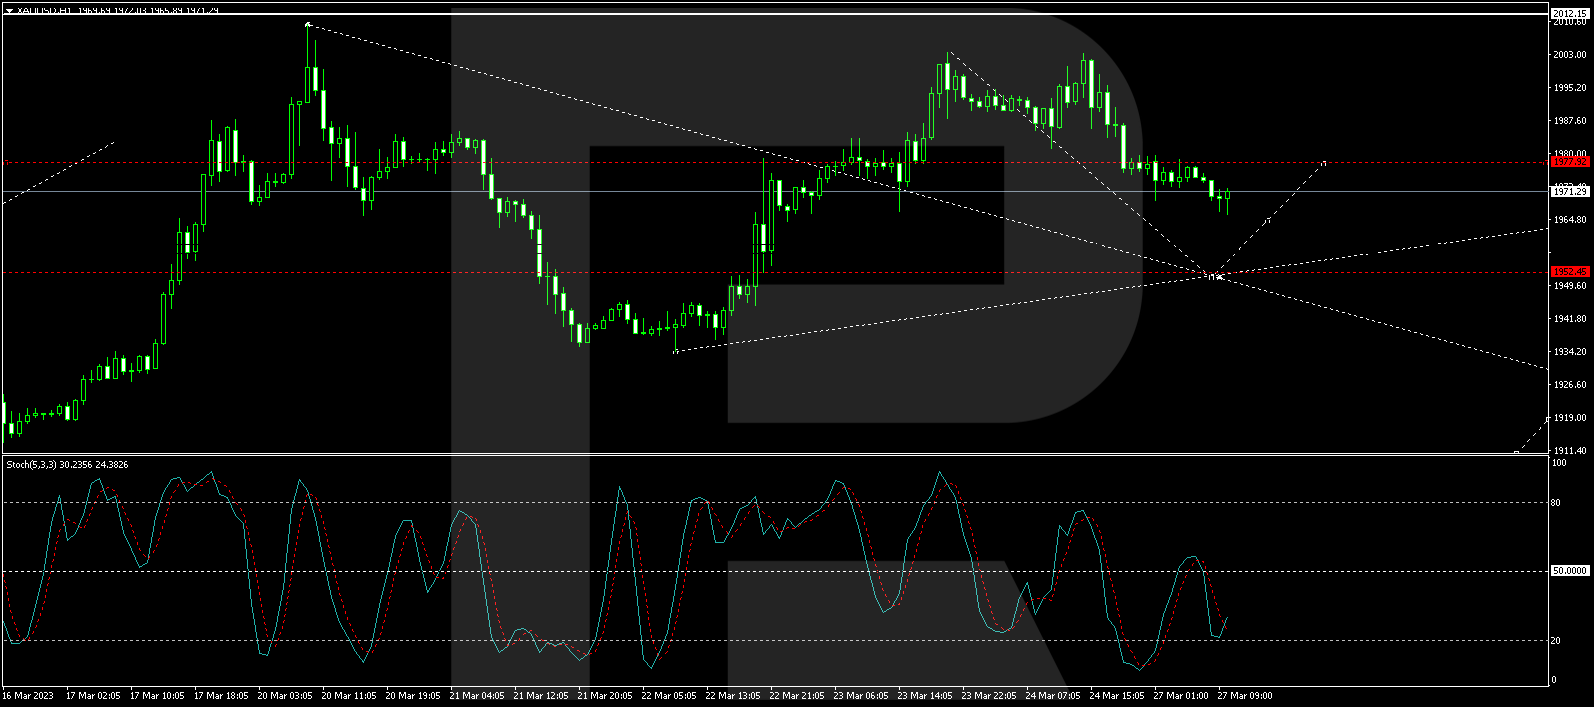
The gold market opened above US$2,000 on Friday morning, with the SPDR Gold Shares ETF (GLD:NYSE) within US$0.26 of a 52-week high and the highest trade since the Russian invasion of Ukraine in early March 2022. I took one look at the way markets opened at 8:30 a.m. with a gap that was immediately filled in by the Crimex pit traders but then rallied hard until the GLD:NYSE opened at 9:30 am, at which point the same selling sent prices straight south.
The market went out with a US$16 loss versus a US$11 gain. Silver eked out a modest US$0.02 gain which was great, but with the equity markets under pressure early due to the Deutsche Bank action, it came as no surprise that the German Chancellor made a calming statement concerning DB after which the boys went to work such that the big “fear bid” in gold and the gap down in stocks were completely reversed by the end of trading.
Allied Copper Corp. (CPR:TSX.V; CPRRF:OTCQB)
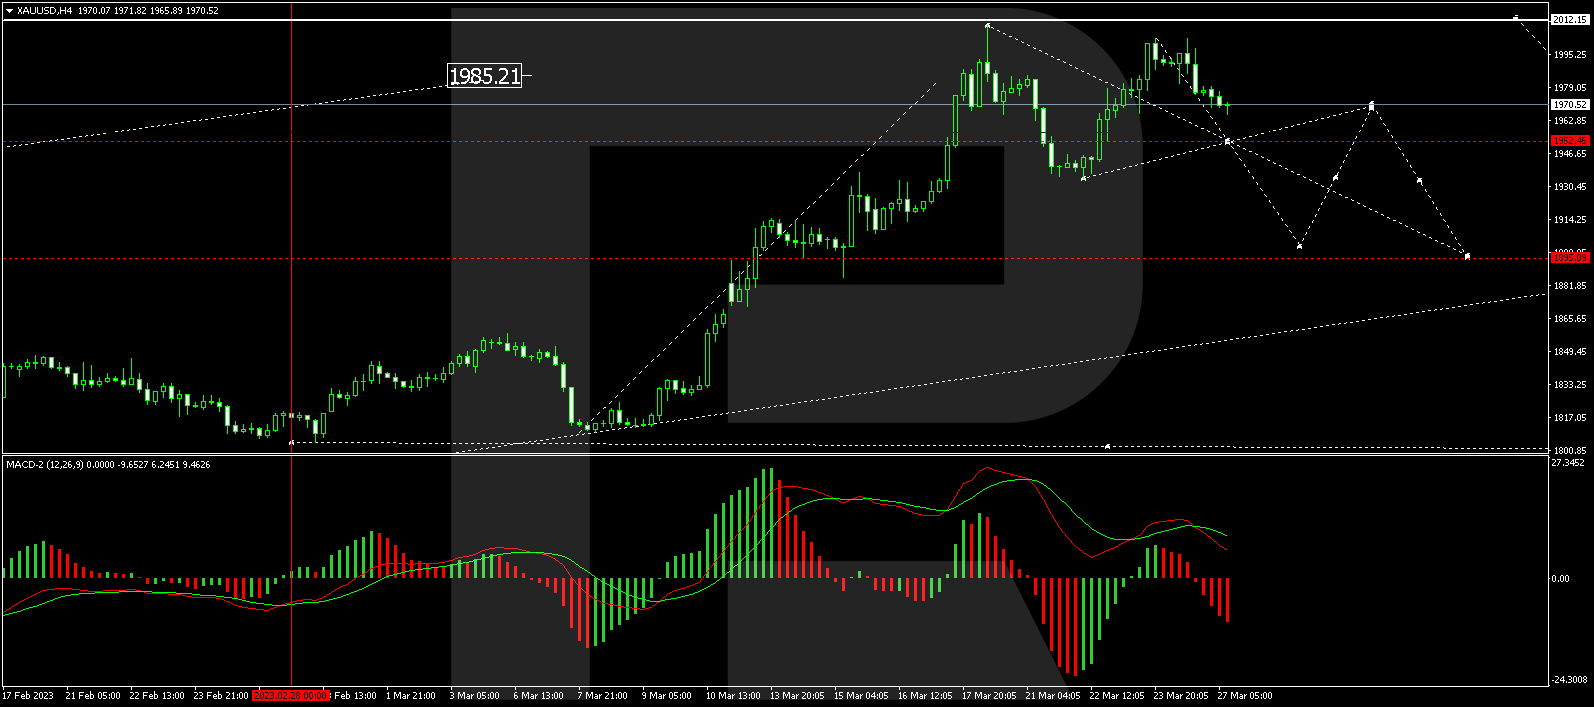
Nevertheless, I am looking to take a leveraged position in gold through either options or futures next week, but for now, remaining on the sidelines has kept us from getting whipsawed. Traders must discipline themselves to take positions in silver only during deep drawdown sessions because drawdowns are getting bought and spikes are being faded in daily action best described as “choppy.”
Bottom line: this is a very tough market to trade, but those that have simply kept their feet in the stirrups since mid-October has been the real winners.
Good news should be hitting the screens shortly for Allied Copper Corp. (CPR:TSX.V; CPRRF:OTCQB) where a press release on Wednesday confirmed April 20th as the date for the name change to Volt Lithium Corp.
They also reported that a position belonging to former Volt shareholders totaling 33,984,000 shares had been filed under a voluntary lock-up agreement.
The stock closed up 10% for the day at CA$0.275 and in an environment where many of the Li names have been under pressure.
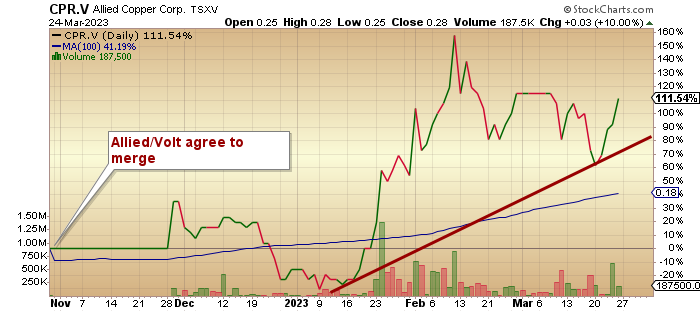
The shares are ahead 111.54% since October 31st, when they first announced intentions to merge, and show up 145% YTD making CPR:TSXV one the best performers on the board. If everything works out as advertised, the upside potential for this company is truly striking.
The group of juniors that I own is still stuck in neutral, and despite the fact that everyone is complaining about the same lack of excitement, it does not make it any easier. I happen to believe that rising metal prices combined with declining energy costs are the perfect elixir for a bull market in the developers which will reward the opportunistic investor.
Disclosures:
1) Michael J. Ballanger: I, or members of my immediate household or family, own securities of the following companies mentioned in this article: Allied Copper Corp. I personally am, or members of my immediate household or family are, paid by the following companies mentioned in this article: None.
2) The following companies mentioned in this article are billboard sponsors of Streetwise Reports: None. Click here for important disclosures about sponsor fees. As of the date of this article, an affiliate of Streetwise Reports has a consulting relationship with: None. Please click here for more information.
3) Statements and opinions expressed are the opinions of the author and not of Streetwise Reports or its officers. The author is wholly responsible for the validity of the statements. The author was not paid by Streetwise Reports for this article. Streetwise Reports was not paid by the author to publish or syndicate this article. Streetwise Reports requires contributing authors to disclose any shareholdings in, or economic relationships with, companies that they write about. Streetwise Reports relies upon the authors to accurately provide this information and Streetwise Reports has no means of verifying its accuracy.
4) This article does not constitute investment advice. Each reader is encouraged to consult with his or her individual financial professional and any action a reader takes as a result of information presented here is his or her own responsibility. By opening this page, each reader accepts and agrees to Streetwise Reports’ terms of use and full legal disclaimer. This article is not a solicitation for investment. Streetwise Reports does not render general or specific investment advice and the information on Streetwise Reports should not be considered a recommendation to buy or sell any security. Streetwise Reports does not endorse or recommend the business, products, services or securities of any company mentioned on Streetwise Reports.
5) From time to time, Streetwise Reports LLC and its directors, officers, employees or members of their families, as well as persons interviewed for articles and interviews on the site, may have a long or short position in securities mentioned. Directors, officers, employees or members of their immediate families are prohibited from making purchases and/or sales of those securities in the open market or otherwise from the time of the decision to publish an article until three business days after the publication of the article. The foregoing prohibition does not apply to articles that in substance only restate previously published company releases. As of the date of this article, officers and/or employees of Streetwise Reports LLC (including members of their household) own securities of Allied Copper Corp., a company mentioned in this article.


