Archive for Energy – Page 5

COT Energy Charts: Speculator Bets led by Heating Oil & Brent Oil

By InvestMacro

Speculators OI Energy Futures COT Chart
Here are the latest charts and statistics for the Commitment of Traders (COT) data published by the Commodities Futures Trading Commission (CFTC).

The latest COT data is updated through Tuesday September 2nd and shows a quick view of how large traders (for-profit speculators and commercial entities) were positioned in the futures markets.

Weekly Speculator Changes led by Heating Oil & Brent Oil

Speculators Nets Energy Futures COT Chart
The COT energy market speculator bets were overall higher this week as four out of the six energy markets we cover had higher positioning while the other two markets had lower speculator contracts.

Leading the gains for the energy markets was Heating Oil (6,479 contracts) with Brent Oil (6,278 contracts), Gasoline (1,964 contracts) and Natural Gas (1,170 contracts) also having positive weeks.

The markets with declines in speculator bets for the week were WTI Crude (-7,044 contracts) and the Bloomberg Index (-288 contracts) which saw lower bets on the week.

Natural Gas led Energy Price Performance

Energy market performance this week was led by Natural Gas, which saw a 2.94% gain on the week. Despite that, Natural Gas is down by -6.64% over the last 30 days and is lower by -22.14% over the last 90 days.

The Bloomberg Commodity Index was the next highest mover with a 0.64% gain on the week. Heating Oil also saw a tiny gain this week with a 0.04% increase. Heating Oil has been up by 13.75% over the last 90 days.

On the downside, Gasoline fell by -0.58% this week. Gasoline has been higher by 3.44% over the last 30 days and up by 7.92% over the last 90 days. Brent Oil fell by -2.92% over the last five days. Brent Oil has been higher by almost 8% over the last 90 days.

And finally, WTI Crude Oil was down by -3.47% this week, but has been up by 7.19% over the last 90 days.


Energy Data:

Speculators Table Energy Futures COT Chart
Legend: Weekly Speculators Change | Speculators Current Net Position | Speculators Strength Score compared to last 3-Years (0-100 range)


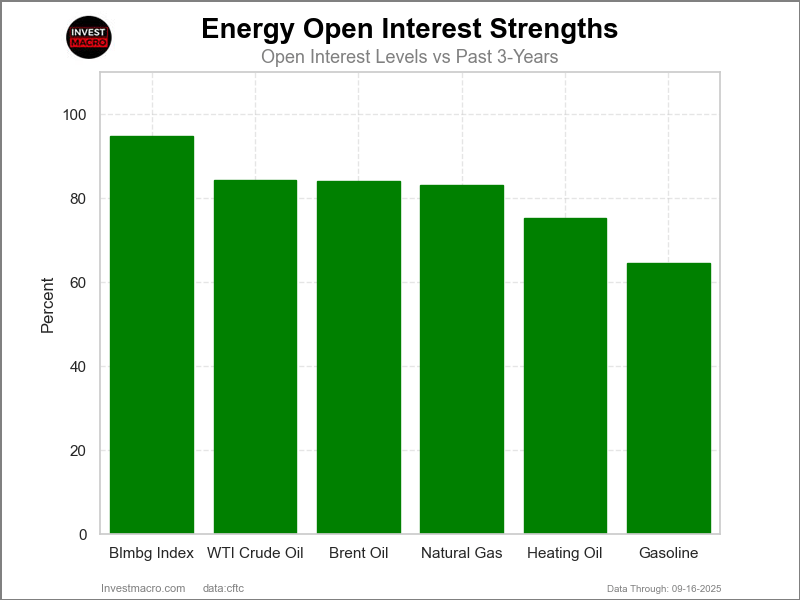
Strength Scores led by Heating Oil & Natural Gas

Speculators Strength Energy Futures COT Chart
COT Strength Scores (a normalized measure of Speculator positions over a 3-Year range, from 0 to 100 where above 80 is Extreme-Bullish and below 20 is Extreme-Bearish) showed that Heating Oil (83 percent) and Natural Gas (60 percent) lead the energy markets this week.

On the downside, WTI Crude (0 percent) comes in at the lowest strength level currently and is in Extreme-Bearish territory (below 20 percent).

Strength Statistics:
WTI Crude Oil (0.0 percent) vs WTI Crude Oil previous week (2.8 percent)
Brent Crude Oil (40.3 percent) vs Brent Crude Oil previous week (31.4 percent)
Natural Gas (60.0 percent) vs Natural Gas previous week (59.1 percent)
Gasoline (41.2 percent) vs Gasoline previous week (38.5 percent)
Heating Oil (83.3 percent) vs Heating Oil previous week (74.8 percent)
Bloomberg Commodity Index (47.0 percent) vs Bloomberg Commodity Index previous week (48.3 percent)


Heating Oil & Gasoline top the 6-Week Strength Trends

Speculators Trend Energy Futures COT Chart
COT Strength Score Trends (or move index, calculates the 6-week changes in strength scores) showed that Heating Oil (12 percent) and Gasoline (9 percent) lead the past six weeks trends for the energy markets.

WTI Crude Oil (-21 percent), Natural Gas (-19 percent) and Brent Oil (-17 percent) leads the downside trend scores currently.

Move Statistics:
WTI Crude Oil (-20.6 percent) vs WTI Crude Oil previous week (-21.4 percent)
Brent Crude Oil (-16.8 percent) vs Brent Crude Oil previous week (-38.6 percent)
Natural Gas (-19.3 percent) vs Natural Gas previous week (-23.0 percent)
Gasoline (9.2 percent) vs Gasoline previous week (-6.9 percent)
Heating Oil (11.6 percent) vs Heating Oil previous week (3.1 percent)
Bloomberg Commodity Index (-8.2 percent) vs Bloomberg Commodity Index previous week (-6.4 percent)


Individual COT Market Charts:

WTI Crude Oil Futures:

WTI Crude Oil Futures COT Chart

WTI Crude vs Oil ETF

The WTI Crude Oil Futures large speculator standing this week was a net position of 102,428 contracts in the data reported through Tuesday. This was a weekly decrease of -7,044 contracts from the previous week which had a total of 109,472 net contracts.

This week’s current strength score (the trader positioning range over the past three years, measured from 0 to 100) shows the speculators are currently Bearish-Extreme with a score of 0.0 percent. The commercials are Bullish-Extreme with a score of 100.0 percent and the small traders (not shown in chart) are Bearish with a score of 40.2 percent.

Price Trend-Following Model: Weak Uptrend

Our weekly trend-following model classifies the current market price position as: Weak Uptrend.

WTI Crude Oil Futures StatisticsSPECULATORSCOMMERCIALSSMALL TRADERS
– Percent of Open Interest Longs:14.741.23.4
– Percent of Open Interest Shorts:9.647.32.5
– Net Position:102,428-121,39518,967
– Gross Longs:293,055819,10267,712
– Gross Shorts:190,627940,49748,745
– Long to Short Ratio:1.5 to 10.9 to 11.4 to 1
NET POSITION TREND:
– Strength Index Score (3 Year Range Pct):0.0100.040.2
– Strength Index Reading (3 Year Range):Bearish-ExtremeBullish-ExtremeBearish
NET POSITION MOVEMENT INDEX:
– 6-Week Change in Strength Index:-20.623.2-19.8


Brent Crude Oil Futures:

Brent Last Day Crude Oil Futures COT Chart

Brent vs Oil ETF

The Brent Crude Oil Futures large speculator standing this week was a net position of -28,642 contracts in the data reported through Tuesday. This was a weekly boost of 6,278 contracts from the previous week which had a total of -34,920 net contracts.

This week’s current strength score (the trader positioning range over the past three years, measured from 0 to 100) shows the speculators are currently Bearish with a score of 40.3 percent. The commercials are Bullish with a score of 62.5 percent and the small traders (not shown in chart) are Bearish with a score of 39.2 percent.

Price Trend-Following Model: Uptrend

Our weekly trend-following model classifies the current market price position as: Uptrend.

Brent Crude Oil Futures StatisticsSPECULATORSCOMMERCIALSSMALL TRADERS
– Percent of Open Interest Longs:19.045.63.4
– Percent of Open Interest Shorts:33.131.63.2
– Net Position:-28,64228,295347
– Gross Longs:38,50692,3956,853
– Gross Shorts:67,14864,1006,506
– Long to Short Ratio:0.6 to 11.4 to 11.1 to 1
NET POSITION TREND:
– Strength Index Score (3 Year Range Pct):40.362.539.2
– Strength Index Reading (3 Year Range):BearishBullishBearish
NET POSITION MOVEMENT INDEX:
– 6-Week Change in Strength Index:-16.818.6-4.4


Natural Gas Futures:

Natural Gas Futures COT Chart

Natural Gas vs ETF

The Natural Gas Futures large speculator standing this week was a net position of -102,776 contracts in the data reported through Tuesday. This was a weekly rise of 1,170 contracts from the previous week which had a total of -103,946 net contracts.

This week’s current strength score (the trader positioning range over the past three years, measured from 0 to 100) shows the speculators are currently Bullish with a score of 60.0 percent. The commercials are Bearish with a score of 43.1 percent and the small traders (not shown in chart) are Bearish with a score of 37.0 percent.

Price Trend-Following Model: Downtrend

Our weekly trend-following model classifies the current market price position as: Downtrend.

Natural Gas Futures StatisticsSPECULATORSCOMMERCIALSSMALL TRADERS
– Percent of Open Interest Longs:17.430.93.4
– Percent of Open Interest Shorts:23.725.42.5
– Net Position:-102,77689,21213,564
– Gross Longs:284,272504,79255,175
– Gross Shorts:387,048415,58041,611
– Long to Short Ratio:0.7 to 11.2 to 11.3 to 1
NET POSITION TREND:
– Strength Index Score (3 Year Range Pct):60.043.137.0
– Strength Index Reading (3 Year Range):BullishBearishBearish
NET POSITION MOVEMENT INDEX:
– 6-Week Change in Strength Index:-19.323.5-13.1


Gasoline Blendstock Futures:

RBOB Gasoline Energy Futures COT Chart

Gasoline vs ETF

The Gasoline Blendstock Futures large speculator standing this week was a net position of 41,306 contracts in the data reported through Tuesday. This was a weekly lift of 1,964 contracts from the previous week which had a total of 39,342 net contracts.

This week’s current strength score (the trader positioning range over the past three years, measured from 0 to 100) shows the speculators are currently Bearish with a score of 41.2 percent. The commercials are Bullish with a score of 56.3 percent and the small traders (not shown in chart) are Bullish with a score of 66.0 percent.

Price Trend-Following Model: Uptrend

Our weekly trend-following model classifies the current market price position as: Uptrend.

Nasdaq Mini Futures StatisticsSPECULATORSCOMMERCIALSSMALL TRADERS
– Percent of Open Interest Longs:26.149.17.5
– Percent of Open Interest Shorts:13.264.45.1
– Net Position:41,306-48,9807,674
– Gross Longs:83,524157,00324,129
– Gross Shorts:42,218205,98316,455
– Long to Short Ratio:2.0 to 10.8 to 11.5 to 1
NET POSITION TREND:
– Strength Index Score (3 Year Range Pct):41.256.366.0
– Strength Index Reading (3 Year Range):BearishBullishBullish
NET POSITION MOVEMENT INDEX:
– 6-Week Change in Strength Index:9.2-10.713.9


#2 Heating Oil NY-Harbor Futures:

NY Harbor Heating Oil Energy Futures COT Chart

Heating Oil vs ETF

The #2 Heating Oil NY-Harbor Futures large speculator standing this week was a net position of 30,246 contracts in the data reported through Tuesday. This was a weekly boost of 6,479 contracts from the previous week which had a total of 23,767 net contracts.

This week’s current strength score (the trader positioning range over the past three years, measured from 0 to 100) shows the speculators are currently Bullish-Extreme with a score of 83.3 percent. The commercials are Bearish-Extreme with a score of 15.6 percent and the small traders (not shown in chart) are Bullish-Extreme with a score of 84.7 percent.

Price Trend-Following Model: Uptrend

Our weekly trend-following model classifies the current market price position as: Uptrend.

Heating Oil Futures StatisticsSPECULATORSCOMMERCIALSSMALL TRADERS
– Percent of Open Interest Longs:17.740.914.0
– Percent of Open Interest Shorts:9.455.57.6
– Net Position:30,246-53,51023,264
– Gross Longs:64,603149,07651,122
– Gross Shorts:34,357202,58627,858
– Long to Short Ratio:1.9 to 10.7 to 11.8 to 1
NET POSITION TREND:
– Strength Index Score (3 Year Range Pct):83.315.684.7
– Strength Index Reading (3 Year Range):Bullish-ExtremeBearish-ExtremeBullish-Extreme
NET POSITION MOVEMENT INDEX:
– 6-Week Change in Strength Index:11.6-5.6-8.3


Bloomberg Commodity Index Futures:

Bloomberg Commodity Index Futures COT Chart

Bloomberg Commodity Index vs ETF

The Bloomberg Commodity Index Futures large speculator standing this week was a net position of -13,257 contracts in the data reported through Tuesday. This was a weekly decline of -288 contracts from the previous week which had a total of -12,969 net contracts.

This week’s current strength score (the trader positioning range over the past three years, measured from 0 to 100) shows the speculators are currently Bearish with a score of 47.0 percent. The commercials are Bullish with a score of 52.7 percent and the small traders (not shown in chart) are Bullish with a score of 64.0 percent.

Price Trend-Following Model: Uptrend

Our weekly trend-following model classifies the current market price position as: Uptrend.

Bloomberg Index Futures StatisticsSPECULATORSCOMMERCIALSSMALL TRADERS
– Percent of Open Interest Longs:13.681.70.2
– Percent of Open Interest Shorts:20.375.10.1
– Net Position:-13,25712,966291
– Gross Longs:26,750160,982406
– Gross Shorts:40,007148,016115
– Long to Short Ratio:0.7 to 11.1 to 13.5 to 1
NET POSITION TREND:
– Strength Index Score (3 Year Range Pct):47.052.764.0
– Strength Index Reading (3 Year Range):BearishBullishBullish
NET POSITION MOVEMENT INDEX:
– 6-Week Change in Strength Index:-8.28.10.5


Article By InvestMacroReceive our weekly COT Newsletter

*COT Report: The COT data, released weekly to the public each Friday, is updated through the most recent Tuesday (data is 3 days old) and shows a quick view of how large speculators or non-commercials (for-profit traders) were positioned in the futures markets.

The CFTC categorizes trader positions according to commercial hedgers (traders who use futures contracts for hedging as part of the business), non-commercials (large traders who speculate to realize trading profits) and nonreportable traders (usually small traders/speculators) as well as their open interest (contracts open in the market at time of reporting). See CFTC criteria here.

The Nuclear Revolution Awaits

Source: Stephen McBride (8/6/25) 

Stephen McBride of The Rational Optimist shares his thoughts on how nuclear energy can be reshaped.

A tiny uranium pellet the size of a gummy bear holds energy matching 140 oil barrels. It’s humanity’s most environmentally friendly, secure power resource.

Every legitimate expert acknowledges this fact.

So what’s preventing universal nuclear implementation?

In brief: We smothered brilliance with bureaucracy. Since the 70s, constructing new facilities has practically been prohibited in America. It demanded $30 billion plus 15+ years battling regulatory obstacles.

I’ve got exciting updates. During my recent visits to Austin and Detroit, I connected with top-tier nuclear innovators. I’ve known these innovators for some time and consider many friends. They unanimously shared something unprecedented:

“Regulation is finally becoming a solved problem.”

One entrepreneur mentioned his microreactor (a small nuclear reactor or “SMR”) could become operational within a year.

This represents massive progress! We’re developing an extensive analysis about SMRs and approximately twelve startups racing to launch one. More information coming soon.

Today, let’s examine remaining nuclear “challenges.” What about waste management? And fuel acquisition? We’ll explore entrepreneurs tackling both issues.

First, a quick overview of major regulatory shifts.

In 1974, a bureaucratic entity called the Nuclear Regulatory Commission (NRC) emerged. Guess how many innovative reactor designs it’s approved since inception?

None!

Just two reactors have begun commercial operations during the NRC’s existence, compared to 133 beforehand.

We’re finally addressing this imbalance. The President has authorized four executive directives to accelerate nuclear development. These orders initiate five significant changes:

Change 1: They establish a target of expanding America’s nuclear capacity fourfold by 2050.

Change 2: They accelerate “advanced nuclear” development (specifically small modular reactors or “SMRs”) through test programs and expedited environmental assessments. They mandate the NRC to authorize new reactors within 18 months.

Change 3: They instruct the Department of Energy (DoE) to sanction at least three reactors before mid-2026. Essentially, Trump wants three SMRs functioning for America’s 250th anniversary.

Change 4: They classify nuclear facilities powering AI operations as “defense-critical infrastructure.” Constructing nuclear-powered computing centers on military installations creates a brilliant workaround. It potentially enables projects to bypass lengthy NRC evaluations.

Change 5: Most crucially in my assessment: They request the NRC to reconsider its “As Low as Reasonably Achievable” (ALARA) regulation. You experience more radiation consuming a single banana than living beside a nuclear plant for twelve months. Yet under ALARA guidelines, even that isn’t considered sufficiently safe!

This “zero banana rule” has effectively prohibited nuclear construction in America. I believe the President should have commanded the NRC to eliminate this rule completely. Nevertheless, this represents advancement.

Nuclear entrepreneurs have anticipated this opportunity throughout their careers.

As Matt Loszak, founder of Aalo Atomics said, “We just have to wait for the executive orders to be implemented and we’re off to the races.”

In Detroit, Valar Atomics founder Isaiah Taylor said. . .

“The problem is no longer in the policy side. It’s now in the engineering side.”

One engineering challenge involves fuel acquisition.

Stephen with Valar Atomics founder Isaiah Taylor

Fuel access concerned many entrepreneurs I encountered. Even if prepared to activate their microreactors immediately, many would face obstacles. They lack necessary fuel.

How did this happen? Because America regulated its domestic nuclear fuel sector into extinction, surrendering supply chain control to Russia and China. This scenario mirrors what occurred with drone technology.

Converting uranium from extraction to reactor-ready involves four fundamental stages:

  • Mining. Organizations like Cameco Corp. (CCO:TSX; CCJ:NYSE) (Canada) mine uranium in locations including Canada, Kazakhstan, Australia, Namibia, Niger, and Russia. These six nations produce over 85% of global uranium. Raw materials undergo processing into a substance called yellowcake.
  • Conversion. Yellowcake undergoes milling and conversion into uranium hexafluoride (UF6) enabling gasification for enrichment. Orano (France) and Rosatom (Russia) dominate over 50% of this market.
  • Enrichment. Nuclear “gas” undergoes enrichment through centrifugal spinning. Three corporations, Urenco (European consortium), Orano, and Rosatom control the enrichment market.
  • Fuel creation. Companies including Westinghouse (U.S.) and Framatome (France) compress and heat enriched uranium powder into solid ceramic pieces.

America possesses abundant underground uranium reserves. However, excessive regulation has minimized processing capabilities.

By 2023, 99% of fuel utilized in U.S. reactors was imported  with substantial quantities from Russia.

Meet innovators addressing this crisis . . .

Scott Nolan, partner at Peter Thiel’s investment firm Founders Fund, was among earliest backers of Radiant Nuclear, a venture developing portable microreactors. But Radiant encountered a major obstacle: fuel scarcity.

Specifically, limited access to high-assay low-enriched uranium (HALEU), premium uranium ideal for powering most microreactors.

Only Russia and China manufacture HALEU at scale. However, the U.S. plans to prohibit Russian uranium imports starting 2028. Leaving China — an unpredictable trade partner.

Accessing HALEU in America resembles Soviet-era bread queues. The DoE maintains limited reserves. Entrepreneurs must complete paperwork, endure months-long waits, and hope for allocations – merely to test prototypes. “Please sir, can I have some more?”

Scott Nolan established General Matter to produce HALEU fuel and revitalize America’s enrichment industry.

Meeting Scott at Detroit’s Reindustrialize summit, he shared “I spent over a year at Founders Fund searching for an American enrichment company to invest in, only to find there wasn’t one. So, we built our own.”

General Matter assembled elite professionals from organizations including SpaceX, Tesla, Anduril, and several American national nuclear laboratories. It was among four companies selected by the DoE to initiate American HALEU production.

If General Matter succeeds, it will achieve for uranium enrichment what SpaceX accomplished for rocketry: restore American competitiveness.

J.D. Rockefeller amassed historic wealth through Standard Oil.

Not through oil drilling. But by controlling the supply chain’s most valuable component: crude refinement.

Standard Nuclear aims to replicate this for nuclear energy. Its mission: become a scalable, affordable, entirely American nuclear fuel provider — the nuclear industry’s Standard Oil.

HALEU, optimal fuel for next-generation reactors, often comes encased in ceramic protection called TRISO, maintaining fuel density and safety.

TRISO appears as indestructible billiard ball-sized spheres. Each contains sufficient energy to power thousands of households.

Source: Kairos Power

TRISO resists melting. It prevents leakage. It contains radioactivity internally, even during extreme accidents. That’s why the DoE designates it Earth’s most robust nuclear fuel. Even the NRC acknowledges it as ‘functional containment.’

One entrepreneur described TRISO’s remarkable properties: “You know those giant concrete containment domes that surround old reactors in case something goes wrong? With TRISO, we’ve basically engineered the dome into every single fuel particle.”

TRISO provides microreactors with clean, compact, uninterrupted power, eliminating meltdown risks and massive containment structures.

China recently conducted safety testing by deactivating a nuclear reactor’s cooling system. The TRISO-powered reactor absorbed heat. The core cooled naturally. No alternative nuclear fuel demonstrates this capability.

Predictably, China remains the sole nation producing significant TRISO quantities.

Standard Nuclear will help America catch up.

Standard Nuclear represents genuine innovation. The company emerged following another company’s bankruptcy after its primary investor died. The team was commercializing TRISO, previously produced exclusively in America’s national laboratories.

Following the investor’s death, their commitment remained so strong that over 40 employees continued working approximately eight months without compensation. Some sold homes or downsized to maintain operations.

Their perseverance succeeded. In 2024, the organization reemerged as Standard Nuclear with $42 million in funding.

Standard Nuclear operates from Oak Ridge, Tennessee, formerly known as “Atomic City,” where Manhattan Project uranium enrichment occurred. It currently represents the largest TRISO manufacturing facility outside China.

Standard Nuclear recently secured $5 million in contracts and established offtake agreements exceeding $100 million with microreactor ventures including Radiant, Antares, and

NANO Nuclear Energy Inc. (NNE:NASDAQ).

“ROS never addresses the problem of nuclear waste storage.”

ROS Member John D highlighted this omission. Let me correct this.

Imagining radioactive material seeping from corroded containers seems frightening. Reality shows nuclear waste represents a resolved challenge. Innovators are transforming it into another opportunity.

Fundamentals: All nuclear waste ever generated throughout America — spanning 60 years — would occupy a single football field, stacked under 20 feet high.

Atomic byproducts have never harmed any American. Spent materials remain securely stored in sealed containers across 60+ locations throughout 34 states.

Why merely store it? SMR startups are creating reactors utilizing waste.

Oklo Inc.’s (OKLO:NYSE) Aurora microreactor, compact enough for a spacious living room, converts used fuel into fresh energy. Like automobiles running on exhaust fumes!

The most frustrating aspect regarding nuclear waste “problems” involves ignoring existing solutions for 60 years. Argonne National Laboratory constructed reactors capable of recycling nuclear waste into fuel during the 1960s!

Why isn’t fuel recycling standard practice? Blame political decisions. President Carter suspended reprocessing during the 1970s. Reagan reversed the prohibition, but companies had already pivoted elsewhere.

Consider Deep Isolation. I recently spoke with CEO Rod Baltzer. His company developed a methodology for permanently securing nuclear waste underground, utilizing directional drilling technology and their Universal Canister System.

Deep Isolation drills tunnels approximately pizza-box width into solid rock formations, reaching three miles beneath surface level. The tunnel’s bottom curves, creating an L-shaped pathway. They then insert sealed, corrosion-resistant containers filled with nuclear waste, designed for millennial timeframes.

Deep Isolation ensures waste disappears safely, permanently, and economically.

The genuine threat isn’t nuclear waste. It’s unrealized nuclear facilities, leaving us dependent on dirtier energy alternatives. Innovators are transforming perceived problems into productive power solutions.

Envision July 4, 2026. . . 

We’re celebrating America’s 250th anniversary. The initial three microreactors operate on American soil. These engineered marvels generate clean, safe, “constantly available” energy.

After meeting numerous nuclear entrepreneurs, I recognize their determination toward this objective. Teams sleep in production facilities. Engineers work 18-hour shifts. Founders dedicate their lives toward achieving that July 2026 milestone.

America’s prosperous future requires expanded energy access, not reduction. Remember: Rich, low-energy nations don’t exist.

In 1973 President Nixon proposed establishing 1,000 nuclear power plants before 2000. Better delayed than abandoned.

With 1,000 microreactors distributed across America, we could desalinate seawater and transform arid deserts into fertile land. Following hurricanes, mobile reactors could deploy, powering medical facilities and water systems within hours.

Building this future depends on communities nationwide embracing nuclear technology.

That’s where your role begins. Demonstrate to friends and relatives that nuclear represents our cleanest, safest energy resource. Challenge misinformed opposition.

Address questions resembling this inquiry: “What might terrorists accomplish capturing a microreactor?” Simple answer: they’d have years of clean energy, but concerns about weaponization are unfounded.

Perhaps most importantly, share nuclear innovation stories with younger generations! The Second Nuclear Age will create talent shortages. It requires engineers, technicians, machinists, and policy advocates.

The primary career aspiration among children today is… social media influencer. Disappointing. Let’s transform that to nuclear engineer!

At the Rational Optimist Society, we’re embracing nuclear technology and much more. We  help our members understand, appreciate, and take advantage of the innovations revolutionizing our world for the better, so they can confidently flourish as change continues to accelerate.

You can join us here.


Important Disclosures:

  1. As of the date of this article, officers and/or employees of Streetwise Reports LLC (including members of their household) own securities of Cameco Corp.
  2. Stephen McBride: I, or members of my immediate household or family, own securities of: None. My company has a financial relationship with: None. My company has purchased stocks mentioned in this article for my management clients: None. I determined which companies would be included in this article based on my research and understanding of the sector.
  3. Statements and opinions expressed are the opinions of the author and not of Streetwise Reports, Street Smart, or their officers. The author is wholly responsible for the accuracy of the statements. Streetwise Reports was not paid by the author to publish or syndicate this article. Streetwise Reports requires contributing authors to disclose any shareholdings in, or economic relationships with, companies that they write about. Any disclosures from the author can be found  below. Streetwise Reports relies upon the authors to accurately provide this information and Streetwise Reports has no means of verifying its accuracy.
  4.  This article does not constitute investment advice and is not a solicitation for any investment. Streetwise Reports does not render general or specific investment advice and the information on Streetwise Reports should not be considered a recommendation to buy or sell any security. Each reader is encouraged to consult with his or her personal financial adviser and perform their own comprehensive investment research. By opening this page, each reader accepts and agrees to Streetwise Reports’ terms of use and full legal disclaimer. Streetwise Reports does not endorse or recommend the business, products, services or securities of any company.

For additional disclosures, please click here.

California farmers identify a hot new cash crop: Solar power

By Jacob Stid, Michigan State University; Annick Anctil, Michigan State University, and Anthony Kendall, Michigan State University 

Imagine that you own a small, 20-acre farm in California’s Central Valley. You and your family have cultivated this land for decades, but drought, increasing costs and decreasing water availability are making each year more difficult.

Now imagine that a solar-electricity developer approaches you and presents three options:

  • You can lease the developer 10 acres of otherwise productive cropland, on which the developer will build an array of solar panels and sell electricity to the local power company.
  • You can select 1 or 2 acres of your land on which to build and operate your own solar array, using some electricity for your farm and selling the rest to the utility.
  • Or you can keep going as you have been, hoping your farm can somehow survive.

Thousands of farmers across the country, including in the Central Valley, are choosing one of the first two options. A 2022 survey by the U.S. Department of Agriculture found that roughly 117,000 U.S. farm operations have some type of solar device. Our own work has identified over 6,500 solar arrays currently located on U.S. farmland.

Our study of nearly 1,000 solar arrays built on 10,000 acres of the Central Valley over the past two decades found that solar power and farming are complementing each other in farmers’ business operations. As a result, farmers are making and saving more money while using less water – helping them keep their land and livelihood.

A hotter, drier and more built-up future

Perhaps nowhere in the U.S. is farmland more valuable or more productive than California’s Central Valley. The region grows a vast array of crops, including nearly all of the nation’s production of almonds, olives and sweet rice. Using less than 1% of all farmland in the country, the Central Valley supplies a quarter of the nation’s food, including 40% of its fruits, nuts and other fresh foods.

The food, fuel and fiber that these farms produce are a bedrock of the nation’s economy, food system and way of life.

But decades of intense cultivation, urban development and climate change are squeezing farmers. Water is limited, and getting more so: A state law passed in 2014 requires farmers to further reduce their water usage by the mid-2040s.

The trade-offs of installing solar on agricultural land

When the solar arrays we studied were installed, California state solar energy policy and incentives gave farm landowners new ways to diversify their income by either leasing their land for solar arrays or building their own.

There was an obvious trade-off: Turning land used for crops to land used for solar usually means losing agricultural production. We estimated that over the 25-year life of the solar arrays, this land would have produced enough food to feed 86,000 people a year, assuming they eat 2,000 calories a day.

There was an obvious benefit, too, of clean energy: These arrays produced enough renewable electricity to power 470,000 U.S. households every year.

But the result we were hoping to identify and measure was the economic effect of shifting that land from agricultural farming to solar farming. We found that farmers who installed solar were dramatically better off than those who did not.

They were better off in two ways, the first being financially. All the farmers, whether they owned their own arrays or leased their land to others, saved money on seeds, fertilizer and other costs associated with growing and harvesting crops. They also earned money from leasing the land, offsetting farm energy bills, and selling their excess electricity.

Farmers who owned their own arrays had to pay for the panels, equipment and installation, and maintenance. But even after covering those costs, their savings and earnings added up to US$50,000 per acre of profits every year, 25 times the amount they would have earned by planting that acre.

Farmers who leased their land made much less money but still avoided costs for irrigation water and operations on that part of their farm, gaining $1,100 per acre per year – with no up-front costs.

The farmers also conserved water, which in turn supported compliance with the state’s Sustainable Groundwater Management Act water use reduction requirements. Most of the solar arrays were installed on land that had previously been irrigated. We calculated that turning off irrigation on this land saved enough water every year to supply about 27 million people with drinking water or irrigate 7,500 acres of orchards. Following solar array installation, some farmers also fallowed surrounding land, perhaps enabled by the new stable income stream, which further reduced water use.

Changes to food and energy production

Farmers in the Central Valley and elsewhere are now cultivating both food and energy. This shift can offer long-term security for farmland owners, particularly for those who install and run their own arrays.

Recent estimates suggest that converting between 1.1% and 2.4% of the country’s farmland to solar arrays would, along with other clean energy sources, generate enough electricity to eliminate the nation’s need for fossil fuel power plants.

Though many crops are part of a global market that can adjust to changes in supply, losing this farmland could affect the availability of some crops. Fortunately, farmers and landowners are finding new ways to protect farmland and food security while supporting clean energy.

One such approach is agrivoltaics, where farmers install solar designed for grazing livestock or growing crops beneath the panels. Solar can also be sited on less productive farmland or on farmland that is used for biofuels rather than food production.

Even in these areas, arrays can be designed and managed to benefit local agriculture and natural ecosystems. With thoughtful design, siting and management, solar can give back to the land and the ecosystems it touches.

Farms are much more than the land they occupy and the goods they produce. Farms are run by people with families, whose well-being depends on essential and variable resources such as water, fertilizer, fuel, electricity and crop sales. Farmers often borrow money during the planting season in hopes of making enough at harvest time to pay off the debt and keep a little profit.

Installing solar on their land can give farmers a diversified income, help them save water, and reduce the risk of bad years. That can make solar an asset to farming, not a threat to the food supply.The Conversation

About the Authors:

Jacob Stid, Ph.D. student in Hydrogeology, Michigan State University; Annick Anctil, Associate Professor of Civil and Environmental Engineering, Michigan State University, and Anthony Kendall, Professor of Earth and Environmental Sciences, Michigan State University

This article is republished from The Conversation under a Creative Commons license. Read the original article.

Little Oil and Gas Junior at an Excellent Price

Source: Michael Ballanger (7/30/25) 

Michael Ballanger of GGM Advisory Inc. explains why he thinks Ring Energy Inc. (REI:NYSE) is a Buy.

Ring Energy Inc. (REI:NYSE) is an independent oil and gas exploration and production company focused on the Permian Basin in West Texas.

They engage in the acquisition, exploration, development, and production of oil and natural gas properties.  The company’s operations are primarily located in the Northwest Shelf and Central Basin Platform in West Texas.

Here’s a more detailed breakdown:

Core Business:

Ring Energy’s main activities include acquiring, exploring, developing, and producing oil and natural gas.

Geographic Focus:

The company’s operations are concentrated in the Permian Basin, specifically the Northwest Shelf and Central Basin Platform in West Texas.

Production Method:

Ring Energy primarily utilizes vertical drilling to produce oil and natural gas, according to TMX Money and Simply Wall Street.

Company Size:

With 108 employees, Ring Energy is considered a mid-sized company within the energy sector.

 Headquarters:

The company’s headquarters are located in The Woodlands, Texas.

Recent Performance:

In 2023, Ring Energy saw record fourth quarter and full year oil and gas sales volumes, according to their press release.

Recent Price:

The shares are trading at the US$0.8223 level with a 52-week range of US$.72 to US$1.99.

Valuation: 

The shares trade at a 30 P/E and have a book value of US$4.24.

Conclusion

The shares of this little junior oil and gas producer are an excellent place to hide in the event of a painful correction overtaking the U.S. equity markets.

The stock is cheap trading at a fraction of book value versus the industry average shown below:

If we call REI an “explorer-producer,” then it should trade at 1.74 times book value which was established at $4.24 so $4.24 times 1.74 = $7.37 per share. From what I am hearing through my dear friend Freddie (of Freddie’s Corner fame), there has been talk of a buyer surfacing.

Well, we hear those narratives all the time but being the super sleuth that he is Freddie drew my attention to the REI September $1.00 calls where the volume today exceeds 30,722 contracts with a daily range of $0.01-$0.08 per contract.

Since the stock hasn’t been over $1.00 since April 7, someone is making a big bet that it will before September 19. What option volume like this tells us is that someone might be getting ready to make a bid for Ring so with a P/E of only 2.30 while trading at 19.58% of book versus industry average at 1.74, valuation is cheap enough to represent minimal downside risk versus substantial capital appreciation potential.

This is a great proxy for one’s allocation to the energy sector.

In the GGMA 2025 Portfolio Account:

  • BUY 50,000 REI at $0.83
  • Target $2.00


Important Disclosures:

  1. Michael Ballanger: I, or members of my immediate household or family, own securities of: Ring Energy. My company has a financial relationship with: None. My company has purchased stocks mentioned in this article for my management clients: None. I determined which companies would be included in this article based on my research and understanding of the sector.
  2. Statements and opinions expressed are the opinions of the author and not of Streetwise Reports, Street Smart, or their officers. The author is wholly responsible for the accuracy of the statements. Streetwise Reports was not paid by the author to publish or syndicate this article. Streetwise Reports requires contributing authors to disclose any shareholdings in, or economic relationships with, companies that they write about. Any disclosures from the author can be found  below. Streetwise Reports relies upon the authors to accurately provide this information and Streetwise Reports has no means of verifying its accuracy.
  3.  This article does not constitute investment advice and is not a solicitation for any investment. Streetwise Reports does not render general or specific investment advice and the information on Streetwise Reports should not be considered a recommendation to buy or sell any security. Each reader is encouraged to consult with his or her personal financial adviser and perform their own comprehensive investment research. By opening this page, each reader accepts and agrees to Streetwise Reports’ terms of use and full legal disclaimer. Streetwise Reports does not endorse or recommend the business, products, services or securities of any company.

For additional disclosures, please click here.

Michael Ballanger Disclosures

This letter makes no guarantee or warranty on the accuracy or completeness of the data provided. Nothing contained herein is intended or shall be deemed to be investment advice, implied or otherwise. This letter represents my views and replicates trades that I am making but nothing more than that. Always consult your registered advisor to assist you with your investments. I accept no liability for any loss arising from the use of the data contained on this letter. Options and junior mining stocks contain a high level of risk that may result in the loss of part or all invested capital and therefore are suitable for experienced and professional investors and traders only. One should be familiar with the risks involved in junior mining and options trading and we recommend consulting a financial adviser if you feel you do not understand the risks involved.

How wind and solar power helps keep America’s farms alive

By Paul Mwebaze, University of Illinois at Urbana-Champaign 

Drive through the plains of Iowa or Kansas and you’ll see more than rows of corn, wheat and soybeans. You’ll also see towering wind turbines spinning above fields and solar panels shining in the sun on barns and machine sheds.

For many farmers, these are lifelines. Renewable energy provides steady income and affordable power, helping farms stay viable when crop prices fall or drought strikes.

But some of that opportunity is now at risk as the Trump administration cuts federal support for renewable energy.

Wind power brings steady income for farms

Wind energy is a significant economic driver in rural America. In Iowa, for example, over 60% of the state’s electricity came from wind energy in 2024, and the state is a hub for wind turbine manufacturing and maintenance jobs.

For landowners, wind turbines often mean stable lease payments. Those historically were around US$3,000 to $5,000 per turbine per year, with some modern agreements $5,000 to $10,000 annually, secured through 20- to 30-year contracts.

Nationwide, wind and solar projects contribute about $3.5 billion annually in combined lease payments and state and local taxes, more than a third of it going directly to rural landowners.

A U.S. map shows the strongest wind power potential in the central U.S., particularly the Great Plains and Midwestern states.
States throughout the Great Plains and Midwest, from Texas to Montana to Ohio, have the strongest onshore winds and onshore wind power potential. These are also in the heart of U.S. farm country. The map shows wind speeds at 100 meters (nearly 330 feet), about the height of a typical land-based wind turbine.
NREL

These figures are backed by long-term contracts and multibillion‑dollar annual contributions, reinforcing the economic value that turbines bring to rural landowners and communities.

Wind farms also contribute to local tax revenues that help fund rural schools, roads and emergency services. In counties across Texas, wind energy has become one of the most significant contributors to local property tax bases, stabilizing community budgets and helping pay for public services as agricultural commodity revenues fluctuate.

In Oldham County in northwest Texas, for example, clean energy projects provided 22% of total county revenues in 2021. In several other rural counties, wind farms rank among the top 10 property taxpayers, contributing between 38% and 69% of tax revenue.

The construction and operation of these projects also bring local jobs in trucking, concrete work and electrical services, boosting small-town businesses.

The U.S. wind industry supports over 300,000 U.S. jobs across construction, manufacturing, operations and other roles connected to the industry, according to the American Clean Power Association.

Renewable energy has been widely expected to continue to grow along with rising energy demand. In 2024, 93% of all new electricity generating capacity was wind, solar or energy storage, and the U.S. Energy Information Administration expected a similar percentage in 2025 as of June.

Solar can cut power costs on the farm

Solar energy is also boosting farm finances. Farmers use rooftop panels on barns and ground-mounted systems to power irrigation pumps, grain dryers and cold storage facilities, cutting their power costs.

Some farmers have adopted agrivoltaics – dual-use systems that grow crops beneath solar panels. The panels provide shade, helping conserve water, while creating a second income path. These projects often cultivate pollinator-friendly plants, vegetables such as lettuce and spinach, or even grasses for grazing sheep, making the land productive for both food and energy.

Federal grants and tax credits that were significantly expanded under the 2022 Inflation Reduction Act helped make the upfront costs of solar installations affordable.

However, the federal spending bill signed by President Donald Trump on July 4, 2025, rolled back many clean energy incentives. It phases down tax credits for distributed solar projects, particularly those under 1 megawatt, which include many farm‑scale installations, and sunsets them entirely by 2028. It also eliminates bonus credits that previously supported rural and low‑income areas.

Without these credits, the upfront cost of solar power could be out of reach for some farmers, leaving them paying higher energy costs. At a 2024 conference organized by the Institute of Sustainability, Energy and Environment at the University of Illinois Urbana-Champaign, where I work as a research economist, farmers emphasized the importance of tax credits and other economic incentives to offset the upfront cost of solar power systems.

What’s being lost

The cuts to federal incentives include terminating the Production Tax Credit for new projects placed in service after Dec. 31, 2027, unless construction begins by July 4, 2026, and is completed within a tight time frame. The tax credit pays eligible wind and solar facilities approximately 2.75 cents per kilowatt-hour over 10 years, effectively lowering the cost of renewable energy generation. Ending that tax credit will likely increase the cost of production, potentially leading to higher electricity prices for consumers and fewer new projects coming online.

The changes also accelerate the phase‑out of wind power tax credits. Projects must now begin construction by July 4, 2026, or be in service before the end of 2027 to qualify for any credit.

Meanwhile, the Investment Tax Credit, which covers 30% of installed cost for solar and other renewables, faces similar limits: Projects must begin by July 4, 2026, and be completed by the end of 2027 to claim the credits. The bill also cuts bonuses for domestic components and installations in rural or low‑income locations. These adjustments could slow new renewable energy development, particularly smaller projects that directly benefit rural communities.

While many existing clean energy agreements will remain in place for now, the rollback of federal incentives threatens future projects and could limit new income streams. It also affects manufacturing and jobs in those industries, which some rural communities rely on.

Renewable energy also powers rural economies

Renewable energy benefits entire communities, not just individual farmers.

Wind and solar projects contribute millions of dollars in tax revenue. For example, in Howard County, Iowa, wind turbines generated $2.7 million in property tax revenue in 2024, accounting for 14.5% of the county’s total budget and helping fund rural schools, public safety and road improvements.

In some rural counties, clean energy is the largest new source of economic activity, helping stabilize local economies otherwise reliant on agriculture’s unpredictable income streams. These projects also support rural manufacturing – such as Iowa turbine blade factories like TPI Composites, which just reopened its plant in Newton, and Siemens Gamesa in Fort Madison, which supply blades for GE and Siemens turbines. The tax benefits in the 2022 Inflation Reduction Act helped boost those industries – and the jobs and local tax revenue they bring in.

On the solar side, rural companies like APA Solar Racking, based in Ohio, manufacture steel racking systems for utility-scale solar farms across the Midwest.

An example of how renewable energy has helped boost farm incomes and keep farmers on their land.

As rural America faces economic uncertainty and climate pressures, I believe homegrown renewable energy offers a practical path forward. Wind and solar aren’t just fueling the grid; they’re helping keep farms and rural towns alive.The Conversation

About the Author:

Paul Mwebaze, Research Economist at the Institute for Sustainability, Energy and Environment, University of Illinois at Urbana-Champaign

This article is republished from The Conversation under a Creative Commons license. Read the original article.

Zimbabwe’s lithium is in demand for making batteries: how to make sure benefits flow to the local economy

By Jabulani Shaba, University of Groningen 

Zimbabwe has the largest lithium reserves on the African continent. Lithium has been mined since the colonial period in the 1950s. It’s a critical part of rechargeable lithium-ion batteries that are essential for the electric vehicle industry. Globally, the lithium-ion battery market is worth US$78.9 billion and is likely to amount to US$349.6 billion by 2034.

In 2021, there was a new lithium rush in Zimbabwe because of increased global demand for the mineral. Today, most of Zimbabwe’s lithium mines are owned by Chinese mining companies like Sinomine, Zhejiang Huayo Cobalt, Chengxin Lithium, Yahua and Canmax.

Lithium-ion batteries aren’t made in Zimbabwe. Instead, the country exports the mineral as a raw resource. Much of the value of Zimbabwe’s lithium – 480,000 metric tonnes mined since 2015 – is reaped by companies in China which make the raw lithium into batteries and other goods.

During the lithium rush, artisanal miners were involved in the lithium industry. They mined and sold raw ore. But their participation has recently slowed down because artisanal lithium mining is largely illegal. For this reason, official data reports haven’t been able to record how much lithium has been mined this way.

In 2022, the Zimbabwean government banned the export of raw lithium ore in an attempt to regulate the industry and curb artisanal lithium mining and illicit exports.

However, it was still permitted to export lithium concentrate (a powdered version of the raw mineral). But the government recently decided to ban the export of lithium concentrate from January 2027. It says the ban will improve the country’s efforts towards building facilities that add value to lithium, such as lithium refineries and battery production plants.

I research resource extraction and environmental change caused by mining in southern Africa.

If properly implemented and regulated, the new ban on exporting lithium concentrate could increase Zimbabwe’s self-sufficiency in lithium processing. It could even help the country achieve the middle-income economy it has set out in its Vision 2030, in which it aims to have a mining industry that generates US$12 billion a year in revenue. Zimbabwe has the world’s second largest reserves of platinum and huge supplies of chrome. Making goods locally from lithium would expand the mineral export revenue in addition to platinum and chrome.

However, becoming a middle-income nation is currently hampered by mining revenue leaking away – through losses from smuggling, tax evasion and others.

Also, environmental justice groups estimate that about 3,000 tonnes of raw lithium leaves the country daily. Between now and the time the 2027 ban on exporting lithium concentrate comes into effect, about 1.6 million additional tonnes of raw lithium could have been extracted and sent overseas. This means the government should not wait for 2027, but should implement the ban on lithium concentrate exports now.

The ban also doesn’t seem to be aimed at uplifting the livelihoods of communities who live near lithium mines. I describe these communities as living in sacrifice zones: they bear the brunt of lithium mining pollution and land grabs for mines. These vulnerable groups include women, children and artisanal lithium miners who have been disempowered by the just transition.

To use its lithium reserves to uplift the country, the government of Zimbabwe needs to establish local plans that place community development and improved livelihood of mining communities at the centre of mining. This could be done through pro-poor development policies that will create employment opportunities for local people in lithium mining frontiers. It could also include compelling mines to purchase locally made goods and fresh produce. Bringing artisanal miners into local value chains in gold, diamond and chrome mining would also help these informal miners become part of the formal mining economy.

The politics of lithium mining in Zimbabwe

Zimbabwe is one of the 10 biggest global lithium exporters (Chile, Argentina and Australia are others). In the first nine months of 2023 alone, it is estimated that about US$209 million worth of Zimbabwean lithium was sold.

The potential of lithium to stimulate economic development and attract international investments is unquestionable. The problem, however, over the last few years seems to be that the market isn’t regulated enough. Lithium mining has not created many jobs, and for the few that are employed, there’ve been gross human rights abuses, wage cuts, and a lack of investment in road infrastructure.

The politics of lithium mining are also shaped by networks of political elites. They are known as the lithium barons: people who engage in corrupt deals and smuggling.

Another problem has been the misplaced focus on artisanal miners. For example, the 2022 lithium ban mainly targeted artisanal lithium miners who were on the margins of the industry. It did not affect large-scale mining companies to the same extent. When the lithium ban was introduced, the market for processed lithium expanded and the demand for unprocessed lithium drastically shrank. This left artisanal miners with raw lithium and a shrinking market price.

What needs to happen next

Between now and 2027, lithium mining companies in Zimbabwe will try to extract as much lithium as possible before the ban comes into effect. This could deplete the lithium reserves in the country. Mining investors might look elsewhere.

The Zimbabwean government should take these steps to solve the problem:

1) The Zimbabwe government must ensure total monopoly of its lithium reserves. The over-reliance on Chinese investments in the lithium industry has set a bad precedent for what might happen with other minerals in future. It will take time for the government to undo this and set up its own monopoly. This resource sovereignty will be vital.

2) The government must consider how to govern minerals in a people-centred way. So far, lithium has not benefited ordinary Zimbabweans.

3) The resource communities where extraction deals are taking place must be consulted and brought into the conversation about how Zimbabwe can benefit from its lithium reserves. Communities in Zimbabwe like Buhera, Bikita, Mberengwa and Goromonzi have endured years of lithium mining pollution.

This includes their freshwater sources being contaminated by mines, toxic dust from blasting, mineworkers being exposed to hazardous and unsafe working conditions, displacement, and above all gross human rights abuses from multinational lithium mining companies.

4) The ban on the exports of lithium concentrates is crucial for stimulating local beneficiation and value addition. The government should implement this ban immediately rather than waiting for the 2027 timeline.The Conversation

About the Author:

Jabulani Shaba, Postdoctoral researcher, University of Groningen

This article is republished from The Conversation under a Creative Commons license. Read the original article.

Oil prices have been declining for four consecutive days. Natural gas prices have fallen to a two-month low

By JustMarkets 

On Wednesday, the US stocks closed with solid gains: the Dow Jones (US30) rose by 1.14%, the S&P 500 (US500) increased by 0.78%, and the tech-heavy Nasdaq (US100) closed up 0.61%. The US equities extended their gains on Wednesday following reports that the US would agree to a trade deal with the EU, building on previous momentum from a deal with Japan. Reports indicate that the US is close to reaching an agreement to lower tariffs on EU goods from 30% to 15%, aligning with the measures taken with Japan and reinforcing expectations that aggressive tariffs will be scaled back by August. Optimistic corporate earnings also supported the indices.

European stock markets traded higher yesterday. Germany’s DAX (DE40) rose by 0.83%, France’s CAC 40 (FR40) ended up 1.37%, Spain’s IBEX35 (ES35) gained 0.19%, and the UK’s FTSE 100 (UK100) closed 0.42% higher. European stocks ended Wednesday with a strong rebound, breaking a three-day losing streak, amid expectations that the US might agree to lower tariff rates after reaching a new trade deal with Japan. Progress on automotive tariffs, which heavily impact car manufacturers, drove gains in the shares of BMW, Stellantis, Mercedes-Benz, and Volkswagen, rising between 4% and 9%. Additionally, UniCredit jumped 3.5% after releasing its earnings, although the bank confirmed it had abandoned its planned acquisition of Banco BPM due to opposition from Rome.

WTI crude oil prices fell to $65 per barrel on Wednesday, marking a fourth straight day of declines, as investors focused on US trade negotiations. Treasury Secretary Scott Bessent said he would meet with Chinese officials in Stockholm next week to discuss an extension of the trade truce, possibly including Chinese purchases of Russian and Iranian oil under sanctions. Meanwhile, US government data showed crude inventories fell by 3.17 million barrels last week, exceeding expectations. Despite the sharper-than-expected inventory drop, oil prices remain under pressure due to concerns that ongoing tariff tensions could weaken global demand, even as OPEC+ increases production.

The US natural gas prices fell by more than 5% to below $3.10 per MMBtu, the lowest level since April 22, pressured by near-record production levels and expectations for milder weather than previously expected. Despite summer heat, analysts expect record output to continue supporting robust storage replenishment. Current inventories are already 6% above seasonal norms.

Asian markets mostly rose yesterday. Japan’s Nikkei 225 (JP225) jumped by 3.51%, China’s FTSE China A50 (CHA50) increased by 0.30%, Hong Kong’s Hang Seng (HK50) gained 1.62%, and Australia’s ASX 200 (AU200) posted a 0.69% rise.

On Tuesday, the Hang Seng Index closed at 25,538, marking its fourth consecutive gain and reaching its highest level in nearly four years. The rally was driven by broad sectoral gains and optimism ahead of a scheduled US-China meeting in Stockholm next week, the third round of talks aimed at extending the tariff truce. Bullish sentiment was further fueled by reports that daily trading volume on Chinese stock markets surged to a nearly five-month high, while margin financing reached its highest level in nearly four months. Meanwhile, Beijing recently approved the construction of a massive hydroelectric power plant in Tibet.

Stocks in Singapore rose to 4,252 in early Thursday trading, posting their 14th consecutive session of gains, following Wall Street’s rally on Wednesday after the US reached trade deals with the EU. Data released Wednesday showed that overall inflation in June remained at its lowest level since February 2021, with core inflation steady at 0.6%, below expectations and within the Monetary Authority of Singapore’s annual target range of 0.5% to 1.5%. These solid figures followed last week’s data showing stronger-than-expected Q2 GDP growth and the fastest export growth in 11 months.

S&P 500 (US500) 6,358.91 +49.29 (+0.78%)

Dow Jones (US30) 45,010.29 +507.85 (+1.14%)

DAX (DE40) 24,240.82 +198.92 (+0.83%)

FTSE 100 (UK100) 9,061.49 +37.68 (+0.42%)

USD Index 97.21 −0.18 (−0.18%)

News feed for: 2025.07.24

  • Australia Manufacturing PMI (m/m) at 02:00 (GMT+3);
  • Australia Services PMI (m/m) at 02:00 (GMT+3);
  • Japan Manufacturing PMI (m/m) at 03:30 (GMT+3);
  • Japan Services PMI (m/m) at 03:30 (GMT+3);
  • Germany GfK Consumer Confidence (m/m) at 09:00 (GMT+3);
  • Germany Manufacturing PMI (m/m) at 10:30 (GMT+3);
  • Germany Services PMI (m/m) at 10:30 (GMT+3);
  • Eurozone Manufacturing PMI (m/m) at 11:00 (GMT+3);
  • Eurozone Services PMI (m/m) at 11:00 (GMT+3);
  • UK Manufacturing PMI (m/m) at 11:30 (GMT+3);
  • UK Services PMI (m/m) at 11:30 (GMT+3);
  • Eurozone ECB Interest Rate Decision at 15:15 (GMT+3);
  • Eurozone ECB Monetary Policy Statement at 15:15 (GMT+3);
  • Canada Retail Sales (m/m) at 15:30 (GMT+3);
  • US Initial Jobless Claims (w/w) at 15:30 (GMT+3);
  • Eurozone ECB Press Conference at 15:45 (GMT+3);
  • US Manufacturing PMI (m/m) at 16:45 (GMT+3);
  • US Services PMI (m/m) at 16:45 (GMT+3);
  • US New Home Sales (m/m) at 17:00 (GMT+3);
  • US Natural Gas Storage (w/w) at 17:30 (GMT+3).

By JustMarkets


This article reflects a personal opinion and should not be interpreted as an investment advice, and/or offer, and/or a persistent request for carrying out financial transactions, and/or a guarantee, and/or a forecast of future events.

Why energy markets fluctuate during an international crisis

By Skip York, Rice University 

Global energy markets, such as those for oil, gas and coal, tend to be sensitive to a wide range of world events – especially when there is some sort of crisis. Having worked in the energy industry for over 30 years, I’ve seen how war, political instability, pandemics and economic sanctions can significantly disrupt energy markets and impede them from functioning efficiently.

A look at the basics

First, consider the economic fundamentals of supply and demand. The risk most people imagine in the current crisis between Israel, the U.S. and Iran is that Iran, which is itself a major oil-producing country, might suddenly expand the conflict by threatening the ability of neighboring countries to supply oil to the world.

Oil wells, refineries, pipelines and shipping lanes are the backbone of energy markets. They can be vulnerable during a crisis: Whether there is deliberate sabotage or collateral damage from military action, energy infrastructure often takes a hit.

For instance, after Saddam Hussein invaded Kuwait in August 1990, Iraqi forces placed explosive charges on Kuwaiti oil wells and began detonating them in January 1991. It took months for all the resulting fires to be put out, and millions of barrels of oil and hundreds of millions of cubic meters of natural gas were released into the environment – rather than being sold and used productively somewhere around the world.

Scenes of Kuwaiti life during and after the Gulf War of 1990 and 1991 include images of oil wells burning as a result of Iraqi sabotage.

Logistics can mess markets up too. For instance, closing critical maritime routes like the Strait of Hormuz or the Suez Canal can cause transportation delays.

Whether supply is lost from decreased production or blocked transportation routes, the effect is less oil available to the market, which not only causes prices to rise in general, but it also makes them more volatile – tending to change more frequently and by larger amounts.

On the flip side, demand can also shift radically. During the 1990-1991 Gulf War, demand rose: U.S. forces alone used more than 2 billion gallons of fuel, according to an Army analysis. By contrast, during the COVID-19 pandemic, industries shut down, travel came to a halt and energy demand plummeted.

When crisis looms, countries and companies often start stockpiling oil and other raw materials rather than buying only what they need right now. That creates even more imbalance, resulting in price volatility that leaves everyone, both consumers and producers, with a headache.

Regional considerations

In addition to uncertainties around market fundamentals, it’s important to note that many of the world’s energy reserves are located in regions that have not been models of stability. In the Middle East, wars, revolutions and diplomatic disputes there can raise concerns about supply, demand or both.

Those worries send shock waves through the world’s energy markets. It’s like walking on a tightrope: One wrong move – or even the perception of a misstep – can make the market wobble.

Governments’ economic sanctions, such as those restricting trade with Iran, Russia or Venezuela, can distort production and investment decisions and disrupt trade flows. Sometimes markets react even before sanctions are officially in place: Just the rumor of a possible embargo can cause prices to spike as buyers scramble to secure resources.

In 2008, for example, India and Vietnam imposed rice export bans, and rumors of additional restrictions fueled panic buying and nearly doubled prices in months.

In those scrambles, the role of investor speculation enters the picture. Energy commodities, such as oil and gas, aren’t just physical resources; they’re also traded as financial assets like stocks and bonds. During uncertain times, traders don’t wait around for actual changes in supply and demand. They react to news and forecasts, sometimes in large groups, which can shift the market just with the actions that result from their fears or hopes.

The events on June 22, 2025, are a good example of how this dynamic works. The Iranian parliament passed a resolution authorizing the country’s Supreme Council to close the Strait of Hormuz. Immediately, oil prices started rising, even though the strait was still open, with oil tankers steaming through unimpeded.

The next day, Iran launched a missile strike on Qatar, but coordinated in advance with Qatari officials to minimize damage and casualties. Traders and analysts perceived the action as a de-escalatory signal and anticipated that the Supreme Council was not going to close the strait. So prices started to fall.

It was a price roller coaster, fueled by speculation rather than reality. And computer algorithms and artificial intelligence, which assist in making automated trades, only add to the chaos of price changes.

Shipping activity in the Persian Gulf and the Strait of Hormuz decreased after Israel’s attacks on Iranian nuclear facilities.

A broader look

International crises can also cause wider changes in countries’ economies – or the global economy as a whole – which in turn affect the energy market.

If a crisis sparks a recession, rising inflation or high unemployment, those tend to cause people and businesses to use less energy. When the underlying situation stabilizes, recovery efforts can mean energy consumption resumes. But it’s like a pendulum swinging back and forth, with energy markets caught in the middle.

Renewable energy is not immune to international crisis and chaos. The supply is less affected by market forces: The amount of available sunlight and wind isn’t tied to geopolitical relations. But overall economic conditions still affect demand, and a crisis can disrupt the supply chains for the equipment needed to harness renewable energy, like solar panels and wind turbines.

It’s no wonder energy markets are so jittery during international crises. A mix of imbalances between supply and demand, vulnerable infrastructure, political tensions, corporate worries and speculative trading all weave together into a complex web of volatility.

For policymakers, investors and consumers, understanding these dynamics is key to navigating the ups and downs of energy markets in a crisis-prone world. The solutions aren’t simple, but being informed is the first step toward stability.The Conversation

About the Author:

Skip York, Nonresident Fellow in Energy and Global Oil, Baker Institute for Public Policy, Rice University

This article is republished from The Conversation under a Creative Commons license. Read the original article.

Uranium Tech Breakthroughs Leading to Global Nuclear Renaissance

Source: Streetwise Reports (6/20/25)

U.S. President Donald Trump enacted executive orders designed to accelerate reactor approvals, enhance domestic uranium production and enrichment capabilities, and promote nuclear technologies. See how this has put the nuclear and uranium sectors in focus for investors. 

U.S. President Donald Trump in May enacted four executive orders designed to accelerate reactor approvals, enhance domestic uranium production and enrichment capabilities, and promote the advancement of innovative nuclear technologies.

Trump urged the federal government to expedite the construction of nuclear reactors and to reform the “risk averse” regulatory environment, with the goal of increasing the country’s nuclear energy capacity fourfold by 2050, reported Kamen Kraev for NucNet on May 26.

The directives call for the Department of Energy (DOE) to initiate the construction of 10 large reactors by 2030 and to assist in financing upgrades for existing facilities.

A statement from the White House proclaimed that “America will usher in a nuclear energy renaissance,” after years of “stagnation and shuttered reactors,” Kraev wrote.

“Across the country, American entrepreneurs and engineers are launching a new generation of nuclear companies featuring innovative reactor designs and scalable manufacturing techniques that can make nuclear safe, efficient, and economic,” said White House Science and Technology Policy Director Michael Kratsios in an opinion piece on The White House website. “The Trump Administration will clear their path by dismantling outdated barriers that previous administrations had put up in their way.”

Per the announcement, the orders require the U.S. Nuclear Regulatory Commission (NRC) to simplify licensing processes for new reactors, permit testing of reactor designs at DOE laboratories, and allow new reactor construction on federal lands.

The NRC is expected to shorten approval timelines from multiple years to 18 months, while the DOE will identify federal land that is suitable for new nuclear facilities, and initiatives will be undertaken to bolster U.S. uranium mining and domestic enrichment capacities.

“The NRC has failed to license new reactors even as technological advances promise to make nuclear power safer, cheaper, more adaptable, and more abundant than ever,” a fact sheet from the White House stated, according to Kraev’s report.

Kratsios added in his piece, “America’s great innovators and entrepreneurs have run into brick walls when it comes to nuclear technology.”

The Catalyst: Global Investment Growing

The uranium sector has transitioned into a period of heightened focus as the U.S. seeks to revitalize the domestic atomic energy industry and its related supply infrastructure.

Around the world, the transition to clean energy and decarbonization goals have sparked renewed interest in nuclear power, leading to surging demand.

Several countries, including the U.S., the United Kingdom and South Korea, have announced plans to expand nuclear energy capacity by 2050, reported The Astana Times on June 10. Other countries are exploring new builds and/or extending the life span of existing nuclear power plants.

New and high demand is coming from technology sectors needing reliable, carbon-free, around-the-clock power to run their data centers and artificial intelligence systems. Tech giants, including Meta, Amazon, Microsoft and Google, continue to invest in nuclear energy to meet this need.

Global investment in nuclear energy has grown 50% each year since 2020, and nuclear capacity is expected to increase 130% by 2050, The Astana Times reported.

Recently introduced governmental initiatives regarding the U.S. uranium sector already have increased domestic momentum and renewed optimism, purported HoldCo Markets in a May 28 research report.

“We anticipate uranium stocks, both large and small, to benefit from changing U.S. nuclear policy,” wrote David Talbot, head of equity research at Red Cloud Securities, in a May 23 Uranium Sector Update.

Using Lasers to Separate Isotopes

LIS Technologies Inc. (LIST), a U.S.-based private company, specializes in proprietary development of an advanced technology to utilize infrared lasers for the selective excitation of molecules, allowing for the separation of desired isotopes from others.

Its Laser Isotope Separation Technology (L.I.S.T) boasts a wide array of applications, distinguishing itself as the only U.S.-origin (and patented) laser uranium enrichment firm, while offering numerous advantages over conventional techniques such as gas diffusion, centrifugation, and previous laser enrichment methods. The proprietary laser-driven process developed by LIST is designed to be more energy-efficient and presents the opportunity for deployment with significantly competitive capital and operational expenses.

L.I.S.T focuses on Low Enriched Uranium (LEU) for existing civilian nuclear facilities, High-Assay LEU (HALEU) aimed at the next generation of Small Modular Reactors (SMR) and Microreactors, the production of stable isotopes for medical and scientific applications, as well as contributions to quantum computing production for semiconductor technologies, the company said. LIS boasts a top-tier nuclear technical team collaborating with prominent nuclear entrepreneurs and industry experts, fostering strong connections within both governmental and private nuclear sectors.

In 2024, LIS Technologies Inc. was chosen as one of six domestic firms to engage in the LEU Enrichment Acquisition Program, which has a total budget of up to $3.4 billion, with contracts extending up to 10 years. Each recipient is projected to secure a minimum contract of US$2 million.

The company has been folding in talent recently, appointing former Deputy Administrator of the National Nuclear Security Administration (NNSA) Brent Park as its executive director of nuclear security and safeguards policy, prominent researcher and engineer Lakasz Urbanski as director of its stable isotope laser program, and leading regulatory expert Julie Olivier as its regulatory affairs and licensing director.

“LIST’s technology arrives at a pivotal moment, as the United States accelerates efforts to build a secure, domestic nuclear‑fuel supply chain,” Park said. “This proprietary technology can be a key step toward reducing reliance on foreign sources of enriched uranium and strengthening our national energy independence. I’m honored to join the company and look forward to advising the leadership team as they advance the CRISLA technology from revival to commercialization.”

Technology Undergoes Evaluation

Last month, the company announced that a group of independent evaluators conducted a Technology Readiness Level Assessment (TRA) of its CRISLA-3G technology at the LIST facility in Oak Ridge, Tennessee.

The CRISLA-3G laser isotope separation technology underwent evaluation and was confirmed to satisfy all criteria necessary for a TRL-4 rating, in accordance with the Department of Energy guidelines specified in DOE G 413.3-4A. This indicates that all essential components were successfully validated in a lab setting, backed by experimental outcomes from the integrated system.

“We are very pleased that the independent Technology Readiness Assessment team scored our TRL at 4, meeting 27 out of 27 criteria,” said Chief Executive Officer and co-founder Christo Liebenberg. “Additionally, the critical technical elements (CTEs) necessary for advancing through TRL-5, TRL-6, and TRL-7 in the upcoming years were also identified. We are confident in our capability to achieve all these CTEs as we pursue our path to commercialization.”

“With our engagement with the TRL assessment team, I feel reassured that our technology is progressing in the right direction,” said Co-Chief Technical Officer Viktor Chikan. “In my opinion, the TRL assessment offers essential transparency for both investors and the technical team to implement the project plan effectively and realize the commercial enrichment facility based on CRISLA technology.”

NANO Nuclear Energy Inc.

One public company on the cutting edge of new nuclear designs is NANO Nuclear Energy Inc. (NNE:NASDAQ). Earlier this year, the company set up a dedicated demonstration facility in Westchester County, New York, aimed at testing and validating essential non-nuclear elements of its microreactor designs. This facility will underpin the development of four microreactor models — ZEUS, ODIN, LOKI MMR, and KRONOS MMR — all engineered to deliver portable and scalable solutions for clean energy.

A primary emphasis of the facility will be on the company’s work with the Annular Linear Induction Pump (ALIP) technology, developed as part of a Small Business Innovation Research (SBIR) Phase III initiative. ALIP is an electromagnetic pump geared toward efficient thermal fluid management, which is crucial for nuclear energy applications. “This advanced facility will play a major role in our development efforts, providing our technical teams with access to key physical data,” stated Jay Yu, Founder and Chairman of NANO Nuclear Energy, in the press release.

To aid in the facility’s construction and development, NANO Nuclear has collaborated with aRobotics Company, an innovator in robotic fabrication and engineering. aRobotics will oversee the multimillion-dollar expansion of the facility and manage the production of crucial non-nuclear components for NANO Nuclear’s reactors, including tailored sensors and equipment to enhance ALIP technology. Their extensive background with the U.S. Department of Defense is expected to bolster safety and performance standards as NANO Nuclear progresses with its reactor innovations.

Streetwise Ownership Overview*

NANO Nuclear Energy Inc. (NNE:NASDAQ)

Retail: 52%
Strategic Investors: 24%
Institutions: 22%
Management & Insiders: 2%
52.0%
24.0%
22.0%
*Share Structure as of 6/20/2025


This facility is particularly timely, as New York State is investigating advanced nuclear energy options. NANO Nuclear has recently replied to a Request for Information (RFI) from the New York State Energy Research and Development Authority (NYSERDA) concerning the potential for new nuclear technology initiatives within the state. The company anticipates that the facility will be operational by the spring of 2025.

“Once operational, the facility will provide our technical teams with invaluable opportunities to gather physical data and optimize designs to integrate non-nuclear components effectively,” Chief Executive Officer and Head of Reactor Development James Walker said.

Ownership and Share Structure

According to Refinitv, 24% of Nano Nuclear is held by one strategic investor, I Financial Ventures Group LLC. Nearly 2% is with management and insiders, 22% is with institutions, and the rest is retail.

Notably, NNE was added to the VanEck Nuclear ETF, signaling increased institutional confidence and positioning the company within a portfolio of key players in the nuclear energy sector.

NANO Nuclear Energy Inc. has a market capitalization of approximately US$1.57 billion, with 41.39 million shares outstanding.


Important Disclosures:

  1. As of the date of this article, officers and/or employees of Streetwise Reports LLC (including members of their household) own securities of LIS Technologies Inc.
  2. Steve Sobek wrote this article for Streetwise Reports LLC and provides services to Streetwise Reports as an employee.
  3. This article does not constitute investment advice and is not a solicitation for any investment. Streetwise Reports does not render general or specific investment advice and the information on Streetwise Reports should not be considered a recommendation to buy or sell any security. Each reader is encouraged to consult with his or her personal financial adviser and perform their own comprehensive investment research. By opening this page, each reader accepts and agrees to Streetwise Reports’ terms of use and full legal disclaimer. Streetwise Reports does not endorse or recommend the business, products, services or securities of any company.

For additional disclosures, please click here.

Speculator Extremes: Brent Oil, Silver and 5-Year Bonds lead Bullish & Bearish Positions

By InvestMacro

The latest update for the weekly Commitment of Traders (COT) report was released by the Commodity Futures Trading Commission (CFTC) on Friday for data ending on June 10th.

This weekly Extreme Positions report highlights the Most Bullish and Most Bearish Positions for the speculator category. Extreme positioning in these markets can foreshadow strong moves in the underlying market.

To signify an extreme position, we use the Strength Index (also known as the COT Index) of each instrument, a common method of measuring COT data. The Strength Index is simply a comparison of current trader positions against the range of positions over the previous 3 years. We use over 80 percent as extremely bullish and under 20 percent as extremely bearish. (Compare Strength Index scores across all markets in the data table or cot leaders table)


Here Are This Week’s Most Bullish Speculator Positions:

Brent Oil

Extreme Bullish Leader
The Brent Oil speculator position comes in as the most bullish extreme standing this week as the Brent speculator level is currently at a 100 percent score of its 3-year range.

The six-week trend for the percent strength score totaled a rise of 40 points this week. The overall net speculator position was a total of 13,216 net contracts this week with a rise of 2,936 contract in the weekly speculator bets.


Speculators or Non-Commercials Notes:

Speculators, classified as non-commercial traders by the CFTC, are made up of large commodity funds, hedge funds and other significant for-profit participants. The Specs are generally regarded as trend-followers in their behavior towards price action – net speculator bets and prices tend to go in the same directions. These traders often look to buy when prices are rising and sell when prices are falling. To illustrate this point, many times speculator contracts can be found at their most extremes (bullish or bearish) when prices are also close to their highest or lowest levels.

These extreme levels can be dangerous for the large speculators as the trade is most crowded, there is less trading ammunition still sitting on the sidelines to push the trend further and prices have moved a significant distance. When the trend becomes exhausted, some speculators take profits while others look to also exit positions when prices fail to continue in the same direction. This process usually plays out over many months to years and can ultimately create a reverse effect where prices start to fall and speculators start a process of selling when prices are falling.


Silver

Extreme Bullish Leader
The Silver speculator position comes in tied with Brent at the top of the extreme standings this week. The Silver speculator level is also at a 100 percent or maximum score of its 3-year range.

The six-week trend for the percent strength score was a gain of 21 points this week. The speculator position registered 66,650 net contracts this week with a weekly boost of 5,880 contracts in speculator bets.


Ultra U.S. Treasury Bonds

Extreme Bullish Leader
The Ultra U.S. Treasury Bonds speculator position comes in third this week in the extreme standings. The Ultra Long T-Bond speculator level resides at a 97 percent score of its 3-year range.

The six-week trend for the speculator strength score came in at 18 points this week. The overall speculator position was -203,747 net contracts this week with a jump of 24,696 contracts in the weekly speculator bets.


Live Cattle

Extreme Bullish Leader
The Live Cattle speculator position comes up number four in this week’s bullish extreme standings. The Live Cattle speculator level sits at a 92 percent score of its 3-year range. The six-week trend for the speculator strength score was 12 points this week.

The speculator position was 115,175 net contracts this week with a jump of 11,892 contracts in the weekly speculator bets.


Japanese Yen


The Japanese yen speculator position rounds out the top five in the extreme standings this week. The Japanese yen speculator level is at a 91 percent score of its 3-year range.

The six-week trend for the speculator strength score totaled a change of -10 points this week. The overall speculator position was 144,595 net contracts this week with a decline of -6,554 contracts in the speculator bets.


This Week’s Most Bearish Speculator Positions:

5-Year Bond

Extreme Bearish Leader
The 5-Year Bond speculator position comes in as the most bearish extreme standing this week. The 5-Year speculator level is at a 0 percent or minimum score of its 3-year range.

The six-week trend for the speculator strength score was -8 points this week. The overall speculator position was -2,470,920 net contracts this week with a drop by -74,384 contracts in the speculator bets.


Ultra 10-Year U.S. T-Note

Extreme Bearish Leader
The Ultra 10-Year U.S. T-Note speculator position comes in next for the most bearish extreme standing on the week as the speculator level is at just a 1 percent score of its 3-year range.

The six-week trend for the speculator strength score was -40 points this week. The speculator position was -369,282 net contracts this week with a small gain of 2,306 contracts in the weekly speculator bets.


3-Month Secured Overnight Financing Rate

Extreme Bearish Leader
The 3-Month Secured Overnight Financing Rate speculator position comes in as third most bearish extreme standing of the week. The SOFR 3-Months speculator level resides at a 2 percent score of its 3-year range.

The six-week trend for the speculator strength score was -29 points this week. The overall speculator position was -1,132,456 net contracts this week with a reduction by -202,389 contracts in the speculator bets.


Sugar

Extreme Bearish Leader
The Sugar speculator position comes in as this week’s fourth most bearish extreme standing. The Sugar speculator level is at a 4 percent score of its 3-year range.

The six-week trend for the speculator strength score was -19 points this week. The speculator position was -19,515 net contracts this week with a shortfall of -15,671 contracts in the weekly speculator bets.


Bitcoin

Extreme Bearish Leader
Finally, the Bitcoin speculator position comes in as the fifth most bearish extreme standing for this week. The Bitcoin speculator level is at a 7 percent score of its 3-year range.

The six-week trend for the speculator strength score was -17 points this week. The speculator position was -2,009 net contracts this week with an increase of 303 contracts in the weekly speculator bets.


Article By InvestMacroReceive our weekly COT Newsletter

*COT Report: The COT data, released weekly to the public each Friday, is updated through the most recent Tuesday (data is 3 days old) and shows a quick view of how large speculators or non-commercials (for-profit traders) were positioned in the futures markets.

The CFTC categorizes trader positions according to commercial hedgers (traders who use futures contracts for hedging as part of the business), non-commercials (large traders who speculate to realize trading profits) and nonreportable traders (usually small traders/speculators) as well as their open interest (contracts open in the market at time of reporting). See CFTC criteria here.