By JustMarkets
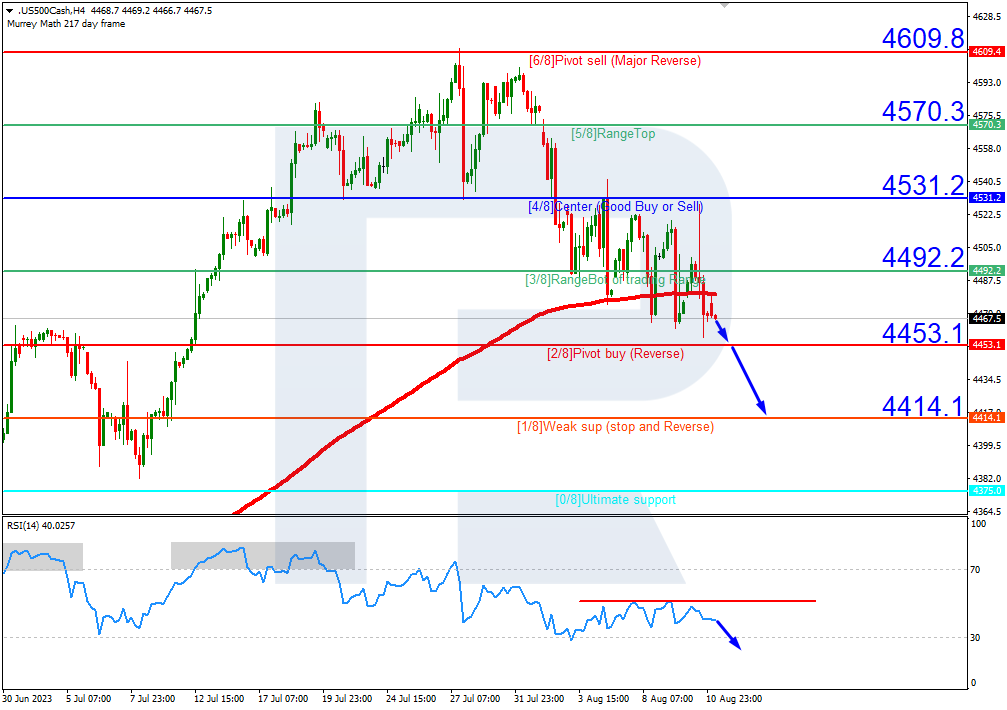
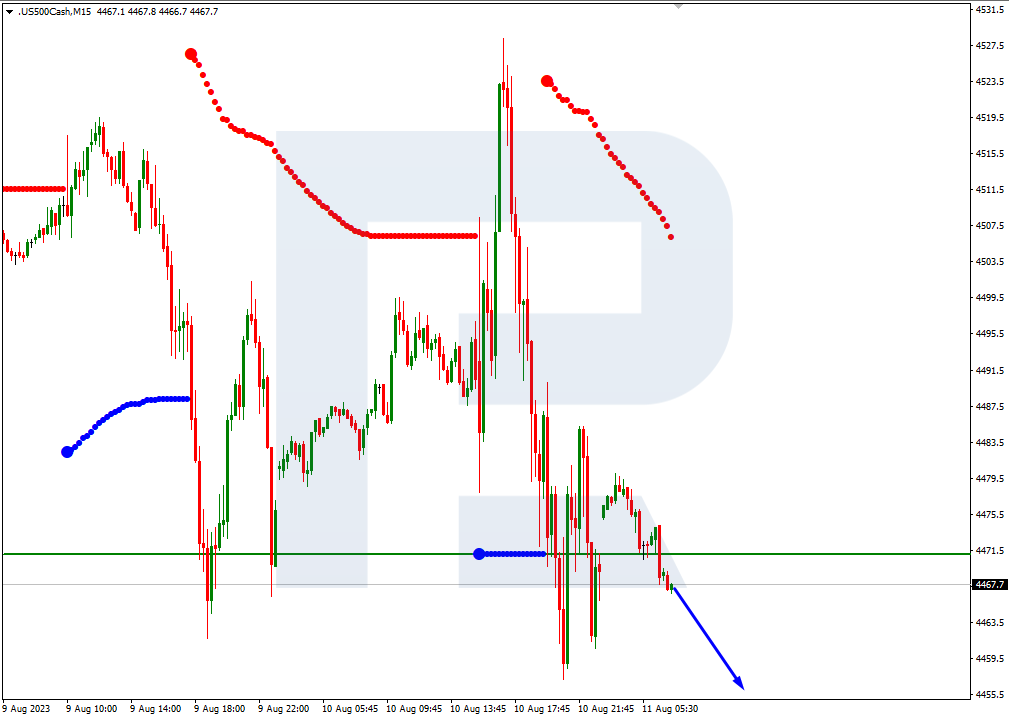
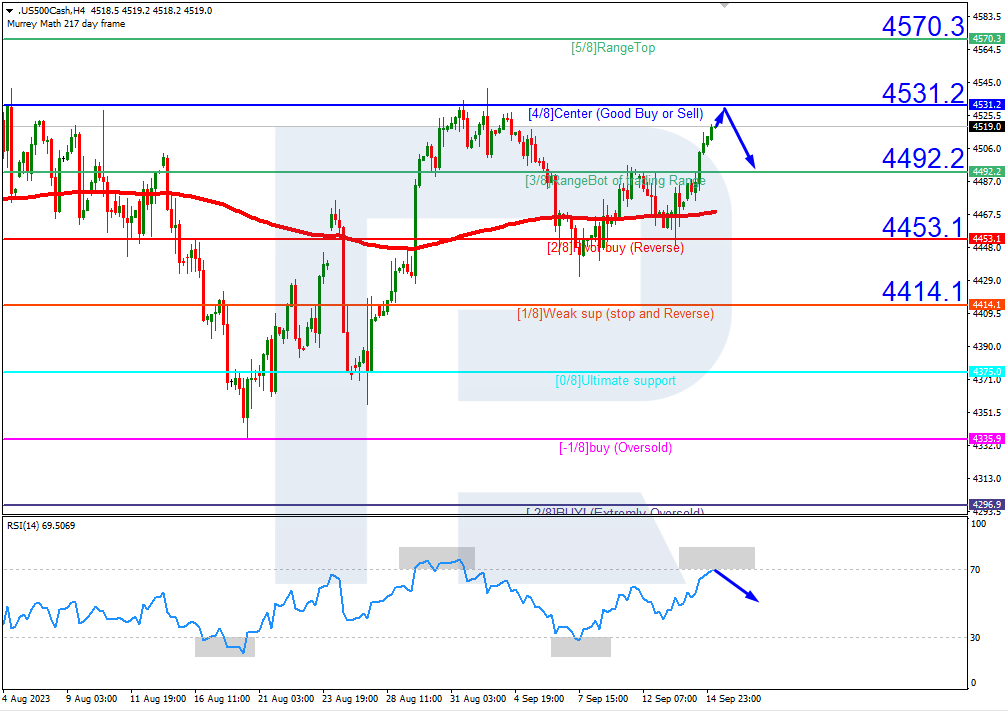
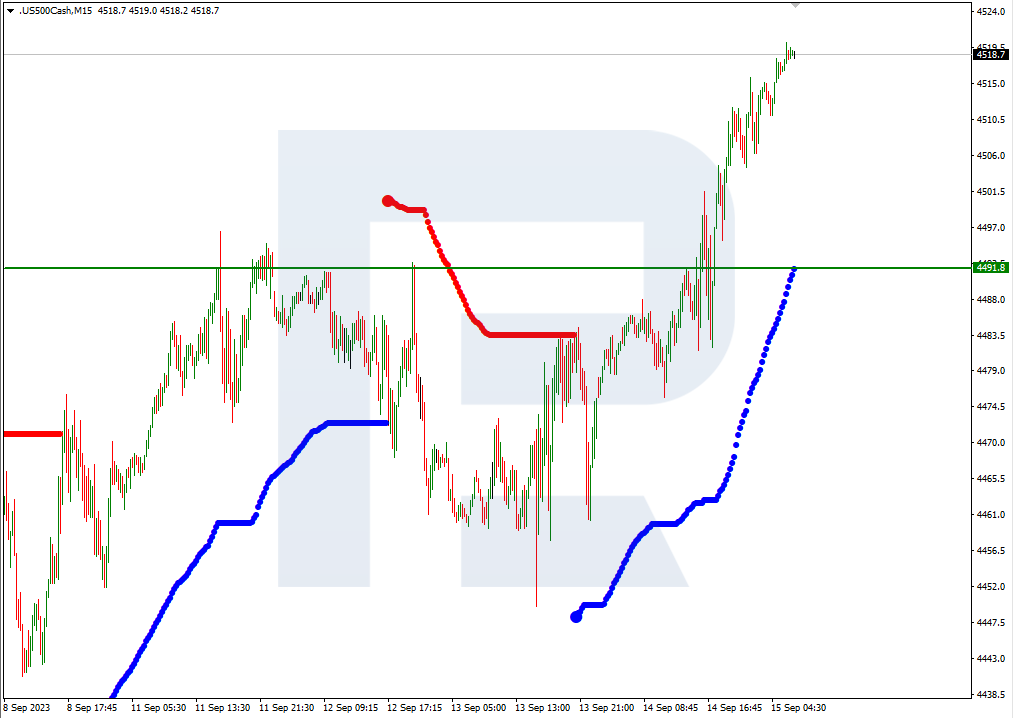
At Tuesday’s stock market close, the Dow Jones Index (US30) decreased by 0.05%, while the S&P 500 Index (US500) lost 0.57%. The NASDAQ Technology Index (US100) closed negative by 1.04%. Weakness in technology stocks had a negative impact on the overall market. For example, Oracle closed down more than 13% after reporting lower-than-expected first-quarter earnings due to a slowdown in cloud sales. According to Morgan Stanley, Oracle’s results raise questions about the timing of artificial intelligence (AI) demand turning into revenue for the company. In addition, Apple shares were down more than 1% after introducing the iPhone 15 lineup.
On the positive side, energy stocks rallied after the price of WTI crude oil rose to a near 10-month high. In addition, shares of several regional banks rose after an upbeat outlook at the Barclays Global Financial Services Conference.
The US financial markets are awaiting the release of consumer price data on Wednesday. Economists’ median estimate is that the pace of growth in the consumer price index will accelerate to 3.6% y/y in August, although the core reading, which excludes food and energy costs, will fall to 4.3% y/y. On a month-on-month basis, however, overall CPI is forecast to rise 0.6%, which would be the biggest jump since inflation peaked in June 2022. If the data matches expectations, it will increase the likelihood of a US Fed rate hike at the November meeting and support the USD index. Currently, markets are pricing in a 7% chance of a 25 bps rate hike at the September 20 FOMC meeting and a 42% chance of a 25 bps hike at the November 1 FOMC meeting.
Equity markets in Europe were mostly down yesterday. Germany’s DAX (DE40) decreased by 0.54%, France’s CAC 40 (FR40) fell by 0.11% on Tuesday, Spain’s IBEX 35 (ES35) added 0.27%, and the UK’s FTSE 100 (UK100) closed up by 0.41%
The ECB meeting will take place as early as Thursday, amid much uncertainty, as price pressures in the Eurozone remain elevated and data suggests a sharp slowdown in economic activity. The latest Spanish inflation data showed that consumer prices rose to 2.6% y/y in August, influenced by higher fuel costs, up from a 2.3% y/y reading last month. The probability of the ECB raising interest rates by 25 bps at Thursday’s meeting rose to 52% from 38% a day earlier.
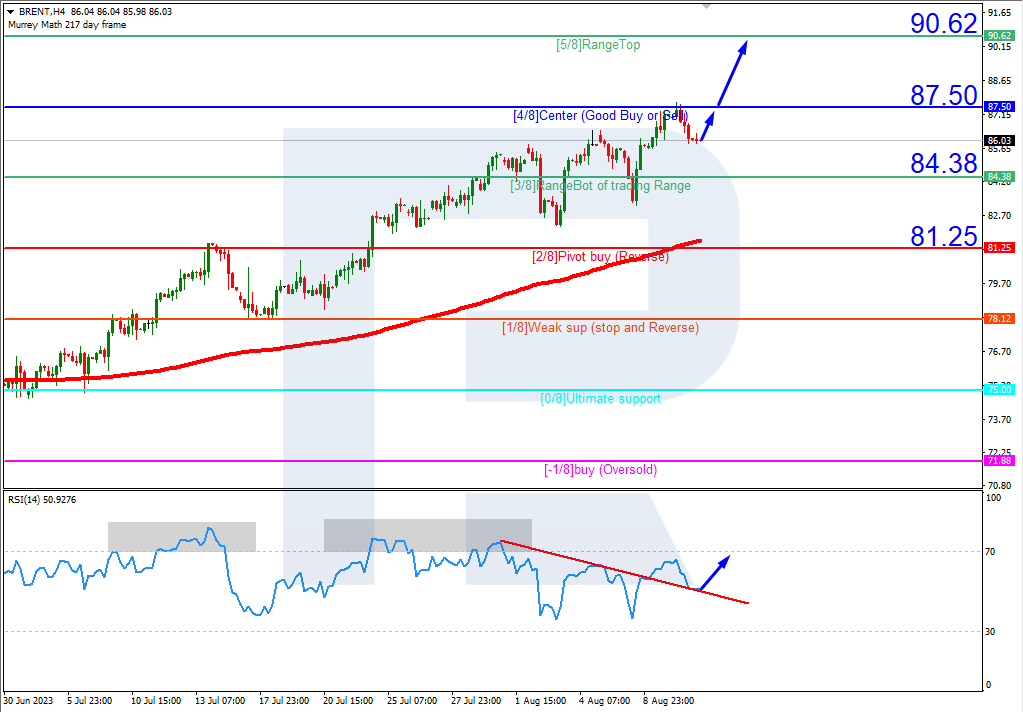
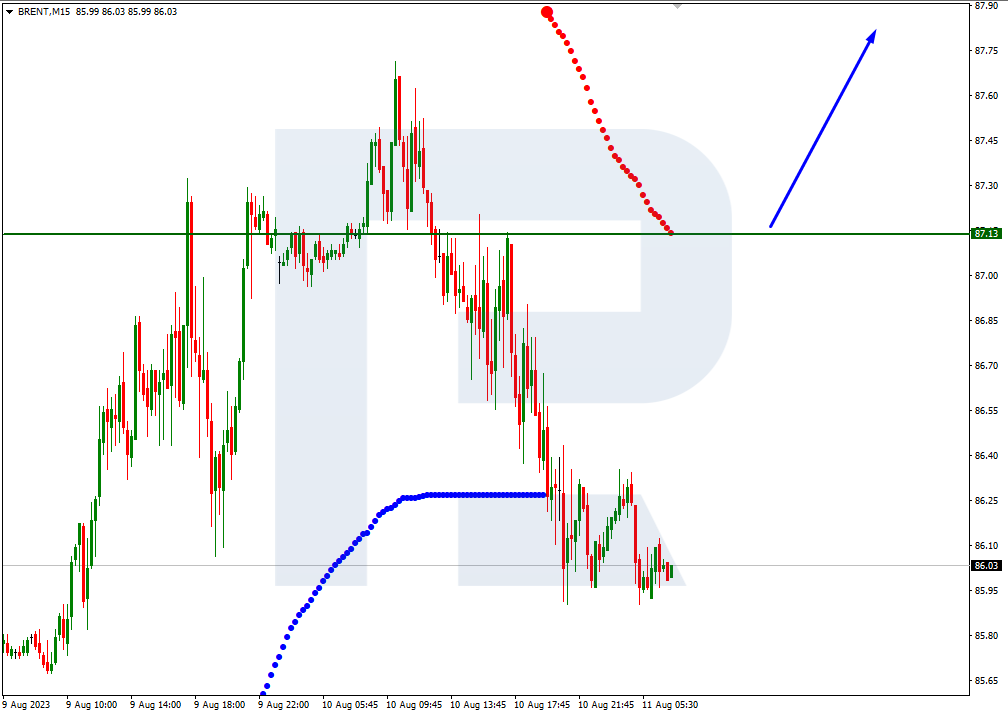
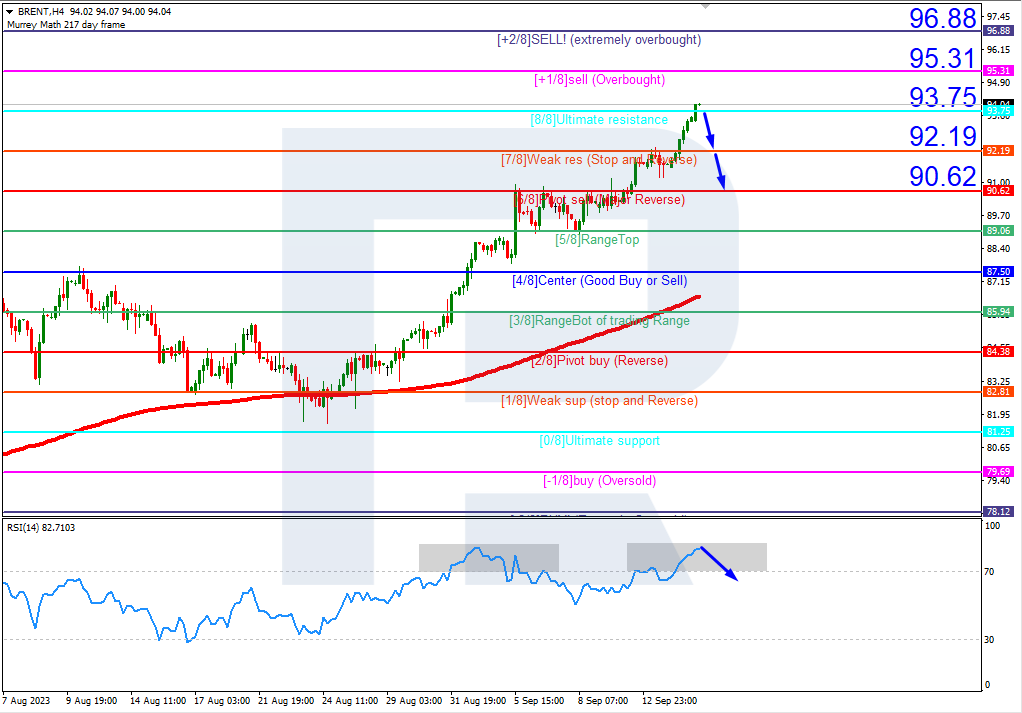
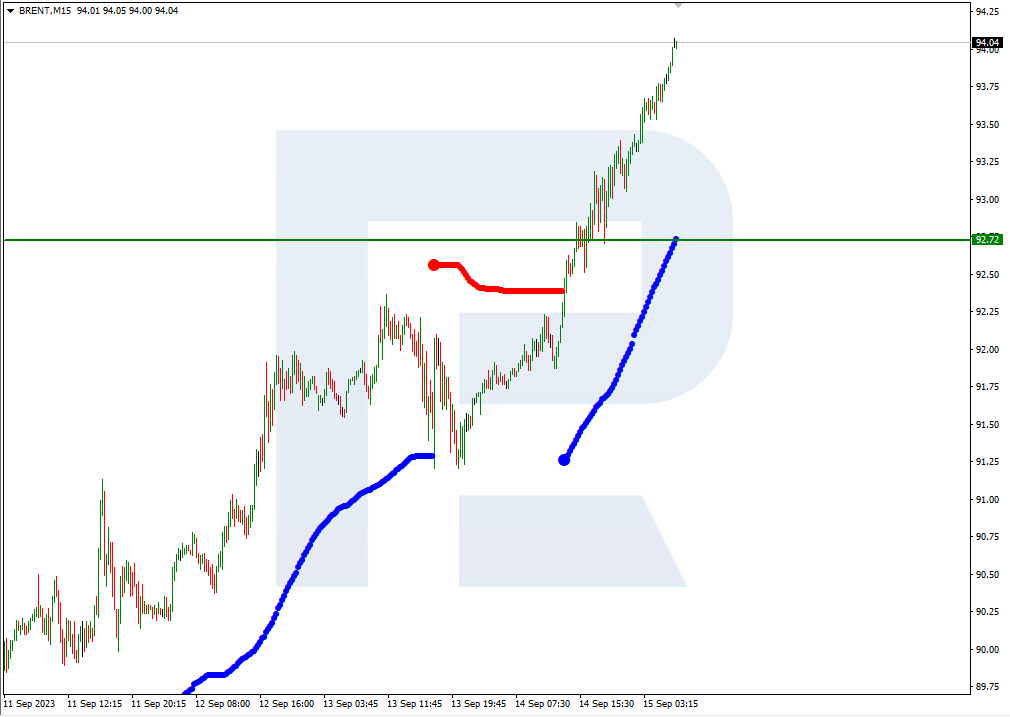
Oil rose to a near 10-month high, and gasoline rose to a 2-week high. Limited global oil supplies helped boost prices on Tuesday after OPEC’s monthly report forecast global crude inventories to fall to a 10-year low. A decline in oil in floating storage is also a bullish factor for prices. On Monday, Vortexa released weekly data showing that the volume of crude oil stored in tankers afloat for at least a week fell by 5.8% from the previous month to 81.02 million barrels as of September 8, the lowest in 9 months.
Asian markets traded flat on Tuesday. Japan’s Nikkei 225 (JP225) jumped by 0.95% yesterday, China’s FTSE China A50 (CHA50) lost 0.32%, Hong Kong’s Hang Seng (HK50) decreased by 0.39%, and Australia’s S&P/ASX 200 (AU200) was positive by 0.20% on Tuesday.
On Monday, natural gas prices received support from a rise in European gas prices to a one-week high. LNG production workers at key Chevron facilities in Australia began a partial strike last week after talks with management failed to reach an agreement. The workers said that if no agreement is reached, they will completely stop work for two weeks starting this Thursday.
Sentiment towards China remains largely negative as a raft of economic indicators for August painted a weak picture of Asia’s largest economy. Added to this was Beijing’s slow rollout of additional stimulus measures.
Bank of Japan (BoJ) watchers shifted their forecasts for an end to negative interest rates after Bank Governor Kazuo Ueda touched on the possibility in an interview published over the weekend. Most economists believe that the BoJ will stick to its previous policy at next week’s BoJ board meeting, with the authorities predicted to abandon negative interest rates by the end of June next year.
S&P 500 (F)(US500) 4,461.90 −25.56 (−0.57%)
Dow Jones (US30) 34,645.99 −17.73 (−0.051%)
DAX (DE40) 15,715.53 −85.46 (−0.54%)
FTSE 100 (UK100) 7,527.53 +30.66 (+0.41%)
USD Index 104.54 +0.01 (+0.01%)
Important events for today:
- – Japan Producer Price Index (m/m) at 02:50 (GMT+3);
- – UK GDP (m/m) at 09:00 (GMT+3);
- – UK Industrial Production (m/m) at 09:00 (GMT+3);
- – UK Manufacturing Production (m/m) at 09:00 (GMT+3);
- – UK Trade Balance (m/m) at 09:00 (GMT+3);
- – Eurozone Industrial Production (m/m) at 12:00 (GMT+3);
- – US Consumer Price Index (m/m) at 15:30 (GMT+3);
- – US Crude Oil Reserves (w/w) at 17:30 (GMT+3).
By JustMarkets
This article reflects a personal opinion and should not be interpreted as an investment advice, and/or offer, and/or a persistent request for carrying out financial transactions, and/or a guarantee, and/or a forecast of future events.


.png)
.png)