­

Archive for Energy – Page 10

Oil’s rally continues. Investors are in no hurry to intensify trading ahead of the Fed meeting

By JustMarkets

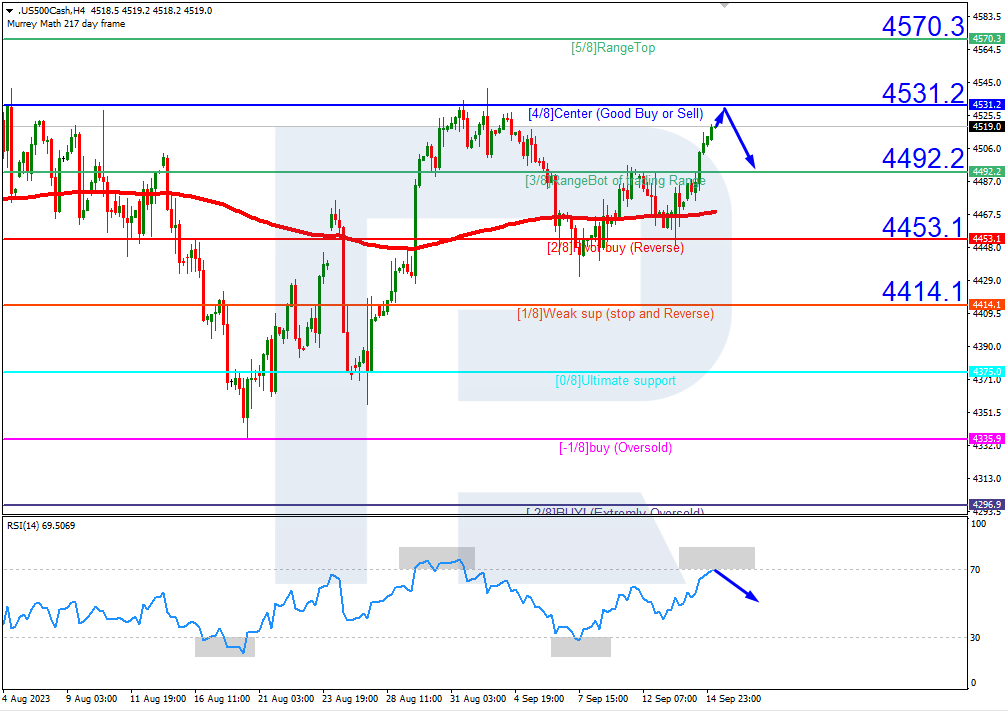
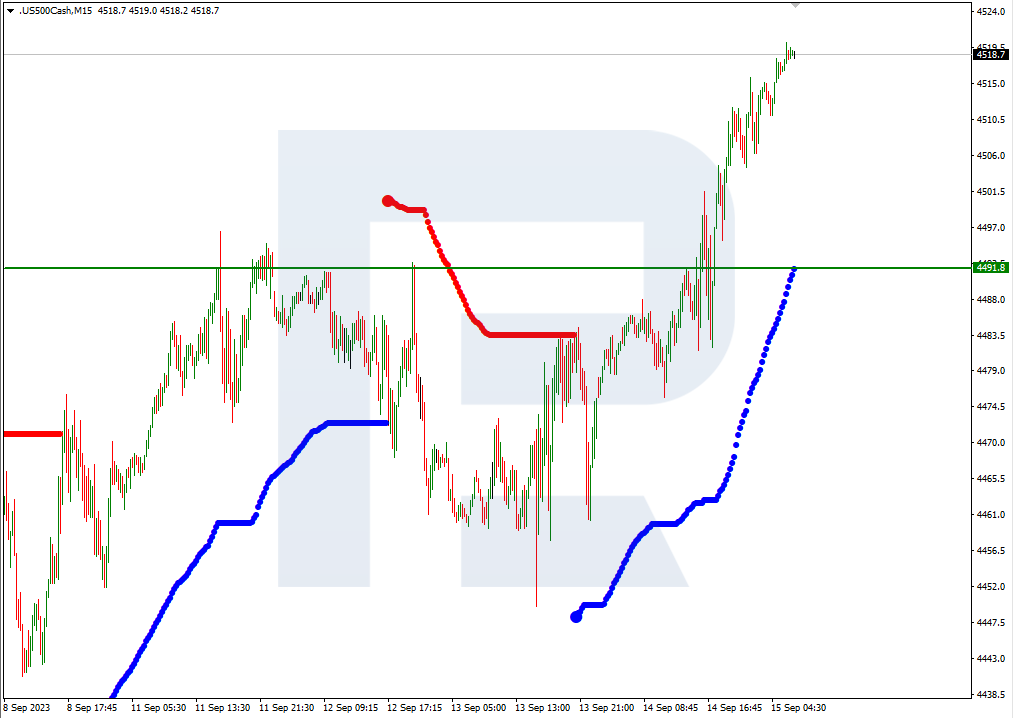
At the close of the stock exchange on Monday, the Dow Jones Index (US30) rose by 0.02%, and the S&P 500 Index (US500) increased by 0.07%. The NASDAQ Technology Index (US100) closed Monday at its opening price. Stock indices were down on Monday due to caution ahead of the two-day FOMC meeting on Tuesday and Wednesday. Markets fully expect the FOMC to leave the main rate target unchanged at 5.5% (99% probability) this week. However, the FOMC is expected to maintain a hawkish tone and remain open to one last rate hike, as inflation and the economy have not slowed enough yet.

Markets estimate the probability of the FOMC raising the rate by 25 bps at the November 1 meeting as 31%, and the probability of a 25 bps rate hike at the next meeting on December 13 is 14%. The markets then expect the FOMC to start cutting rates in 2024 in response to an expected slowdown in the US economy.

The NAHB US housing market index published on Monday fell by  5 points to a 5-month low of 45, which was much weaker than expected. The decline in confidence expressed by US homebuilders suggests that home-building activity may weaken in the coming months.

Apple (AAPL) shares jumped by 1.69% on Monday amid optimism about strong pre-orders for the latest iPhone 15 model. PayPal Holdings (PYPL) fell by 1.98% when MoffettNathanson downgraded the company to “downgrade” from “outperform” as analysts expect weak earnings growth due to increased competition.

Equity markets in Europe were mostly down yesterday. Germany’s DAX (DE40) fell by 1.05%, France’s CAC 40 (FR40) lost 1.39%, Spain’s IBEX 35 (ES35) decreased by 0.71%, and the UK’s FTSE 100 (UK100) closed negative 0.76%.

For the Eurozone, the main focus for the week ahead begins today with the inflation report, and another decline could have a negative impact on the euro but a positive impact on European indices. Eurozone and German business PMIs are expected to remain weak, although Friday’s announcement by Fitch that Germany remains under a AAA credit rating suggests a positive and stable outlook for the Eurozone’s largest economy. But overall, the US economy is much stronger right now than the Eurozone economy, and that’s evident in pricing and central bank guidance. This will likely keep the US dollar high against the euro until cracks in the US economy start to appear in the inflationary and labor environment.

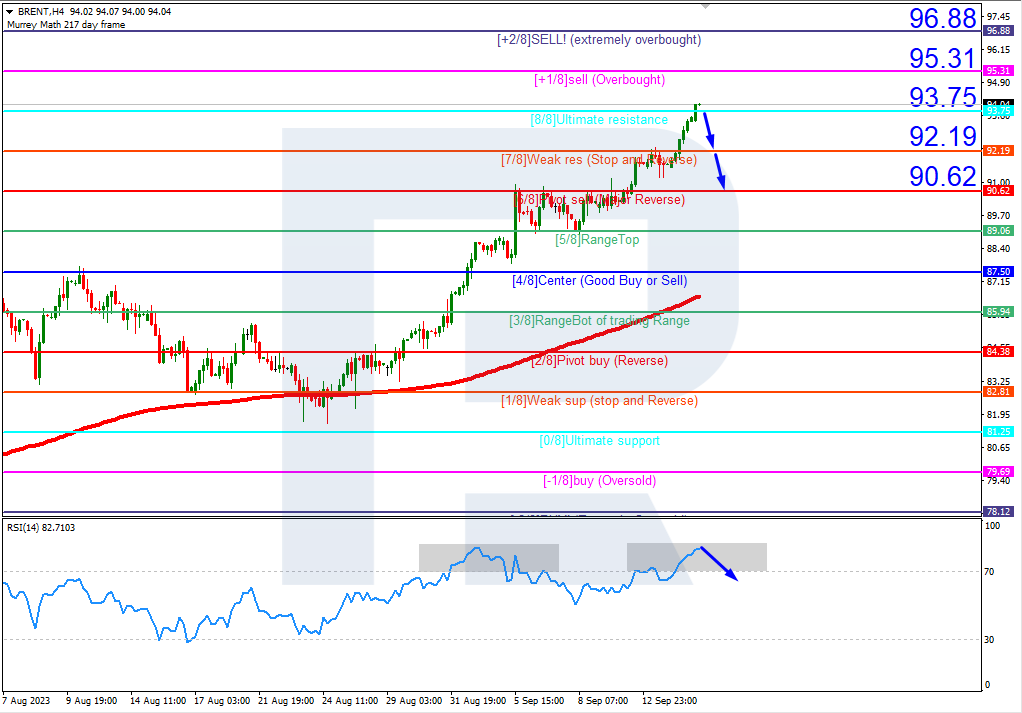
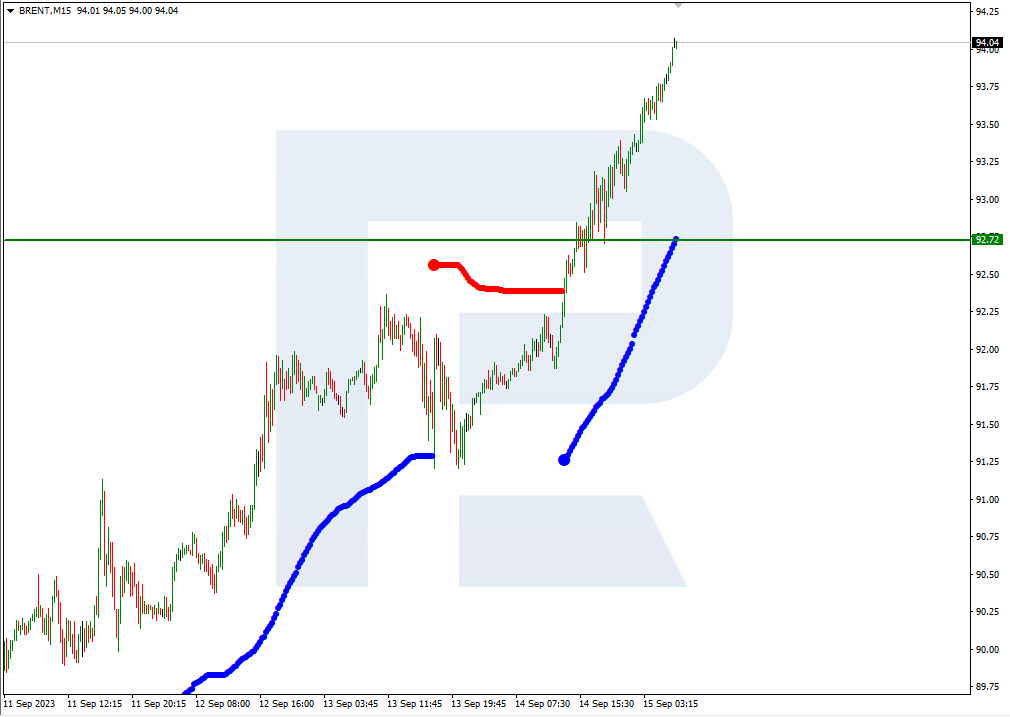
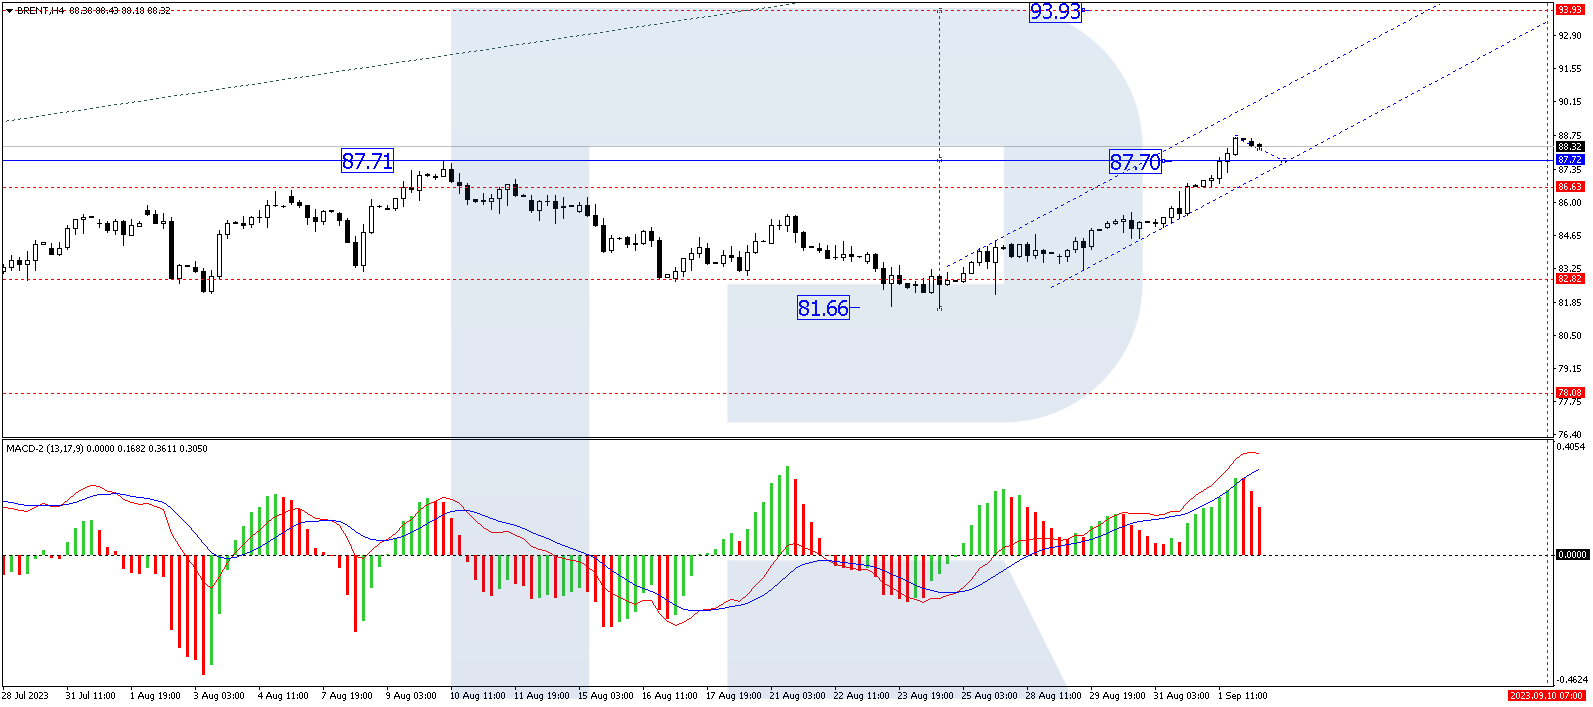
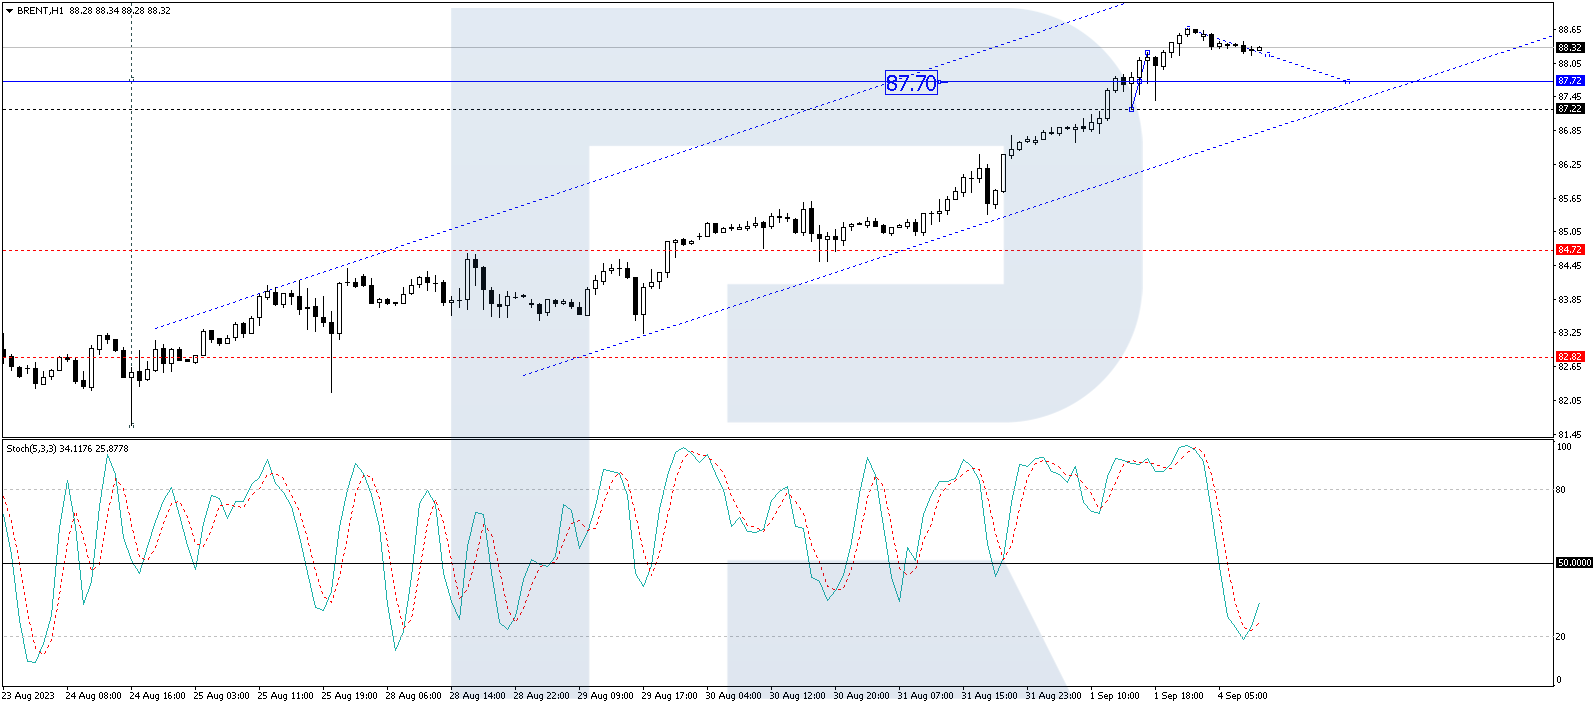
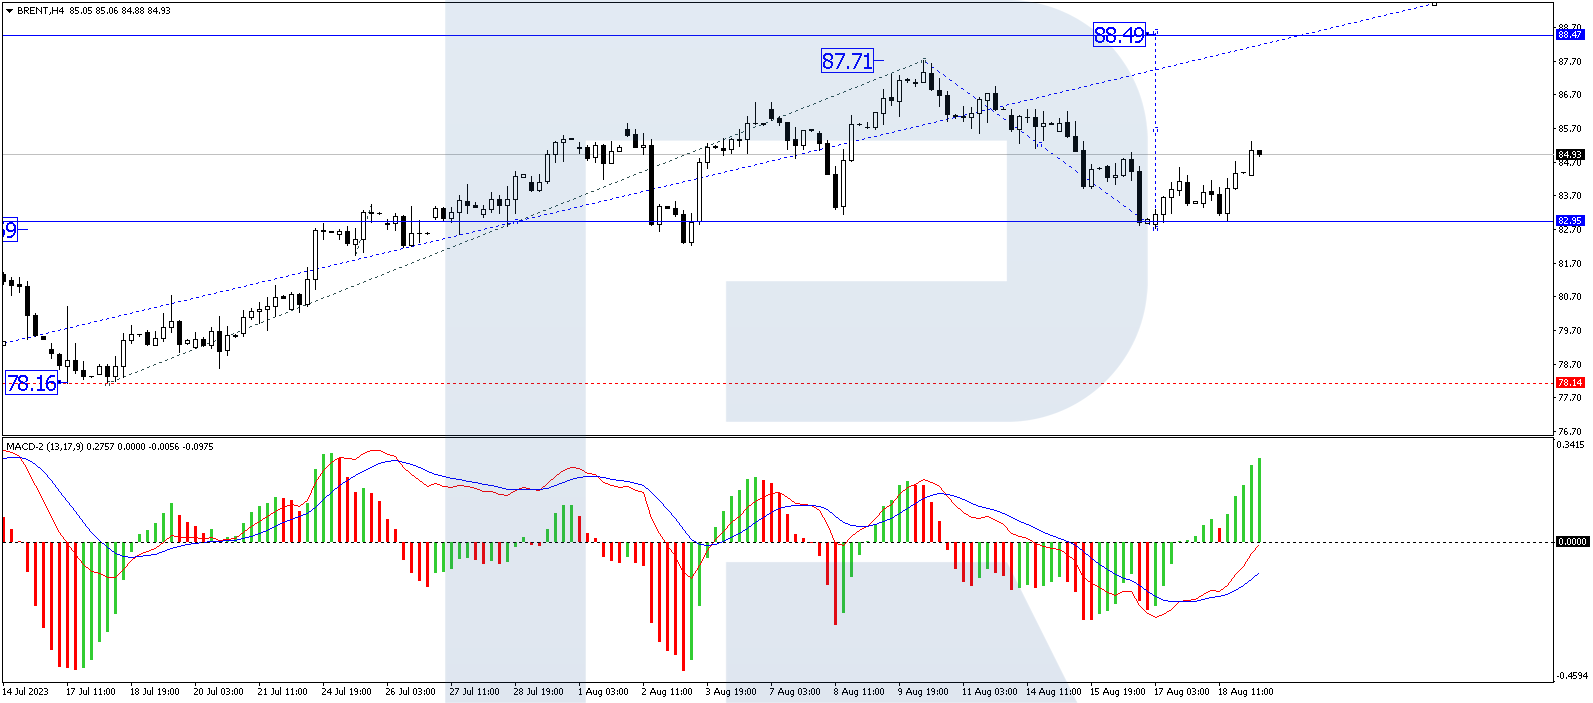
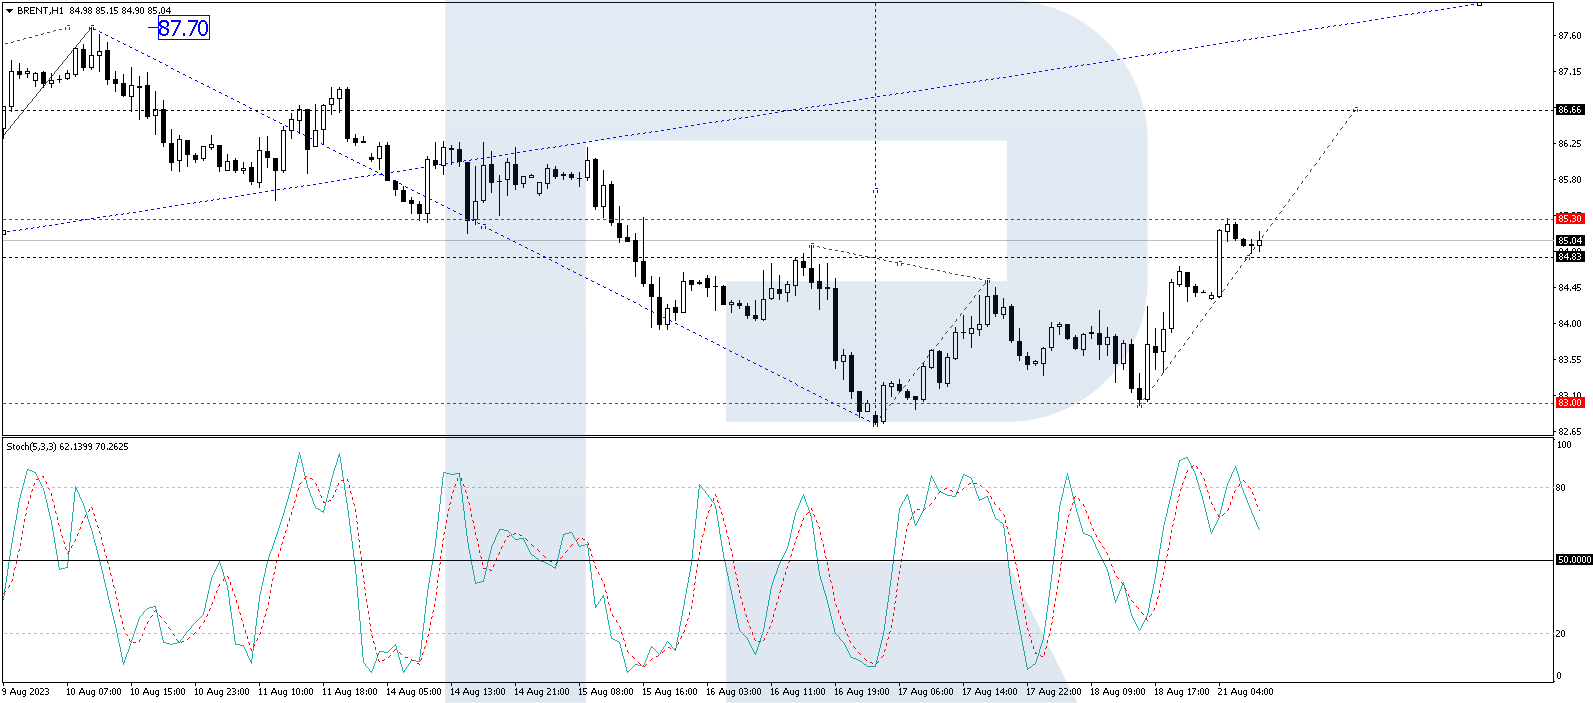
WTI crude oil prices rose to a new 11-month high on Monday, extending a rally seen over the past three months on expectations of a tight supply outlook for the rest of the year. Oil company Aramco forecasts record consumption of 103-104 million BPD in the second half of 2023. Oil prices received support from forecasts made last week by the International Energy Agency (IEA) and OPEC that the global oil market will be in deficit until the end of the year. And the bearish factors are not even enough to stop the rally yet.

Asian markets were mostly down. Japan’s Nikkei 225 was not trading yesterday, China’s FTSE China A50 (CHA50) added 0.91%, Hong Kong’s Hang Seng (HK50) decreased by 1.39% on the day, and Australia’s S&P/ASX 200 (AU200) was negative 0.67% on Monday.

The RBA’s Monetary Policy Minutes for August showed that Committee officials believe that inflation is still too high and is expected to remain so for an extended period of time. Committee representatives also noted that the previous month’s payroll data were broadly in line with the Bank’s forecasts: the labor market remains tight, but conditions are easing. The decision to maintain the interest rate at this meeting was due to the fact that interest rates have been raised significantly over a short period of time, and the effect of monetary tightening has not yet been fully realized.

S&P 500 (F)(US500) 4,453.53 +3.21 (+0.07%)

Dow Jones (US30) 34,624.30 +6.06 (+0.02%)

DAX (DE40)  15,727.12 −166.41 (−1.05%)

FTSE 100 (UK100) 7,652.94 −58.44 (−0.76%)

USD Index  105.09 −0.24 (−0.22%)

News feed for 2023.09.19:
  • – Australia RBA Meeting Minutes (m/m) at 04:30 (GMT+3);
  • – Switzerland Trade Balance (m/m) at 09:00 (GMT+3);
  • – Eurozone Consumer Price Index (m/m) at 12:00 (GMT+3);
  • – Canada Consumer Price Index (m/m) at 15:30 (GMT+3);
  • – US Building Permits (m/m) at 15:30 (GMT+3).

By JustMarkets


This article reflects a personal opinion and should not be interpreted as an investment advice, and/or offer, and/or a persistent request for carrying out financial transactions, and/or a guarantee, and/or a forecast of future events.

“Climbing Oil Prices Bearish for Stocks”? It’s a Myth!

Oil and stocks sometimes trend together. Other times, they don’t.

By Elliott Wave International

There’s a widespread belief that rising oil prices are bearish for the main stock indexes and falling oil prices are bullish for stocks.

That belief is reflected in this Sept. 5 CNBC headline:

Dow closes nearly 200 points lower as rising oil prices drag down stocks …

But wait a minute, the broad stock market rallied in July as the price of crude oil was also climbing.

Getting back to the same financial website, an Aug. 1 headline said (CNBC):

Oil joined the July stocks rally …

Going further back this year, an April 14 Barron’s headline noted:

Oil Prices and Stocks Have Rallied …

These cases here in 2023 are by no means the first time that the behavior of the oil and stock markets have defied conventional wisdom.

Here’s a chart and commentary from Robert Prechter’s landmark book, The Socionomic Theory of Finance:

The July 25, 2006 issue of The Elliott Wave Theorist offered [this chart], showing the preceding three-year market environment. Examine it and see if you can discern any indication whatsoever that lower oil prices make stocks rise or vice versa. As I said at the time, “Oil and stocks have trended mostly in the same direction for more than three years.

And, as you can see from this next chart, stocks and oil also crashed together for much of 2008 going into 2009. And then rose together — again, with crude oil tripling in value as the S&P 500 index doubled in value.

So, maybe rising oil prices do not “make” stocks fall after all (and vice versa.)

Every market has its own investor psychology that drives it. You may want to look to the Elliott wave model for a high-confidence ascertainment of the oil and stock markets independently from each other.

If you want to delve into the details of Elliott wave analysis, an ideal resource is Frost & Prechter’s book, Elliott Wave Principle: Key to Market Behavior. Here’s a quote from this Wall Street classic:

After you have acquired an Elliott “touch,” it will be forever with you, just as a child who learns to ride a bicycle never forgets. Thereafter, catching a turn becomes a fairly common experience and not really too difficult. Furthermore, by giving you a feeling of confidence as to where you are in the progress of the market, a knowledge of Elliott can prepare you psychologically for the fluctuating nature of price movement and free you from sharing the widely practiced analytical error of forever projecting today’s trends linearly into the future. Most important, the Wave Principle often indicates in advance the relative magnitude of the next period of market progress or regress.

Here’s good news: You can access the entire online version of the book for free!

The only requirement for free access is a Club EWI membership — which is also free. Club EWI is the world’s largest Elliott wave educational community with about 500,000 worldwide members.

Club EWI members enjoy complimentary access to a wealth of Elliott wave resources on financial markets, investing and trading — including videos and articles from Elliott Wave International’s analysts.

Get started by following this link: Elliott Wave Principle: Key to Market Behaviorget free and instant access.

This article was syndicated by Elliott Wave International and was originally published under the headline “Climbing Oil Prices Bearish for Stocks”? It’s a Myth!. EWI is the world’s largest market forecasting firm. Its staff of full-time analysts led by Chartered Market Technician Robert Prechter provides 24-hour-a-day market analysis to institutional and private investors around the world.

Murrey Math Lines 15.09.2023 (Brent, S&P 500)

By RoboForex.com

Brent

Brent crude oil quotes and the RSI on H4 are in their respective overbought areas. In this situation, a downward breakout of 8/8 (93.75) is expected, followed by a decline to the support at 6/8 (90.62). The scenario can be cancelled by an upward breakout of +1/8 (95.31). In this case, the quotes could aim at the resistance at +2/8 (96.88).

Brent_H4
Risk Warning: the result of previous trading operations do not guarantee the same results in the future

On M15, the lower boundary of the VoltyChannel is too far from the current price, so the decline might only be supported by a downward breakout of 8/8 (93.75) on H4.

Brent_M15
Risk Warning: the result of previous trading operations do not guarantee the same results in the future

S&P 500

On H4, the S&P 500 index quotes are above the 200-day Moving Average, indicating the prevalence of an uptrend. However, the RSI has already reached the overbought area. As a result, in these circumstances, a test of 4/8 (4531.2) is expected, followed by a rebound from this level and a decline to the support at 3/8 (4492.2). The scenario can be cancelled by rising above the resistance level of 4/8 (4453.1). In this case, the S&P 500 could continue growing and reach 5/8 (4570.3).

S&P500_H4
Risk Warning: the result of previous trading operations do not guarantee the same results in the future

On M15, the lower boundary of the VoltyChannel is too far from the current price, so the decline might only be supported by a rebound from 4/8 (4531.2) on H4.

S&P500_M15

Article By RoboForex.com

Attention!
Forecasts presented in this section only reflect the author s private opinion and should not be considered as guidance for trading. RoboForex LP bears no responsibility for trading results based on trading recommendations described in these analytical reviews.

Oil prices rose to a 10-month-high. The presentation of the new iPhone 15 lineup did not impress investors

By JustMarkets

At Tuesday’s stock market close, the Dow Jones Index (US30) decreased by 0.05%, while the S&P 500 Index (US500) lost 0.57%. The NASDAQ Technology Index (US100) closed negative by 1.04%. Weakness in technology stocks had a negative impact on the overall market. For example, Oracle closed down more than 13% after reporting lower-than-expected first-quarter earnings due to a slowdown in cloud sales. According to Morgan Stanley, Oracle’s results raise questions about the timing of artificial intelligence (AI) demand turning into revenue for the company. In addition, Apple shares were down more than 1% after introducing the iPhone 15 lineup.

On the positive side, energy stocks rallied after the price of WTI crude oil rose to a near 10-month high. In addition, shares of several regional banks rose after an upbeat outlook at the Barclays Global Financial Services Conference.

The US financial markets are awaiting the release of consumer price data on Wednesday. Economists’ median estimate is that the pace of growth in the consumer price index will accelerate to 3.6% y/y in August, although the core reading, which excludes food and energy costs, will fall to 4.3% y/y. On a month-on-month basis, however, overall CPI is forecast to rise 0.6%, which would be the biggest jump since inflation peaked in June 2022. If the data matches expectations, it will increase the likelihood of a US Fed rate hike at the November meeting and support the USD index. Currently, markets are pricing in a 7% chance of a 25 bps rate hike at the September 20 FOMC meeting and a 42% chance of a 25 bps hike at the November 1 FOMC meeting.

Equity markets in Europe were mostly down yesterday. Germany’s DAX (DE40) decreased by 0.54%, France’s CAC 40 (FR40) fell by 0.11% on Tuesday, Spain’s IBEX 35 (ES35) added 0.27%, and the UK’s FTSE 100 (UK100) closed up by 0.41%

The ECB meeting will take place as early as Thursday, amid much uncertainty, as price pressures in the Eurozone remain elevated and data suggests a sharp slowdown in economic activity. The latest Spanish inflation data showed that consumer prices rose to 2.6% y/y in August, influenced by higher fuel costs, up from a 2.3% y/y reading last month. The probability of the ECB raising interest rates by 25 bps at Thursday’s meeting rose to 52% from 38% a day earlier.

Oil rose to a near 10-month high, and gasoline rose to a 2-week high. Limited global oil supplies helped boost prices on Tuesday after OPEC’s monthly report forecast global crude inventories to fall to a 10-year low. A decline in oil in floating storage is also a bullish factor for prices. On Monday, Vortexa released weekly data showing that the volume of crude oil stored in tankers afloat for at least a week fell by 5.8% from the previous month to 81.02 million barrels as of September 8, the lowest in 9 months.

Asian markets traded flat on Tuesday. Japan’s Nikkei 225 (JP225) jumped by 0.95% yesterday, China’s FTSE China A50 (CHA50) lost 0.32%, Hong Kong’s Hang Seng (HK50) decreased by 0.39%, and Australia’s S&P/ASX 200 (AU200) was positive by 0.20% on Tuesday.

On Monday, natural gas prices received support from a rise in European gas prices to a one-week high. LNG production workers at key Chevron facilities in Australia began a partial strike last week after talks with management failed to reach an agreement. The workers said that if no agreement is reached, they will completely stop work for two weeks starting this Thursday.

Sentiment towards China remains largely negative as a raft of economic indicators for August painted a weak picture of Asia’s largest economy. Added to this was Beijing’s slow rollout of additional stimulus measures.

Bank of Japan (BoJ) watchers shifted their forecasts for an end to negative interest rates after Bank Governor Kazuo Ueda touched on the possibility in an interview published over the weekend. Most economists believe that the BoJ will stick to its previous policy at next week’s BoJ board meeting, with the authorities predicted to abandon negative interest rates by the end of June next year.

S&P 500 (F)(US500) 4,461.90 −25.56 (−0.57%)

Dow Jones (US30) 34,645.99 −17.73 (−0.051%)

DAX (DE40)  15,715.53 −85.46 (−0.54%)

FTSE 100 (UK100) 7,527.53 +30.66 (+0.41%)

USD Index  104.54 +0.01 (+0.01%)

Important events for today:
  • – Japan Producer Price Index (m/m) at 02:50 (GMT+3);
  • – UK GDP (m/m) at 09:00 (GMT+3);
  • – UK Industrial Production (m/m) at 09:00 (GMT+3);
  • – UK Manufacturing Production (m/m) at 09:00 (GMT+3);
  • – UK Trade Balance (m/m) at 09:00 (GMT+3);
  • – Eurozone Industrial Production (m/m) at 12:00 (GMT+3);
  • – US Consumer Price Index (m/m) at 15:30 (GMT+3);
  • – US Crude Oil Reserves (w/w) at 17:30 (GMT+3).

By JustMarkets


This article reflects a personal opinion and should not be interpreted as an investment advice, and/or offer, and/or a persistent request for carrying out financial transactions, and/or a guarantee, and/or a forecast of future events.

New petrol pain and global inflation fears as OPEC keeps oil curbs

By George Prior 

Petrol prices and global inflation are likely to tick higher again as the OPEC+ group of oil producing countries will hold production at nine million barrels a day for the rest of the year.

This is the stark warning from Nigel Green, the founder of deVere Group, one of the world’s largest independent financial advisory, asset management and fintech organizations, as Saudi Arabia announced it would maintain its production cut of one million barrels a day until December.

This maintains the country’s output at nine million barrels a day, the lowest amount in several years. Russia has also confirmed it would maintain its own cutback of 300,000 barrels a day for the same period.

Nigel Green comments: “OPEC+ is ramping up petrol price pain, triggering fresh and increasing concerns about rising global inflation – which was just beginning to ease – meaning central banks could possibly push higher-for-longer interest rates.”

He continues: “Restricted oil supply leads to higher oil prices, which, in turn, can contribute to higher fuel prices for consumers and businesses, putting upward pressure on overall inflation.

“Higher energy costs also lead to increased production costs for companies, which are typically passed on to consumers in the form of higher prices for goods and services, again contributing to inflationary pressures.”

Consumer behavior also plays a role. When fuel prices rise, consumers may cut back on discretionary spending, which can impact economic activity. Reduced consumer spending can influence inflation dynamics, especially in sectors heavily dependent on consumer demand.

“This move by OPEC+ will, of course, be considered by central banks when formulating monetary policy.

“If rising oil prices are expected to have a sustained impact on inflation, central banks can be expected to maintain higher interest rates for longer to control soaring prices.”

The deVere Group founder concludes: “The decision by the group of oil producing countries will further exacerbate the cost-of-living and cost-of-business crisis as inflation is given another global boost.”

About:

deVere Group is one of the world’s largest independent advisors of specialist global financial solutions to international, local mass affluent, and high-net-worth clients.  It has a network of offices across the world, over 80,000 clients and $12bn under advisement.

Trade Of The Week: Are Oil Bulls Back In Town?

By ForexTime 

Oil prices have hijacked our attention after surging to their highest level since November 2022!

The global commodity rallied over 7% last week after Russia announced that it will extend export curbs, with other supply and demand factors complementing upside gains.

Given how WTI crude simply cut through key weekly resistance like a hot knife through butter, bulls could be back in town. Taking a quick look at the technical picture, the trend is turning bullish with another potential breakout on the horizon.

Here are 3 reasons why oil could extend gains in September:

  1. Signs of tight supply

Oil bulls continue to draw ample strength from the prospect of tightening crude supply thanks to production cuts from Saudi Arabia and Russia.

  • Russia, the world’s second-largest oil exporter has announced curbs will be extended in October – with more details of the reductions to be unveiled in the coming days. It is worth keeping in mind that Russia has already cut production by 500,000 bpd in August and will cut exports by 300,000 bpd in September in an effort to ensure market stability.
  • Saudi Arabia, the de-facto leader of OPEC is widely expected to take a similar action by also extending its voluntary 1 million bpd oil production cut into October, even as oil prices push higher.

Should these curb extensions become a reality, this could keep oil bulls in the driving seat – leading to higher prices.

  1. Energy demand optimism

China’s recent efforts to bolster economic growth coupled with growing speculation around the Fed ending its aggressive hiking campaign bodes well for the demand outlook.

  • China has been plastered in the headlines after rolling out new measures of stimulus measures to stimulate its economy, as investor concerns over the growth outlook persist. This development has somewhat boosted sentiment towards the world’s largest energy consumer, lifting optimism over rising demand.
  • Last Friday’s mixed US jobs report supported expectations around the Federal Reserve already ending its aggressive hiking cycle. Should this become a reality, it could be a welcome development for oil as lower interest rates support economic growth – translating to higher demand for oil.
  1. Bullish technical forces

After bouncing within a wide range since November 2022, WTI Crude experienced a solid breakout above the $83.70 resistance level last week.

Oil seems to be gaining positive momentum on the daily charts with prices trading above the 50,100 and 200-day SMA. There have been consistently higher highs and higher lows while the MACD trades above zero.

  • Bulls remain in a position of power and could push the global commodity higher if a solid breakout above $86 is secured.
  • Beyond this level, the next key points of interest can be found at $89.50 and $93 – a level not seen since August 2022.
  • A decline back below $83.70 may trigger a selloff towards $83. If this level is breached, bears may target the 50-day SMA around $78.50.


Forex-Time-LogoArticle by ForexTime

ForexTime Ltd (FXTM) is an award winning international online forex broker regulated by CySEC 185/12 www.forextime.com

Brent Oil on an Upward Trajectory: A Comprehensive Overview

By RoboForex Analytical Department

The price of Brent crude oil is showing positive momentum, stabilizing at approximately $88.57 per barrel as of Monday. The market sentiment is predominantly bullish.

This upward trend is supported by encouraging economic data from both China and the United States. Specifically, China’s business activity outperformed expectations in August, lending some optimism to projections for oil demand. However, it’s worth noting that the strength of the U.S. dollar could act as a moderating factor on crude oil price gains.

In terms of supply, Baker Hughes’ recent statistics reveal that the count of active oil rigs in the U.S. remains stable at 512 units. Meanwhile, Canada saw a minor decline, with one rig going offline, bringing its total to 114 units.

Technical Analysis of Brent Oil

On the 4-hour chart for Brent, the price trajectory suggests robust growth. This upward movement can be interpreted as targeting a level of $93.93. Once this price target is achieved, a price correction to $87.70 is anticipated, potentially accompanied by a retest from above. Subsequently, analysts expect the price to climb to the initial target of $104.00. The Moving Average Convergence Divergence (MACD) indicator corroborates this outlook, with its signal line directed sharply upward, indicating the possibility of reaching new highs.

On the 1-hour chart, Brent has already seen a surge to $87.70, and a consolidation pattern has emerged around this price point. A breakout above this level has set the stage for an extension to $90.00, from where the upward trend could potentially continue to $93.93. The Stochastic oscillator lends technical support to this scenario; its signal line has bounced off the 20-point level and is advancing toward 50. Should it surpass this level, further upward movement to 80 is highly likely.

In summary, both short-term and medium-term technical indicators suggest that Brent oil prices are poised for further gains, although external economic factors could introduce some volatility.

Disclaimer

Any forecasts contained herein are based on the author’s particular opinion. This analysis may not be treated as trading advice. RoboForex bears no responsibility for trading results based on trading recommendations and reviews contained herein.

Will the fallout from Prigozhin ‘plane crash’ hit oil prices?

By George Prior

Oil prices are likely to become volatile amid the fallout from the alleged killing of Wagner boss Yevgeny Prigozhin in a plane crash that is reported to be on the orders of Russian President, Vladimir Putin.

The assessment from Nigel Green, CEO of deVere Group, one of the world’s largest independent financial advisory, asset management and fintech organizations, comes as Russian aviation authorities say Prigozhin, the leader of the infamous mercenary group who was denounced as a traitor by Putin following an attempted coup 60 days ago, was among 10 people killed in a plane crash near Moscow on Wednesday.

“Some reports say that Wagner mercenaries can be expected to take revenge on Putin and Defence Minister Shoigu for the death of their leader. Other reports say that Prigozhin, in fact, avoided the killing and will be even more on the war path with Putin,” says Nigel Green.

“Either way, it appears the situation is becoming even more fragile and vulnerable for Vladimir Putin, at least in the short term.

“Some analysts are even warning that this situation could ultimately lead to his downfall and potentially lead to civil war and/or the possible fragmentation of Russia.”

He continues: “A weakening of Vladimir Putin’s stronghold on power could potentially have an impact, albeit not directly, on oil prices as his influence is closely tied to Russia’s oil production and its geopolitical positioning.

“A power struggle or political instability in Russia will introduce uncertainty to global oil markets.

“Geopolitical tensions, disruptions in oil supply routes, or military conflicts, will cause temporary supply disruptions and drive oil price volatility.”

The deVere CEO says oil prices are “particularly vulnerable” right now to the Prigozhin news as the market is “concerned about the pace of China’s economic growth” and as investors monitor the Jackson Hole Federal Reserve meeting which starts Thursday, which “could provide more hints as to whether interest rates will remain higher for longer.”

He concludes: “The situation is looking precarious on many levels for Putin, and we expect that this will contribute to short-term turbulence in the price of oil.

“Oil prices have a substantial influence on wider financial markets due to their far-reaching impact on economies, industries, and consumer behaviours.”

About:

deVere Group is one of the world’s largest independent advisors of specialist global financial solutions to international, local mass affluent, and high-net-worth clients.  It has a network of offices across the world, over 80,000 clients and $12bn under advisement.

Can “golden cross” save Brent bulls?

By ForexTime

  • Brent’s 50-day SMA could soon cross above 200-day counterpart
  • However, other forces may negate bullish “golden cross” signal
  • Oil weighed down by risk of higher Venezuela/Iran supplies
  • Oil dropped on technical pullback, deteriorating China economy
  • Brent may yet return into sub-$80/bbl levels, while $88 offers strong resistance


Brent’s 50-day simple moving average (SMA) is currently teasing its 200-day counterpart.

Prices of the global oil benchmark are climbing at the time of writing as Brent tries to halt three straight days of declines.

Traders typically see a bullish signal (a sign that prices will go higher) when the 50-day SMA crosses above the 200-day SMA to form a “golden cross”.

The last time Brent formed a “golden cross” on the daily charts was back in late-September 2020.

After that previous episode, Brent went on to soar by more than 200%, going on to peak just above $130/bbl following Russia’s invasion of Ukraine.


However, there are other forces at play that may offset a bullish signal from a “golden cross”.


Here are 4 reasons why oil prices have been falling of late:

1) US-Venezuela talks

The US is discussing with Venezuela about possibly lifting sanctions on the latter’s oil exports temporarily.

Keep in mind that Venezuela boasts of the largest crude oil reserves in the world (though its refining capabilities are limited).

Should these sanctions be lifted, it risks sending out more crude oil into the world.

NOTE: Greater supply tends to translate into lower prices, all else equal.

The Biden administration is dangling this carrot so that Venezuela would hold fair elections in 2024, while lower prices at the pump would also placate the US voter base.


2) Iran’s exports surge

Iranian oil, which is sanctioned, has been making its way into China at the highest level in about a decade!

When China, as the world’s largest crude importer, is taking in such shipments, it lessens the need for China to buy oil from other producers, prompting depressed global oil prices.


3) China’s waning recovery

Much has already been made about China’s stuttering economy, as wary consumers have heaped more pressure on China’s property sector, which in turn risk financial instability.

Oil markets are concerned about the sluggish demand levels in the world’s second largest economy, and also the world’s largest crude importer, which has led to falling oil prices.

NOTE: Lower demand tends to lead to lower prices, all else equal.


4) Technical pullback

Brent bulls could do no better than the $88/bbl handle earlier this month, which makes sense given that that price region has capped Brent since last November.

That peak also saw Brent’s 14-day relative strength index (RSI) – another widely used technical indicator – breaking into “overbought” territory.

That technical event signalled that Brent was indeed ripe for a pullback, and it duly did (see chart above).


Brent looks past positive catalysts

The above factors even prompted oil markets to shrug off signs that oil inventories worldwide are around a 6-year low.

Also, the Energy Information Administration (EIA) this week reported a larger-than-expected 6.1 million barrel drawdown in US inventories to reach its lowest levels since December!


Where to next for Brent?

From a fundamental perspective, of course it boils down to the supply-demand equation.


Further declines in Brent prices may prompt Saudi Arabia and Russia to further crimp their oil shipments.

Such supply cuts may then shore up Brent price and help them stay close to the $88.00 resistance zone.


However, Brent may languish back in sub-$80/bbl levels if the Chinese economy continues to produce worrying signs, coupled with the risk of more oil supplies out of Venezuela and Iran to offset Saudi/Russia’s lowered shipments.

If further declines aren’t thwarted at the 50-day and 200-day SMAs, then the 100-day SMA may then be called for support just below the psychologically-important $80/bbl mark over the near term.


Forex-Time-LogoArticle by ForexTime

ForexTime Ltd (FXTM) is an award winning international online forex broker regulated by CySEC 185/12 www.forextime.com

The crude oil finds stability amidst price recovery

By RoboForex Analytical Department

The commodity market has stabilised as the new week begins. The price of a barrel of Brent is hovering around 85.40 USD.

The price recovery is observed for the third consecutive day. Market expectations are tied to China: there are reasons to believe that the Chinese authorities will implement additional measures in their stimulus-driven economic policy.

Meanwhile, market players continue to exercise caution. The Federal Reserve System recently announced its readiness to continue tightening its monetary policy to combat inflation. At the same time, the economic outlook for China remains uncertain.

Technical analysis of Spot Brent Crude Oil:

On the H4 Brent chart, the price has rebounded from the support level and is now developing an ascending wave to 88.50. This is a local target. After the price reaches it, a link of declining correction to 85.75 might follow (with a test from above). Next thing, a rise to 94.50 could be expected. Technically, this scenario is confirmed by the MACD, whose signal line has left the histogram area and is aimed strictly upwards.

On the H1 Brent chart, a structure of an impulse to rise to 85.30 has formed. Today a narrow consolidation range is expected to develop below it. An escape from the range upwards might facilitate the development of a wave to 86.66, from where the trend could continue to 88.50. Technically, this scenario is confirmed by the Stochastic oscillator with the signal line under 80, ready to renew the highs.

Disclaimer

Any predictions contained herein are based on the author’s particular opinion. This analysis shall not be treated as trading advice. RoboForex shall not be held liable for the results of the trades arising from relying upon trading recommendations and reviews contained herein.