Storm-chasing for science can be exciting and stressful – we know, because we do it. It has also been essential for developing today’s understanding of how tornadoes form and how they behave.
In 1996, the movie “Twister” with Helen Hunt brought storm-chasing scientists into the public imagination and inspired a generation of atmospheric scientists.
With the new “Twisters” movie hitting theaters, we’ve been getting questions about storm-chasing – or storm intercepts, as we call them.
Here are some answers about what scientists who do this kind of fieldwork are really up to when they race off after storms.
Scientists with the National Severe Storms Lab ‘intercepted’ this tornado to collect data using mobile radar and other instruments on May 24, 2024. National Severe Storms Lab
What does a day of storm-chasing really look like?
Our goal is to figure out where tornadoes are most likely to occur that day. Temperature, moisture and winds, and how these change with height above the ground, all provide clues.
There is a “hurry up and wait” cadence to a storm chase day. We want to get into position quickly, but then we’re often waiting for storms to develop.
A ‘hook echo’ on radar, typically a curl at the back of a storm cell, is one sign that a tornado could form. The hook reflects precipitation wrapping around the back side of the updraft. National Severe Storms Lab
Storms often take time to develop before they’re capable of producing tornadoes. So we watch the storm carefully on radar and with our eyes, if possible, staying well ahead of it until it matures. Often, we’ll watch multiple storms and look for signs that one might be more likely to generate tornadoes.
Once the mission scientist declares a deployment, everyone scrambles to get into position.
We use a lot of different instruments to track and measure tornadoes, and there is an art to determining when to deploy them. Too early, and the tornado might not form where the instruments are. Too late, and we’ve missed it. Each instrument needs to be in a specific location relative to the tornado. Some need to be deployed well ahead of the storm and then stay stationary. Others are car-mounted and are driven back and forth within the storm.
Vehicle-mounted equipment can act as mobile weather stations known as mesonets. These were used in the VORTEX2 research project. Dozens of scientists, including the authors, succeeded in recording the entire life cycle of a supercell tornado during VORTEX2 in 2009. Yvette Richardson
If all goes well, team members will be concentrating on the data coming in. Some will be launching weather balloons at various distances from the tornado, while others will be placing “pods” containing weather instruments directly in the path of the tornado.
A whole network of observing stations will have been set up across the storm, with radars collecting data from multiple angles, photographers capturing the storm from multiple angles, and instrumented vehicles transecting key areas of the storm.
Not all of our work is focused on the tornado itself. We often target areas around the tornado or within other parts of the storm to understand how the rotation forms. Theories suggest that this rotation can be generated by temperature variations within the storm’s precipitation region, potentially many miles from where the tornado forms.
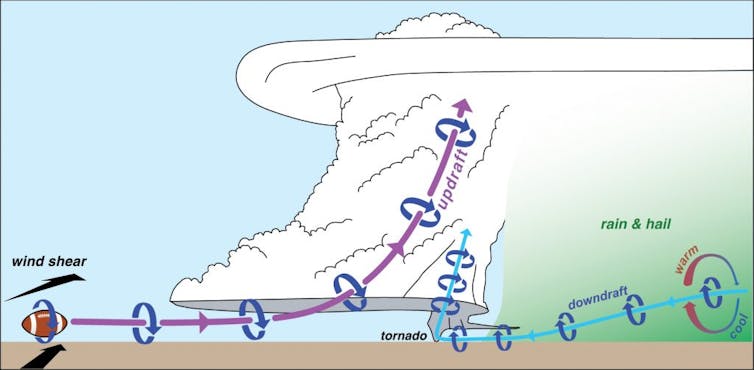
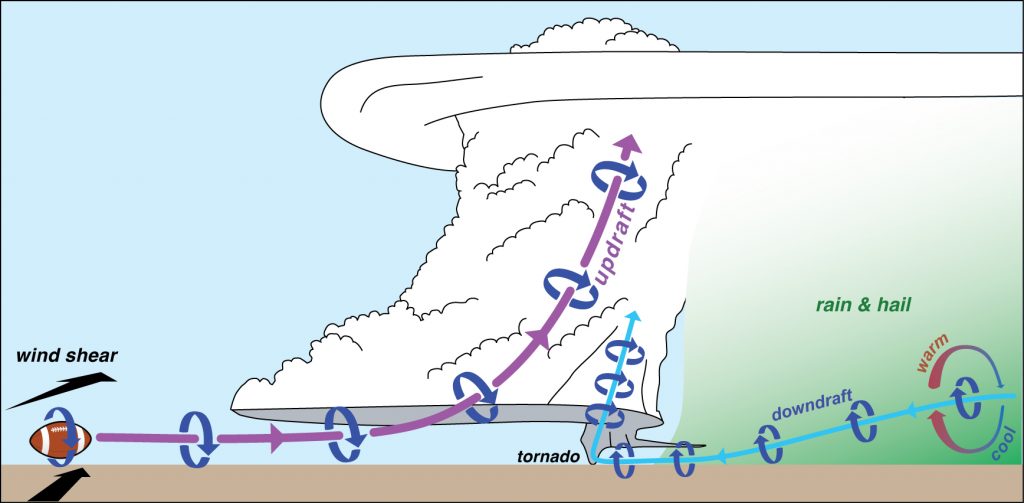
Formation of a tornado: Changes in wind speed and direction with altitude, known as wind shear, are associated with horizontal spin, similar to that of a football. As this spinning air is drawn into the storm’s updraft, the updraft rotates. A separate air stream descends through a precipitation-driven downdraft and acquires horizontal spin because of temperature differences along the air stream. This spinning air can be tilted into the vertical and sucked upward by the supercell’s updraft, contracting the spin near the ground into a tornado. Paul Markowski/Penn State
Through all of this, the teams stay in contact using text messages and software that allows us to see everyone’s position relative to the latest radar images. We’re also watching the forecast for the next day so we can plan where to go next and find hotel rooms and, hopefully, a late dinner.
What do all those instruments tell you about the storm?
One of the most important tools of storm-chasing is weather radar. It captures what’s happening with precipitation and winds above the ground.
We use several types of radars, typically attached to trucks so we can move fast. Some transmit with a longer wavelength that helps us see farther into a storm, but at the cost of a broader width to their beam, resulting in a fuzzier picture. They are good for collecting data across the entire storm.
Smaller-wavelength radars cannot penetrate as far into the precipitation, but they do offer the high-resolution view necessary to capture small-scale phenomena like tornadoes. We put these radars closer to the developing tornado.
An inside look at some of the mobile systems and tools scientists use in storm-chasing, including how team members monitor storms in real time.
We also monitor wind, air pressure, temperature and humidity along the ground using various instruments attached to moving vehicles, or by temporarily deploying stationary arrays of these instruments ahead of the approaching storm. Some of these are meant to be hit by the tornado.
Weather balloons provide crucial data, too. Some are designed to ascend through the atmosphere and capture the conditions outside the storm. Others travel through the storm itself, measuring the important temperature variations in the rain-cooled air beneath the storm. Scientists are now using drones in the same way in parts of the storm.
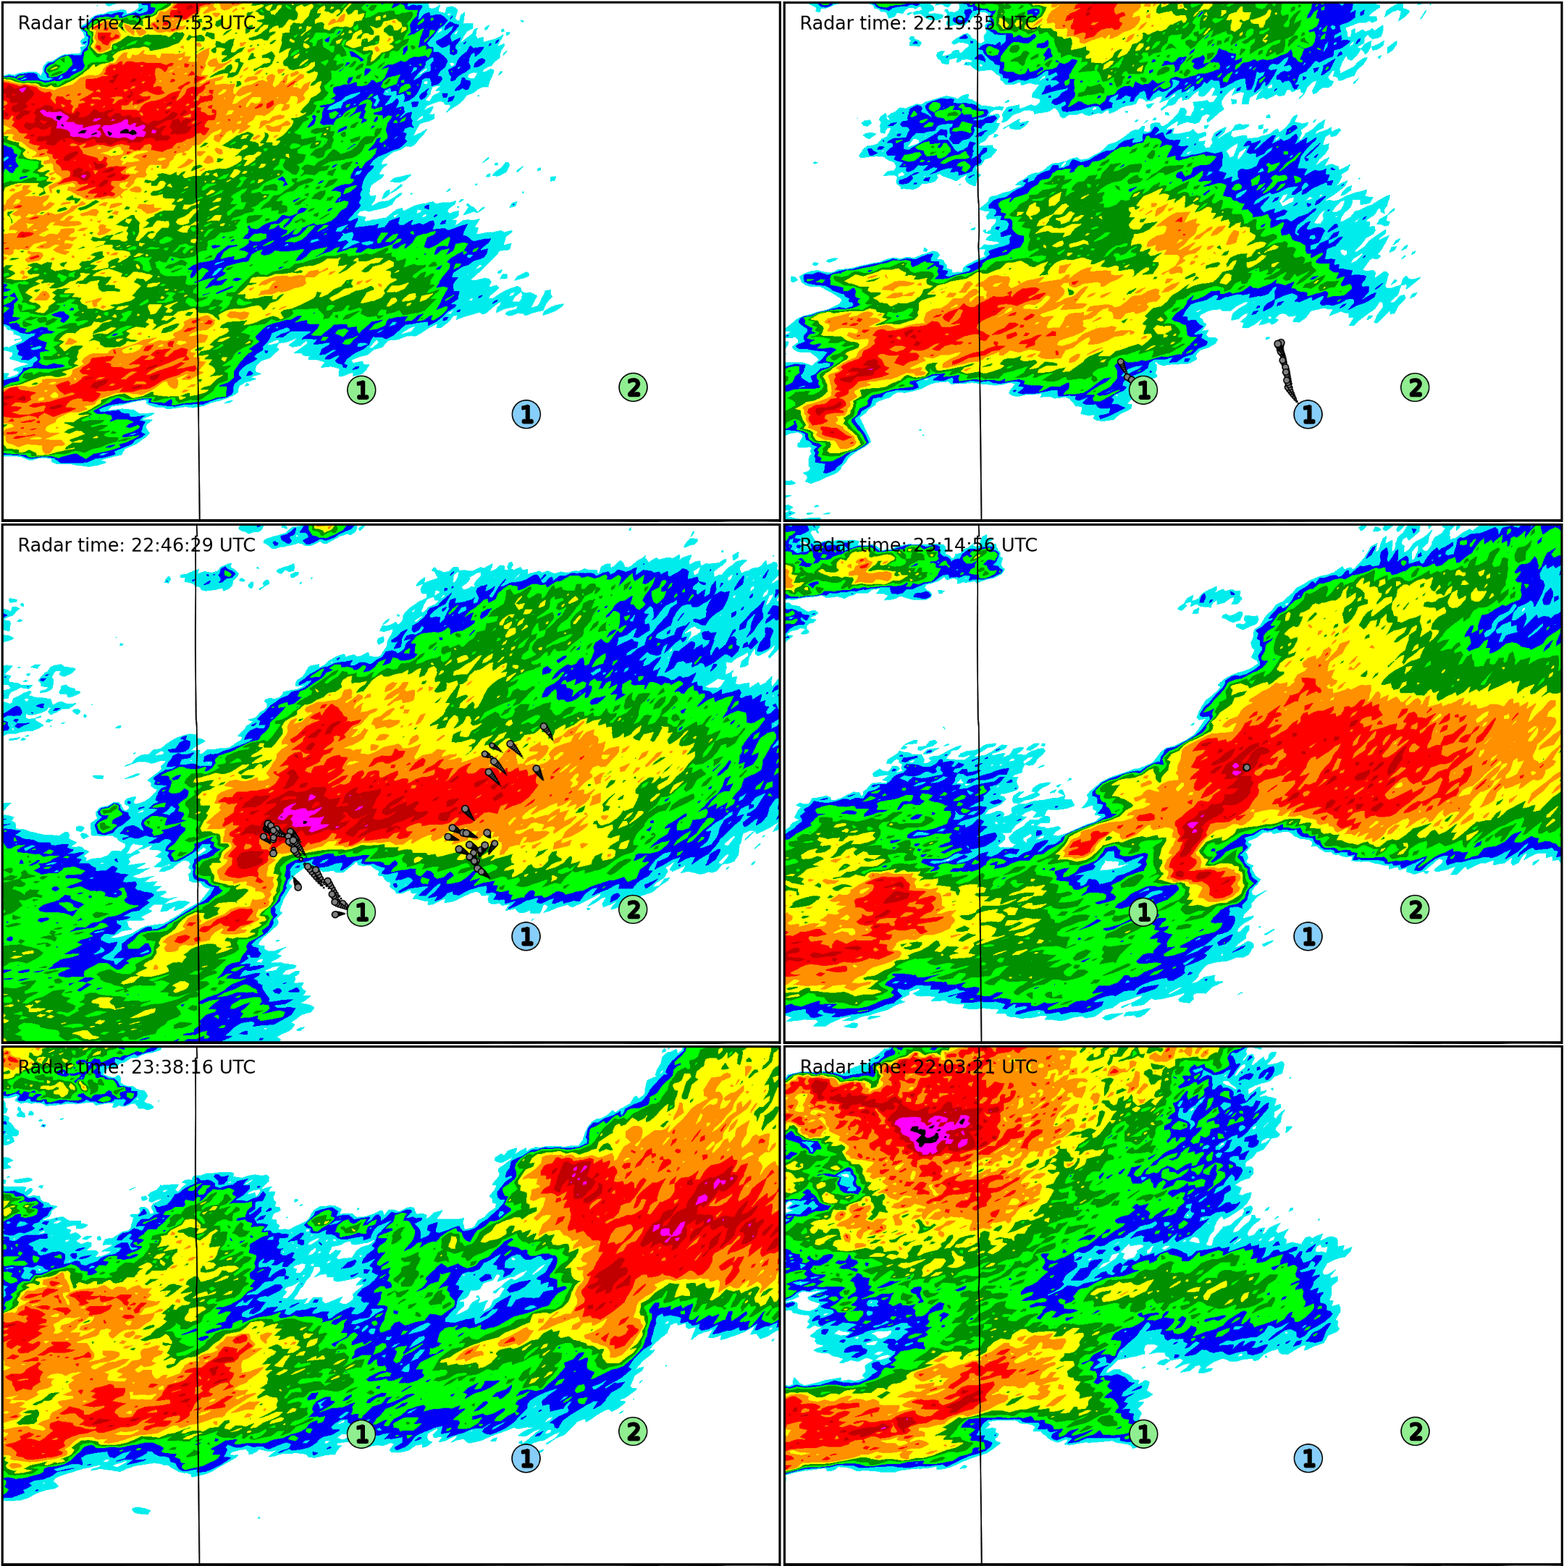
Symbols show the paths of over 70 balloon-borne probes that the authors’ team launched into a supercell thunderstorm. The probes, carried by the wind, mapped the temperature in the storm’s downdraft region, which can be a critical source of rotation for tornadoes. Luke LeBel/Penn State
All of this gives scientists insight into the processes happening throughout the storm before and during tornado development and throughout the tornado’s lifetime.
How do you stay safe while chasing tornadoes?
Storms can be very dangerous and unpredictable, so it’s important to always stay on top of the radar and watch the storm.
A storm can cycle, developing a new tornado downstream of the previous one. Tornadoes can change direction, particularly as they are dying or when they have a complex structure with multiple funnels. Storm chasers know to look at the entire storm, not just the tornado, and to be on alert for other storms that might sneak up. An escape plan based on the storm’s expected motion and the road network is essential.
In 1947, the Thunderstorm Project was the first large-scale U.S. scientific study of thunderstorms and the first to use radar and airplanes. Other iconic projects followed, including ones that deployed a Totable Tornado Observatory, or Toto, which inspired the ‘Dorothy’ instrument in the movie ‘Twister.’
Scientists take calculated risks when they’re storm chasing – enough to collect crucial data, but never putting their teams in too much danger.
It turns out that driving is actually the most dangerous part of storm-chasing, particularly when roads are wet and visibility is poor – as is often the case at the end of the day. During the chase, the driving danger can be compounded by erratic driving of other storm chasers and traffic jams around storms.
What happens to all the data you collect while storm-chasing?
It would be nice to have immediate eureka moments, but the results take time.
After we collect the data, we spend years analyzing it. Combining data from all the instruments to get a complete picture of the storm and how it evolved takes time and patience. But having data on the wind, temperature, relative humidity and pressure from many different angles and instruments allows us to test theories about how tornadoes develop.
Although the analysis process is slow, the discoveries are often as exciting as the tornado itself.
At the end of Monday, the Dow Jones (US30) decreased by 0.12%, while the S&P 500 (US500) was up 0.08%. The NASDAQ Technology Index (US100) closed positive 0.07%. The broad market rose on Monday and extended last Friday’s rally on expectations of a Fed rate cut in September after the June Personal Consumption Expenditures Price Index, the Fed’s preferred gauge of inflation, declined as expected. Rising shares of chip companies also boosted the overall market on Monday after ON Semiconductor reported better-than-expected second-quarter earnings per share.
Stock investors will continue to pay attention to technology stocks as key earnings reports are due this week. This week, companies such as Microsoft (MSFT) will report on Tuesday, Meta (META) on Wednesday, and Apple (AAPL) and Amazon (AMZN) on Thursday.
The US economic news on Monday was weaker than expected and negatively impacted stocks after the Dallas Fed’s survey of overall manufacturing activity unexpectedly fell by 2.4 to 17.5, weaker than expectations for a rise to 14.2.
The major central banks will meet this week to decide on monetary policy. The Bank of Japan (BoJ) is expected to unveil details of plans to reduce monthly bond purchases after a two-day meeting on Wednesday and possibly signal it will start raising interest rates at its September meeting. The US Federal Reserve is likely to signal its intention to cut interest rates in September after its two-day meeting on Wednesday. Markets are pricing in a 25 bps chance of a rate cut at 4% for this week’s FOMC meeting and 100% for the next meeting on September 17–18. On Thursday, the Bank of England (BoE) is expected to cut the bank rate by 25 bps to 5.00% from 5.25%.
Equity markets in Europe were mostly up on Friday. Germany’s DAX (DE40) fell 0.53%, France’s CAC 40 (FR40) closed down 0.98%, Spain’s IBEX 35 (ES35) lost 0.43%, and the UK’s FTSE 100 (UK100) closed positive 0.08%. According to preliminary data, the French economy grew 0.3% QoQ in Q2 2024, matching the upwardly revised Q1 figure but beating market estimates of 0.2% growth. This was the strongest quarterly growth since Q2 2023.
WTI crude prices fell to $75.6 a barrel on Tuesday, hitting their lowest level since early June, amid lingering concerns about demand from major consumer China. The latest data showed that China’s total fuel oil imports fell by 11% in the first half of 2024. Concerns about the outlook for the Chinese economy intensified after disappointing GDP data and the unexpected rate cut by the PBOC last week to stimulate growth, which negatively impacted the market. In addition, concerns over geopolitical tensions in the Middle East eased slightly after reports that Hezbollah said it was not seeking to provoke a full-scale war with Israel.
Asian markets were predominantly down yesterday. Japan’s Nikkei 225 (JP225) added 2.13%, China’s FTSE China A50 (CHA50) was down 0.39%, Hong Kong’s Hang Seng (HK50) was up 1.28%, and Australia’s ASX 200 (AU200) was positive 0.86%.
The Australian dollar is holding near $0.655 as traders avoid making big bets ahead of the release of key domestic inflation data that could influence the Reserve Bank of Australia’s next move. Markets expect Australia’s annual core inflation rate to remain at 4% in the second quarter, well above the central bank’s target range of 2–3%, bolstering the case for another rate hike in August. Traders currently see a 22% chance of the RBA raising rates by 25 basis points next month, while the likelihood of a rate cut before April next year is ruled out.
Japan’s unemployment rate in June 2024 was 2.5%, compared to market estimates of 2.6%, which had also been recorded in the previous four months. It was the lowest unemployment rate since January.
S&P 500 (US500) 5,463.54 +4.44 (+0.081%)
Dow Jones (US30) 40,539.93 −49.41 (−0.12%)
DAX (DE40) 18,320.67 −96.88 (−0.53%)
FTSE 100 (UK100) 8,292.35 +6.64 (+0.08%)
USD Index 104.57 +0.25 (+0.24%)
Important events today:
– Japan Unemployment Rate (m/m) at 02:30 (GMT+3);
– Switzerland KOF Leading Indicators (m/m) at 10:00 (GMT+3);
– German GDP (m/m) at 11:00 (GMT+3);
– Eurozone GDP (m/m) at 12:00 (GMT+3);
– German CPI (m/m) at 15:00 (GMT+3);
– US CB Consumer Confidence (m/m) at 17:00 (GMT+3);
This article reflects a personal opinion and should not be interpreted as an investment advice, and/or offer, and/or a persistent request for carrying out financial transactions, and/or a guarantee, and/or a forecast of future events.
The first modern barcode was scanned 50 years ago this summer – on a 10-pack of chewing gum in a grocery store in Troy, Ohio.
Fifty is ancient for most technologies, but barcodes are still going strong. More than 10 billion barcodes are scanned every day around the world. And newer types of barcode symbols, such as QR codes, have created even more uses for the technology.
I would have been like most people, never giving a second thought to the humble barcode, if my research as a media scholar at Clemson University hadn’t taken a few strange turns. Instead, I spent a year of my life digging through the archives and old newspaper articles to learn about the barcode’s origins – and eventually went on to write a book about the cultural history of the barcode.
While the world has changed a lot since the mid-1970s, the Universal Product Code (UPC) – what most people think of when they hear the word “barcode” – hasn’t. The code first scanned on a package of gum on June 26, 1974, is basically identical to the billions of barcodes scanned in stores all over the world today.
When that first UPC code was scanned, it was the culmination of years of planning by the U.S. grocery industry. In the late 1960s, labor costs were rising rapidly in grocery stores and inventory was becoming increasingly difficult to track. Grocery executives hoped the barcode could help them solve both of those problems, and they ended up being right.
In the early 1970s, the industry created a committee that developed the UPC data standard and chose the IBM barcode symbol over a half-dozen alternative designs. Both the data standard and the IBM barcode symbol are still used today.
Based on meeting notes I found in Stony Brook University’s Goldberg Archive, the people who developed the UPC system felt they were doing important work. However, they had no idea they were creating something that would long outlive most of them.
Even the grocery industry’s optimistic estimates predicted fewer than 10,000 companies would ever use barcodes. As a result, the scanning of the first UPC barcode received little attention at the time.
A few newspapers published short articles about the launch event, but it wasn’t exactly front-page news. Its importance was only apparent years later, as barcodes became one of the most successful digital data infrastructures ever.
Barcodes created a shelf-space revolution
Barcodes didn’t just change the shopping experience at checkout. By making products machine-readable, they enabled vast improvements to inventory tracking. That meant items that sold well could be restocked quickly when the data indicated, requiring less shelf space to be devoted to any individual product.
As barcode expert Stephen A. Brown has written, that reduced need for shelf space allowed for a rapid proliferation of new products. You can blame barcodes for the fact that your grocery store sells 15 types of almost indistinguishable toothpaste.
Similarly, today’s huge grocery stores and superstores likely couldn’t exist without the massive amount of inventory data that barcode systems produce. As MIT professor Sanjay Sharma put it, “If barcodes hadn’t been invented, the entire layout and architecture of commerce would have been different.”
Other industries quickly got on board
The modern barcode was born in the grocery industry, but it wasn’t confined to the grocery aisles for long. By the mid-1980s, the success of the UPC system encouraged other industries to adopt barcodes. For example, within a span of three years, Walmart, the Defense Department and the U.S. automotive industry all began using barcodes to track objects in supply chains.
Private shipping companies also adopted barcodes to capture identification data. FedEx and UPS even created their own barcode symbols.
As the sociologist Nigel Thrift explained, by the end of the 1990s, barcodes had become “a crucial element in the history of the new way of the world.” They helped enable rapid globalization in ways that would be difficult to imagine if barcodes didn’t exist.
I grew up in a world where barcodes were everywhere. They were on all the products I bought, the concert tickets I scanned, the packages I received.
Like most people, I rarely thought about them, despite — or maybe because of — their ubiquity. It wasn’t until I began research for my book that I realized how a barcode on a package of gum set in motion a chain of events that transformed the world.
The barcode of the author’s 2023 book, ‘Barcode,’ tattooed on his arm. Stevie Edwards
For decades, barcodes have been a workhorse operating in the background of our lives. Modern humans scan them countless times every day, but we rarely think about them because they’re not flashy and just work — most of the time, anyway.
As barcodes keep chugging along in their old age, they’re a reminder that the seemingly boring technologies are often far more interesting and consequential than most people realize.
On Friday, the Dow Jones (US30) Index gained 1.64% (for the week +0.43%), while the S&P 500 (US500) Index gained 1.11% (for the week -1.54%). The NASDAQ Technology Index (US100) closed positive at 1.03% (for the week -3.16%). Market sentiment was fueled by new data showing weakening inflation, which heightened expectations of a potential interest rate cut in September. The PCE, the Federal Reserve’s preferred measure of inflation, matched expectations, although the core rate rose 0.2%, slightly above the 0.1% forecast. All sectors showed gains, led by industrials.
Bitcoin climbed toward the $70,000 mark on Monday, reaching the key level for the first time in six weeks after US presidential candidate Donald Trump doubled down on his support for cryptocurrencies in a keynote speech at the Bitcoin 2024 conference in Nashville over the weekend. Trump said he would make the US the “crypto capital of the world” and promised to maintain the country’s current level of bitcoin ownership. Moreover, Republican Senator Cynthia Lummis has introduced a legislative proposal to create an official US strategic reserve of 1 million BTC over the next five years, representing nearly 5% of total BTC.
Equity markets in Europe were mostly up on Friday. The German DAX (DE40) rose by 0.65% (for the week +3.82%), the French CAC 40 (FR40) closed 1.22% higher (for the week -0.74%), the Spanish IBEX 35 (ES35) added 0.18% (for the week +0.15%), and the British FTSE 100 (UK100) closed positive 1.21% (for the week +1.59%) on Friday. European equity markets were set for gains on Monday amid hopes that the US Federal Reserve and the Bank of England will open the door to monetary easing.
WTI crude oil prices rose to $77.5 a barrel on Monday, cutting more than 1% of the previous session’s drop on fears of a possible full-scale war in the Middle East. Israel vowed a strong response to Hezbollah on Sunday, accusing the Iranian-backed group of killing 12 children and teenagers in a rocket attack on a soccer field in the Golan Heights. Hezbollah, however, “strongly denies” its involvement in the strike. Escalating tensions in the Middle East are creating supply risks and increasing oil prices.
Asian markets were mostly down last week. Japan’s Nikkei 225 (JP225) fell by 5.71%, China’s FTSE China A50 (CHA50) declined by 3.07%, Hong Kong’s Hang Seng (HK50) lost 2.54% over five trading days, and Australia’s ASX 200 (AU200) was negative -0.63%.
Vietnam’s annual inflation rate rose to 4.36% in July 2024 from a three-month low of 4.34% in the previous month. Prices rose mainly for medical services (8.13% vs. 8.04% in June) and transportation (4.4% vs. 3.03%), while the cost of postal and telecommunication services fell at a slower pace (-1.06% vs. -1.18%). Meanwhile, annual core inflation, which excludes volatile goods, was 2.61%, remaining at its lowest level in nearly two years.
The offshore yuan stabilized at 7.26 per dollar after hitting a two-month high last week. Traders took a cautious stance ahead of a key Politburo meeting, which was expected to indicate near-term policy measures following the Third Plenum reforms. China recently surprised markets by lowering key interest rates and conducting a surprise credit operation, indicating that the central bank intends to provide stronger monetary stimulus to support the economy.
The debate over whether Australia’s central bank needs to tighten policy at the end of the cycle will likely be resolved with quarterly inflation data release this week. The RBA has raised rates by a smaller amount than other countries to hold down job growth while worrying about the ability of heavily indebted households to cope. If the RBA fails to meet its goal of returning price growth to its 2%-3% target late next year, further rate hikes are likely to be needed – and that’s a big risk of plunging the weak economy into recession.
This article reflects a personal opinion and should not be interpreted as an investment advice, and/or offer, and/or a persistent request for carrying out financial transactions, and/or a guarantee, and/or a forecast of future events.
At Thursday’s close, the Dow Jones Index (US30) added 0.20%, while the S&P 500 Index (US500) was down 0.51%. The NASDAQ Technology Index (US100) closed negative 0.93%. Stocks continued to decline on Thursday amid weakness in chip stocks and selloffs in several individual stocks driven by negative earnings surprises. In addition, the market continues to worry about weakening economic growth despite Thursday’s slightly stronger-than-expected US economic reports.
The US real GDP grew 2.8% (annualized) in the second quarter, beating expectations of 2.0% and up from the 1.4% growth in the first quarter. The GDP report helped ease market fears of lower consumer spending and a slowing economy. Looking ahead, markets expect US GDP to decline to 2.0% in Q3 and 1.6% in Q4. In addition, personal consumption rose 2.3% in Q3, exceeding expectations of 2.0% and up from Q1’s 1.5% increase. The US weekly initial jobless claims declined by 8,000 to 235,000, indicating a modest strengthening of the labor market compared to expectations of a decline to 238,000. June durable goods orders excluding defense and aviation, an indicator of corporate capital spending in the US, rose 1.0%, stronger than expectations of 0.2%.
Equity markets in Europe were declining yesterday. Germany’s DAX (DE40) fell by 0.48%, France’s CAC 40 (FR40) closed down 1.15%, Spain’s IBEX 35 (ES35) lost 0.58%, and the UK’s FTSE 100 (UK100) closed positive 0.40%. European equities closed sharply lower on Thursday, extending the sell-off from the previous session amid weak corporate results. ASML shares continued their bearish momentum and closed 4% lower, representing a 20% decline over the past two weeks
WTI crude oil prices recovered from earlier losses to reach $78.28 per barrel on Thursday, helped by stronger-than-expected economic growth in the US and lower crude inventories. Despite these factors, oil prices remain near six-week lows due to concerns over lower oil imports and refinery activity in China amid sluggish economic growth.
The US natural gas (XNGUSD) prices fell to $2.05/MMBtu after the EIA reported a larger-than-expected increase in storage inventories. The US utilities added 22 billion cubic feet (Bcf) of gas to storage last week, beating market expectations of a 15 Bcf increase. Gas storage levels are now 16.4% above the 5-year average. Natural gas prices are set to decline for a second week due to higher production.
Asian markets were mostly down yesterday. Japan’s Nikkei 225 (JP225) fell by 3.28%, China’s FTSE China A50 (CHA50) was down 0.74%, Hong Kong’s Hang Seng (HK50) lost 1.77%, and Australia’s ASX 200 (AU200) was negative 1.29%.
The offshore yuan weakened to 7.25 per dollar after hitting a more than two-month high in the previous session, likely due to a technical correction. Earlier, the yuan’s appreciation was attributed to state bank intervention, which took advantage of the weakening US dollar by aggressively selling the dollar and buying yuan in offshore and domestic markets to support its appreciation.
The Monetary Authority of Singapore (MAS) left monetary policy on hold for July 2024, extending the pause for the 5th consecutive time amid moderate imported inflation. The Central Bank said it will maintain the prevailing pace of appreciation of the SGD nominal effective exchange rate (S$NEER), with no change to its breadth and the level at which it is pegged. MAS noted that the city-state’s core inflation, the Consumer Price Index for all goods, declined to 2.8% y/y in Q2 2024 from 3.0% in Q1. At the same time, it maintained estimates for core inflation at 2.5–3.5% this year, noting a further slowdown in Q4 to around 2% in 2025.
Tokyo Japan’s core consumer price index rose to 2.2% year-on-year in July 2024, accelerating for the third straight month to the highest level since March, confirming the need for the central bank to normalize policy. The latest data also matched market expectations and followed a 2.1% rise in June. Next week’s BoJ meeting is expected to discuss the need to raise interest rates to defend the yen and combat inflationary pressures. Tokyo’s inflation data is widely seen as a leading indicator of nationwide price trends.
S&P 500 (US500) 5,399.22 −27.91 (−0.51%)
Dow Jones (US30) 39,935.07 +81.20 (+0.20%)
DAX (DE40) 18,298.72 −88.74 (−0.48%)
FTSE 100 (UK100) 8,186.35 +32.66 (+0.40%)
USD Index 104.39 0 (0%)
Important events today:
– Japan Tokyo Core CPI (m/m) at 02:30 (GMT+3);
– US PCE Price index (m/m) at 15:30 (GMT+3);
– US Michigan Consumer Sentiment (m/m) at 17:00 (GMT+3).
This article reflects a personal opinion and should not be interpreted as an investment advice, and/or offer, and/or a persistent request for carrying out financial transactions, and/or a guarantee, and/or a forecast of future events.
At the end of Tuesday, the Dow Jones Index (US30) decreased by 1.25%, while the S&P 500 Index (US500) was down 2.31%. The NASDAQ Technology Index (US100) closed negative 3.64%. Stocks fell yesterday amid disappointing earnings from Tesla and Google and weakness in chip maker stocks. Next week, companies such as Microsoft (MSFT) will report on Tuesday, Meta (META) on Wednesday, and Apple (AAPL) and Amazon (AMZN) on Thursday. Nvidia (NVDA) is expected to report earnings on August 28. The stock market is also concerned about the outlook for corporate earnings after the election. Vice President Kamala Harris performs better than President Biden and appears to have a better chance of defeating Donald Trump.
The market consensus expects second-quarter earnings for S&P 500 companies to rise 9% YoY. About a quarter of the companies in the S&P 500 have already reported, and most of them beat earnings forecasts.
The US economic reports released on Wednesday were weak and negative for the US economy, although they were at least dovish for Fed policy. S&P’s preliminary US manufacturing PMI for July fell 2.1 points to 49.5, much weaker than expectations of an unchanged 51.6. The US manufacturing PMI fell below the 50.0 level for the first time since December 2023, indicating weakness in the US manufacturing sector.
As some of the markets expected, the Bank of Canada (BoC) cut its key interest rate by 25 bps to 4.5% at its July 2024 meeting, extending the 25 bps rate cut from the June meeting. The Bank of Canada’s Board of Governors noted that oversupply in the Canadian economy has helped slow inflation in recent months, justifying a looser monetary policy. The central bank also noted that, combined with indicators suggesting excess supply, lower interest rates could help slow mortgage and housing cost growth, contributing most to inflation.
Equity markets in Europe were declining yesterday. Germany’s DAX (DE40) fell 0.92%, France’s CAC 40 (FR40) closed down 1.12%, Spain’s IBEX 35 (ES35) lost 0.02%, and the UK’s FTSE 100 (UK100) closed negative 0.17% on Wednesday. European equity markets opened lower on Thursday, following a global equity sell-off as disappointing earnings reports from mega-large tech companies in the US triggered massive sell-offs. On the corporate front, earnings are expected from Nestle, Roche, AstraZeneca, Sanofi, and Stellantis, among others.
The preliminary Eurozone manufacturing PMI for July fell 0.2 points to 45.6, weaker than expectations for a 0.3 point increase to 46.1. The preliminary Eurozone Services PMI for July fell 0.9 points to 51.9, weaker than expectations for a 0.1 point increase to 52.9.
WTI crude oil prices fell to $77 per barrel on Thursday, hitting their lowest since early June, as the prevailing negative sentiment in global stock markets put pressure on risk assets. In addition, the prospects of an impending ceasefire agreement between Israel and Hamas brokered by Egypt, Qatar, and the US put downward pressure on oil prices. Meanwhile, EIA data showed a 3.74 million barrel decline in inventories last week, the fourth consecutive decline, exceeding forecasts for a 2.05 million barrel drop.
Asian markets were predominantly down yesterday. Japan’s Nikkei 225 (JP225) fell 1.11%, China’s FTSE China A50 (CHA50) declined 0.32%, Hong Kong’s Hang Seng (HK50) lost 0.91%, and Australia’s ASX 200 (AU200) was negative 0.09%. Asian equity markets fell sharply on Thursday, following losses on Wall Street overnight, as disappointing earnings from mega-large companies triggered a sell-off in technology and artificial intelligence stocks. Japanese stocks led the decline in regional markets, which were also pressured by a rising yen amid bets of a Bank of Japan rate hike next week.
The People’s Bank of China (PBOC) unexpectedly cut its one-year lending rate, known as the medium-term lending facility (MLF), by 20 bps to 2.3% from 2.5% on July 25. It was the first cut in almost a year and the biggest since April 2020. The central bank stepped up support for the weakening economy following the Third Plenum in mid-July, weaker-than-expected second-quarter GDP data, and mixed economic data in June just days after cutting the key short-term rate.
S&P 500 (US500) 5,427.13 −128.61 (−2.31%)
Dow Jones (US30) 39,853.87 −504.22 (−1.25%)
DAX (DE40) 18,387.46 −170.24 (−0.92%)
FTSE 100 (UK100) 8,153.69 −13.68 (−0.17%)
USD Index 104.33 -0.12 (-0.12%)
Important events today:
– German Ifo Business Climate (m/m) at 11:00 (GMT+3);
– US Core Durable Goods Orders (m/m) at 15:30 (GMT+3);
– US GDP (q/q) at 15:30 (GMT+3);
– US Initial Jobless Claims (w/w) at 15:30 (GMT+3);
– US Natural Gas Storage (w/w) at 17:30 (GMT+3);
– Eurozone ECB President Lagarde Speaks at 18:00 (GMT+3).
This article reflects a personal opinion and should not be interpreted as an investment advice, and/or offer, and/or a persistent request for carrying out financial transactions, and/or a guarantee, and/or a forecast of future events.
At Tuesday’s close, the Dow Jones Index (US30) decreased by 0.14%, while the S&P 500 Index (US500) was down 0.16%. The NASDAQ Technology Index (US100) closed negative 0.06%.
Spotify (SPOT) shares are up 2.11% after reporting stronger-than-expected subscriber growth and higher-than-expected gross profit. Tesla’s (TSLA) second-quarter net income fell 45% from a year ago as sales of the company’s electric vehicles declined globally despite price cuts and low-interest financing. Tesla Inc shares fell 3% after the report was released. Alphabet Inc. (GOOG) reported second-quarter financial results on Tuesday that mostly exceeded analysts’ expectations. The company reported adjusted earnings per share (EPS) of $1.89, slightly above the consensus estimate of $1.83. Revenue for the quarter totaled $84.74 billion, which was also above analysts’ average prognosis of $84.16 billion. Google shares rose 2.2 percent after-hours trading. Visa (V)’s third-quarter revenue growth fell short of Wall Street expectations as high borrowing costs curbed consumer spending, sending shares of the world’s largest payment processor down 2.1% in extended trading.
Recently, the market has viewed a Trump victory as favorable for the dollar. A Trump administration would likely pursue tax cuts and stimulative fiscal policy, which would be hawkish for Fed policy and thus favorable for the dollar. In contrast, a victory for Vice President Harris would favor the status quo and would not support the dollar.
Markets are awaiting Friday’s PCE deflator report to see when inflation might fall enough for the Fed to start cutting rates. The PCE deflator is the Fed’s preferred inflation gauge. The consensus on Friday is that the June PCE deflator will fall to 2.4% y/y from May’s 2.6%, and the June core PCE deflator will fall to 2.5% y/y from May’s 2.6%. A decline in the PCE index could support indices that have been corrected for the past few days.
Equity markets in Europe traded flat on Tuesday. German DAX (DE40) rose by 0.82%, French CAC 40 (FR40) closed down 0.31%, Spanish IBEX 35 (ES35) added 0.62%, British FTSE 100 (UK100) closed negative 0.38%. European equity markets opened lower on Wednesday as disappointing earnings reports weighed on investor sentiment. LVMH reported lower sales growth in the second quarter as Chinese consumers curbed spending on luxury goods, while Deutsche Bank recorded a quarterly loss after provisioning for ongoing litigation against its Postbank unit.
WTI crude prices rose to above $77 a barrel on Wednesday after falling for four consecutive sessions, helped by a larger-than-expected decline in US oil inventories. API data showed a 3.9 million barrel decline in inventories last week, marking the fourth straight week of decline and exceeding market estimates of a 2.5 million barrel drop. Renewed optimism over ceasefire talks between Israel and Hamas also put downward pressure on prices after Israeli Prime Minister Benjamin Netanyahu said a ceasefire agreement could take shape.
Asian markets were predominantly down yesterday. Japan’s Nikkei 225 (JP225) decreased by 0.01%, China’s FTSE China A50 (CHA50) was down 1.55%, Hong Kong’s Hang Seng (HK50) lost 0.94%, while Australia’s ASX 200 (AU200) was positive 0.50%.
Malaysia’s annual inflation rate unexpectedly came in at 2.0% for June 2024, below market expectations of 2.2%, and stable for the second consecutive month. The reading remained at its highest level since August 2023. Core consumer prices, excluding volatile fresh food and administrative expenses, rose 1.9% y/y in June, maintaining the same pace for a third month and remaining at the highest since December 2023.
Jibun Bank’s Japan Manufacturing PMI unexpectedly fell to 49.2 in July 2024 from 50.0 in the previous month, missing market estimates of 50.5 and indicating the first contraction in factory activity since April. The latest data also marked the fifth contraction in the manufacturing sector this year amid a fresh drop in output. The flash data showed that Japan’s services PMI from Jibun Bank jumped to 53.9 in July 2024 from 49.4 in the previous month. It was the sixth rise in the services sector this year and the sharpest since April, as new orders rose by the most in three months and employment growth accelerated.
S&P 500 (US500) 5,555.74 −8.67 (−0.16%)
Dow Jones (US30) 40,358.09 −57.35 (−0.14%)
DAX (DE40) 18,557.70 +150.63 (+0.82%)
FTSE 100 (UK100) 8,167.37 −31.41 (−0.38%)
USD Index 104.44 +0.12 (+0.12%)
Important events today:
– Australia Manufacturing PMI (m/m) at 02:00 (GMT+3);
– Australia Services PMI (m/m) at 02:00 (GMT+3);
– Japan Manufacturing PMI (m/m) at 03:30 (GMT+3);
– Japan Services PMI (m/m) at 03:30 (GMT+3);
– Germany Manufacturing PMI (m/m) at 10:30 (GMT+3);
– Germany Services PMI (m/m) at 10:30 (GMT+3);
– Eurozone Manufacturing PMI (m/m) at 11:00 (GMT+3);
– Eurozone Services PMI (m/m) at 11:00 (GMT+3);
– UK Manufacturing PMI (m/m) at 11:30 (GMT+3);
– UK Services PMI (m/m) at 11:30 (GMT+3);
– US Manufacturing PMI (m/m) at 16:45 (GMT+3);
– US Services PMI (m/m) at 16:45 (GMT+3);
– Canada BoC Interest Rate Decision at 16:45 (GMT+3);
– Canada BoC Monetary Policy Statement at 16:45 (GMT+3);
This article reflects a personal opinion and should not be interpreted as an investment advice, and/or offer, and/or a persistent request for carrying out financial transactions, and/or a guarantee, and/or a forecast of future events.
At Monday’s close, the Dow Jones Industrial Average (US30) was up 0.32%, while the S&P 500 Index (US500) added 1.08%. The NASDAQ Technology Index (US100) closed positive 1.58%.
NVIDIA Corporation (NVDA) closed nearly 5% higher after Reuters reported that the chipmaker is developing a B20 version of its Blackwell GPU specifically for the Chinese market that will comply with US export control requirements. Ahead of Alphabet’s (GOOG) results release, Wedbush said it sees the tech giant’s sentiment as “positive ahead of second-quarter results” as advertising reviews and agency commentary point to the “continued strength of Google search.” Ahead of Tesla’s (TSLA) results release, CEO Elon Musk said humanoid robots will be used internally next year.
Equity markets in Europe were mostly up on Monday. Germany’s DAX (DE40) rose by 1.29%, France’s CAC 40 (FR40) closed positive 1.16%, Spain’s IBEX 35 (ES35) added 0.51%, and the UK’s FTSE 100 (UK100) closed positive 0.53%.
The Bank of England (BoE) urges market participants to prepare for a new cash management regime as excess liquidity is withdrawn from the financial system. Victoria Saporta, BoE executive director of markets, said the Central Bank wants to move from buying assets in exchange for cash reserves to a system of lending cash against those assets. The market has switched to repos as the BoE shrinks its balance sheet by selling bonds and not reinvesting in its maturing bond portfolio. However, the Central Bank now wants banks to use longer-term operations rather than short-term repo (STR) more often.
Morgan Stanley said the oil market deficit is likely to persist through most of the third quarter. However, by the fourth quarter, the market is expected to stabilize. This change is due to the decline in demand that typically occurs after summer and the projected increase in oil production by both OPEC and non-OPEC countries. That said, Morgan Stanley predicts that supply is likely to outstrip demand next year. The investment bank expects the oil price to fall to $75–79 by 2025.
WTI crude oil prices settled at $78.5 a barrel on Tuesday after falling for three consecutive sessions as investors’ attention shifted to US oil inventory data. On Monday, the People’s Bank of China unexpectedly lowered its interest rate to support economic growth, easing fears of a weakening Chinese economy and easing concerns about demand from the main oil consumer.
Asian markets were predominantly down yesterday. Japan’s Nikkei 225 (JP225) was down 1.16%, China’s FTSE China A50 (CHA50) lost 1.08%, Hong Kong’s Hang Seng (HK50) added 1.25%, and Australia’s ASX 200 (AU200) was negative 0.50%.
Hang Seng (HK50) shares fell by 0.4% in Tuesday morning session, bouncing back from an active session the previous day after fresh data showed Hong Kong’s annual inflation rate rose to a 3-month high of 1.5% in June, rising for a second month on the back of lower electricity subsidies. Meanwhile, business sentiment in the city turned negative in Q3 for the first time in 2 years due to concerns over a new security law.
Singapore’s annual inflation rate fell to 2.4% in June 2024 from 3.1% in May, below market estimates of 2.7% and pointing to the lowest rate since August 2021. Annualized core inflation fell to 2.9% from 3.1% in the previous 3 months, falling short of the 3.0% prognosis and indicating the lowest level since March 2022. On a month-on-month basis, CPI fell by 0.2%, the first decline in three months.
The Australian dollar held below $0.665, near its lowest level in three weeks, as China’s surprise move to cut key interest rates pressured the currency. The Australian dollar is widely seen as a liquid proxy for the Chinese yuan, as Australia’s economy relies heavily on exports to China. The local currency has also been pressured recently by weakening commodity prices as Australia is a net exporter of energy and metals.
In Japan, Toshimitsu Motegi, a senior ruling party official, called on the Bank of Japan to more clearly outline its plan to normalize monetary policy through successive rate hikes, adding that excessive yen depreciation was hurting the economy.
S&P 500 (US500) 5,564.41 +59.41 (+1.08%)
Dow Jones (US30) 40,415.44 +127.91 (+0.32%)
DAX (DE40) 18,407.07 +235.14 (+1.29%)
FTSE 100 (UK100) 8,198.78 +43.06 (+0.53%)
USD Index 104.30 -0.10 (-0.09%)
Important events today:
– Singapore Consumer Price Index (q/q) at 08:00 (GMT+3);
This article reflects a personal opinion and should not be interpreted as an investment advice, and/or offer, and/or a persistent request for carrying out financial transactions, and/or a guarantee, and/or a forecast of future events.
On Friday, the Dow Jones (US30) Index fell by 0.93% (for the week +0.37%), while the S&P 500 (US500) Index lost 0.71% (for the week -2.36%). The NASDAQ Technology Index (US100) closed negative 0.81% (for the week -4.11%). Investors continued to take profits after the recent record highs of the major indices. In addition, after an already turbulent week, a global IT system failure affecting services from airlines to banks added to the worries. Presumably, the outage was caused by an update from CrowdStrike that caused problems with Microsoft’s Windows.
US President Joe Biden has withdrawn from the 2024 presidential election. This came after his supporters turned their backs on him for weeks amid his poor debate performance against former president and Republican nominee Donald Trump. Biden has endorsed Vice President Kamala Harris, who has said she is running for president.
Bitcoin rose to around $68,000 on Monday, hitting its highest level since mid-June. The US bitcoin exchange-traded funds received a total of more than $17 billion in inflows in July, setting a new record. BlackRock’s IBIT and Fidelity’s FBTC were the main contributors, with net inflows of about $19 billion and $10 billion, respectively. Betting on Trump’s second presidency also continued to support digital assets in anticipation of a more favorable regulatory environment for them. Trump is scheduled to speak at an industry conference in Nashville, Tennessee, later this month, and some analysts speculate that he will announce plans to include Bitcoin in the US strategic reserves.
Equity markets in Europe were mostly down on Friday. Germany’s DAX (DE40) fell by 1.00% (-3.01% for the week), France’s CAC 40 (FR40) lost 0.69% (-1.92% for the week), Spain’s IBEX 35 (ES35) fell by 0.54% (-1.23% for the week), and the UK’s FTSE 100 (UK100) closed negative 0.60% (-1.18% for the week).
While economic growth in the Eurozone remains sluggish, a dominant service sector driven by tourism is keeping price pressures at uncomfortably high levels. This poses challenges for the ECB, so Wednesday’s PMI data will be closely watched after the Central Bank kept interest rates at 3.75% last Thursday and gave no further guidance, saying it “depends on the data.”
On Friday, oil prices settled at their lowest level since mid-June as investors anticipated a possible ceasefire in Gaza, while a strong dollar also had an impact. The war in Gaza has prompted investors to put a risk premium on oil trading as tensions threaten global supplies. If a truce is reached, Iran-backed Houthi rebels may ease their attacks on commercial ships in the Red Sea as the group has declared support for Hamas.
Asian markets traded without any dynamics last week. Japan’s Nikkei 225 (JP225) fell by 3.85%, China’s FTSE China A50 (CHA50) gained 1.26%, Hong Kong’s Hang Seng (HK50) lost 4.31%, and Australia’s ASX 200 (AU200) was positive 0.15%.
The offshore yuan hit its lowest level in more than a week as traders reacted to the latest decision by the People’s Bank of China (PBoC). In a surprise move, key lending rates were cut to new record lows during the July fixing to support the fragile economic recovery. The 1-year prime rate (LPR), the benchmark for most corporate and household loans, was cut 10 basis points to 3.35%, while the 5-year rate, the benchmark for real estate mortgages, was cut 10 basis points to 3.85%. In addition, the Central Bank initiated a ¥58.2 billion reverse repurchase operation and cut the seven-day reverse repo rate by 10 basis points to 1.7% from 1.8%. The decision came shortly after last week’s third plenum and followed a series of economic data indicating that the economic recovery may be losing momentum.
The Australian dollar fell to $0.668, hitting its weakest level in three weeks, as a sharp decline in energy and metals prices pressured the currency. Australia’s economy relies heavily on commodity exports, making the Australian dollar sensitive to changes in commodity prices.
S&P 500 (US500) 5,505.00 −39.59 (−0.71%)
Dow Jones (US30) 40,287.53 −377.49 (−0.93%)
DAX (DE40) 18,171.93 −182.83 (−1.00%)
FTSE 100 (UK100) 8,155.72 −49.17 (−0.60%)
USD Index 104.37 +0.19 (+0.18%)
Important events today:
– New Zealand Trade Balance (q/q) at 01:45 (GMT+3);
This article reflects a personal opinion and should not be interpreted as an investment advice, and/or offer, and/or a persistent request for carrying out financial transactions, and/or a guarantee, and/or a forecast of future events.
See how Elliott wave patterns “subsume” other technical analysis chart patterns
By Elliott Wave International
Some investors who are fans of technical analysis may not realize that another way to look at many classic chart patterns — for example, Head and Shoulders — is to describe them in terms of Elliott waves.
What this means is that once you’ve learned Elliott wave analysis, by proxy you’ve learned most other technical analysis chart patterns that simply go by different names!
It’s a huge time saver.
In August and October 2005, as well as February 2006, Robert Prechter’s Elliott Wave Theorist discussed several chart patterns and showed two examples (with an introductory quote from the August 2005 Elliott Wave Theorist):
The acknowledged “bible” of traditional chart interpretation is Technical Analysis of Stock Trends (1948) by Robert Edwards and MIT alumnus John Magee. … The discussion here utilizes the fifth edition (1966).
Edwards and Magee collected others’ observations about chart patterns and added their own, producing a comprehensive list of forms against which we may compare related aspects of the Wave Principle. It may not be necessary that we undergo this exercise, as these authors observed and displayed these patterns exclusively in charts of individual stocks, not in the averages where the Wave Principle is deemed best to apply. Nevertheless, because many chartists use the same forms for general market interpretation and since the Wave Principle has some applicability to individual stocks, this exercise is important in order to determine if there are any valid market patterns outside the forms of the Wave Principle.
Head and Shoulders Top
Figure 8a shows Edwards and Magee’s depiction of a head and shoulders top, and Figure 8b is Figure 7-4 from Elliott Wave Principle. In a normal wave development, wave five of 3 and wave 4 form the “left shoulder” of the pattern, wave 5 and wave A form the “head,” and wave B and wave one of C form the “right shoulder.” Wave two of C creates the return to the neckline that is typical of the pattern.
Symmetrical Triangle
The Wave Principle covers the chartist’s “symmetrical triangle.” As you can see in Figures 11a and 11b, Edwards and Magee’s example is a perfect rendition of Elliott’s description, right down to the five subwaves.
Edwards and Magee claim, “Prices may move out of a Symmetrical Triangle either up or down. There is seldom if ever…any clue as to the direction….” Elliott’s form is more specifically defined, and its position in the market structure and therefore its implications are more definite.
Even though just two examples were shown here, hopefully, you get a flavor of what was presented in 2005 and 2006 — and an idea of the quality of analysis which our Financial Forecast Service regularly offers.
Realize that a chart pattern — even though it’s “classic” — offers no guarantees — and the same with the Wave Principle.
Yet, keep in mind this adaptation of a Q&A with Robert Prechter from an issue of The Elliott Wave Theorist:
Q: Do you believe that the Wave Principle provides for an objective form of analysis? Two different people can look at the same chart and derive very different wave counts. There are market watchers who say that applying wave theory is very subjective.
A: I always ask, “compared to what?” There is no group more subjective than conventional analysts who look at the same “fundamental” news event [like] a war, the level of interest rates, the P/E ratio, GDP reports, the President’s economic policy, the Fed’s monetary policy, you name it and come up with countless opposing conclusions. They generally don’t even bother to study the data. The Wave Principle is an excellent basis for assessing probabilities regarding future market movement. Probabilities are by nature different from certainties. Some people misinterpret this aspect of analysis as subjectivity, but all probabilities may be put in order objectively according to the rules and guidelines of wave formation.
If you’re unfamiliar with Elliott wave analysis, read Frost & Prechter’s Elliott Wave Principle: Key to Market Behavior, which is the definitive text on the subject. Here’s a quote from the book:
[Ralph N.] Elliott recognized that not news, but something else forms the patterns evident in the market. Generally speaking, the important analytical question is not the news per se, but the importance the market places or appears to place on the news. In periods of increasing optimism, the market’s apparent reaction to an item of news is often different from what it would have been if the market were in a downtrend. It is easy to label the progression of Elliott waves on a historical price chart, but it is impossible to pick out, say, the occurrences of war, the most dramatic of human activities, on the basis of recorded stock market action. The psychology of the market in relation to the news, then, is sometimes useful, especially when the market acts contrarily to what one would “normally” expect.
If you’d like to read the entire online version of Elliott Wave Principle: Key to Market Behavior, you can get complimentary access by following this link: Elliott Wave Principle: Key to Market Behavior.
This article was syndicated by Elliott Wave International and was originally published under the headline Want to Learn How to “Read” a Price Chart? Start Here.. EWI is the world’s largest market forecasting firm. Its staff of full-time analysts led by Chartered Market Technician Robert Prechter provides 24-hour-a-day market analysis to institutional and private investors around the world.