Archive for Economics & Fundamentals – Page 30

Trump’s Tariffs Threat to the Global South

By Dan Steinbock

 With its misguided tariff wars, the Trump administration is not only disrupting historical trade ties with the world’s largest economies, but waging war against economic development in the Global South.

After agreeing to suspend the “reciprocal” duties for 90 days — till early July — Trump threatened to set country-specific tariff rates. By making good his promise and imposing unilateral tariffs on imports from the US’ trading partners, Trump will severely disrupt export-led growth, which has fueled global growth for years, and shatter the development dreams and aspirations of emerging and developing economies.

China’s global trade engine is a case in point.

$3.6 trillion of exports to 230 countries

In 2024, US exports amounted to some $2.1 trillion. That’s significantly more than those by Germany ($1.7 tr) or the Netherlands ($0.7 tr), Europe’s two largest trading economies. Yet, today the value of US exports is less than 60% of those by China that amount to $3.6 trillion. Today, China contributes some 15% of all exports worldwide. That’s twice as much as the US (Figure 1).


Figure 1 China’s export partners worldwide

Source: Latest data (for 2024), ITC, June 2025


China’s exports have some 230 destinations. Most go to major economies in North America (US, Mexico, Canada), Western Europe (Germany, Netherlands, UK), East Asia (Japan, South Korea, Taiwan), Southeast Asia (Vietnam, Malaysia, Thailand), India, Russia and Australia.

In 2018, before the first Trump administration’s tariff wars, the United States still accounted for over 19% of China’s total exports. In 2024, that figure was barely 16%; that is, less than Chinese exports to Europe and Southeast Asia, each. Ever since the US tariff wars, China has diversified its exports away from the US.

In the past decade, this trend has been greatly reinforced by Chinese trade with Belt and Road Initiative (BRI) countries. Nearly 54% of China’s imports came from BRI partner countries last year, with China’s huge marketplace providing development opportunities for nations around the world.

China’s trade is vital to the emerging and developing economies of the Global South, where the West’s exports often are prohibitively expensive. The West exports mainly to economies that share similar high living standards. Such trade is predicated on high purchasing power, which is the privilege of high-income economies.

Trump’s war against economic development

The first round of Trump tariffs built on traditional trade wars focusing mainly on Canada, Mexico and China. The second round began with “reciprocal tariffs”, which actually are unilateral, flawed as stated and mistakenly calculated. Those tariffs were followed by a slate of retaliatory tariffs.

The net effect has been a stunning downgrading of the economic prospects in the United States, its trading partners and the global economy. What is less understood is the likely long-term effect of Trump’s unilateral tariffs, which is to undermine the rise of the Global South.

The US administration’s original list of these tariff targets comprised almost 60 countries and regions. Except for the EU as a bloc and a few high-income countries, three of four of these targets represent emerging and developing economies; that is, the Global South. The Trump administration is at war against their economic development (Figure 2).


Figure 2 Trump administration’s unilateral tariffs

Source: White House


Since the late 20th century, most economies that have been able to industrialize and catch-up with the advanced economies of the West have done so on the back of export-led growth. It is what fueled the rise of Asian tigers in the postwar era (Hong Kong, Singapore, South Korea, Taiwan), their subsequent successors (Malaysia, Thailand, Vietnam, Indonesia).

They were followed by China – and today India and some Southeast Asian economies.

From Western domination to multipolarity

After World War II, the United States dominated half of the world economy. It was the “world’s factory,” the largest manufacturer and exporter. As the largest creditor, it also held huge leverage over the international economy. This dominance, in turn, was reflected by the mighty US dollar that had a virtual monopoly in international transactions.

All that is history today.

Of course, the United States remains the largest single economy in the world, but its relative share has shrunk to about a fourth or fifth of the world GDP. It hasn’t been the world’s largest export manufacturer since the postwar era. Starting in the 1970s, it has suffered from trade deficits and today it is the world’s largest debtor. Concurrently, the share of US dollar in international transactions has shrunk to less than 60%.

In the process, Washington has played itself into a dark corner: it cannot fully decouple from China without major economic turmoil. But thanks to its tariffs, it cannot any longer benefit from China’s affordable prices, which has long contributed to low inflation in the US.

Today any major threat to undermine Chinese trade poses a $6.2 trillion threat – that is, export plus imports combined – to its trading partners, particularly the Global South and the world at large.

About the Author:

Dr. Dan Steinbock is an internationally recognized strategist of the multipolar world and the founder of Difference Group. He has served at the India, China and America Institute (USA), Shanghai Institutes for International Studies (China) and the EU Center (Singapore). For more, see https://www.differencegroup.net 


The original version was published by China Daily on June 20, 2025


Week Ahead: US500 faces triple threat – Geopolitics, Powell & PCE

By ForexTime 

  • FXTM’s US500 ↑ 1% MTD, less than 3% away from ATH
  • Trump delays decision on Iran strike by two weeks
  • Powell’s testimony + US PCE = potential breakout?
  • US PCE forecasted to move US500 ↑ 1.3% or ↓ 1.0%
  • Technical levels: 6060, 6000 & 5920 

A cautious sense of relief has spread through markets after President Trump delayed deciding on attacking Iran by two weeks.

However, the ongoing Middle East conflict is set to weigh on investor confidence ahead of another heavy event-packed week. 

Speeches by various policymakers, top-tier economic data including the Fed’s preferred inflation gauge and Powell’s testimony could translate to fresh trading opportunities:

Sunday, 22nd June 

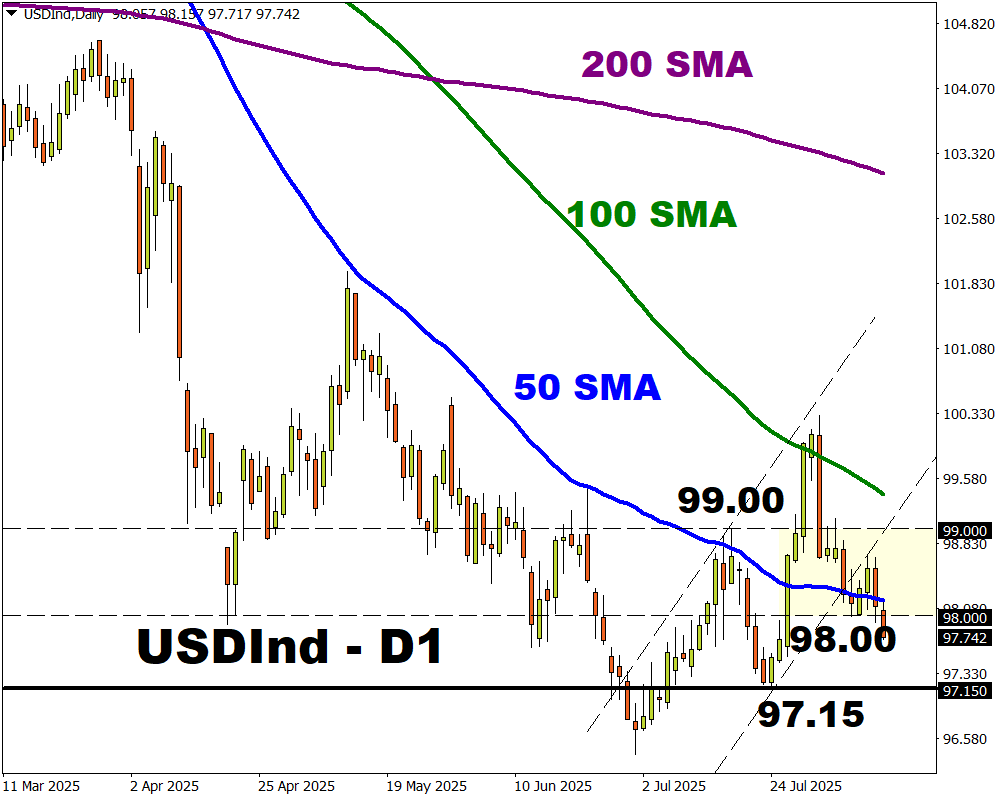
  • USDInd: San Francisco Fed President Mary Daly
  • Tesla: Tentative launch of Robotaxi service in Texas

Monday, 23rd June 

  • GER40: Germany HCOB Manufacturing & Services PMI
  • JPY: Japan au Jibun Bank Manufacturing PMI
  • TWN: Taiwan jobless rate
  • UK100: UK S&P Global Manufacturing & Services PMI
  • RUS2000: US S&P Global Manufacturing & Services PMI, Fed speak

Tuesday, 24th June 

  • CN50: China’s National People’s Congress
  • CAD: Canada CPI
  • GER40: Germany IFO business climate
  • UK100: BOE Governor Andrew Bailey testimony
  • US500: Fed Chair Jerome Powell testimony, New York Fed President John Williams

Wednesday, 25th June

  • AUD: Australia CPI
  • NZD: New Zealand trade
  • JPY: BOJ board member Naoki Tamura speech
  • US500: Fed Chair Jerome Powell testimony

Thursday, 26th June

  • SG20: Singapore industrial production
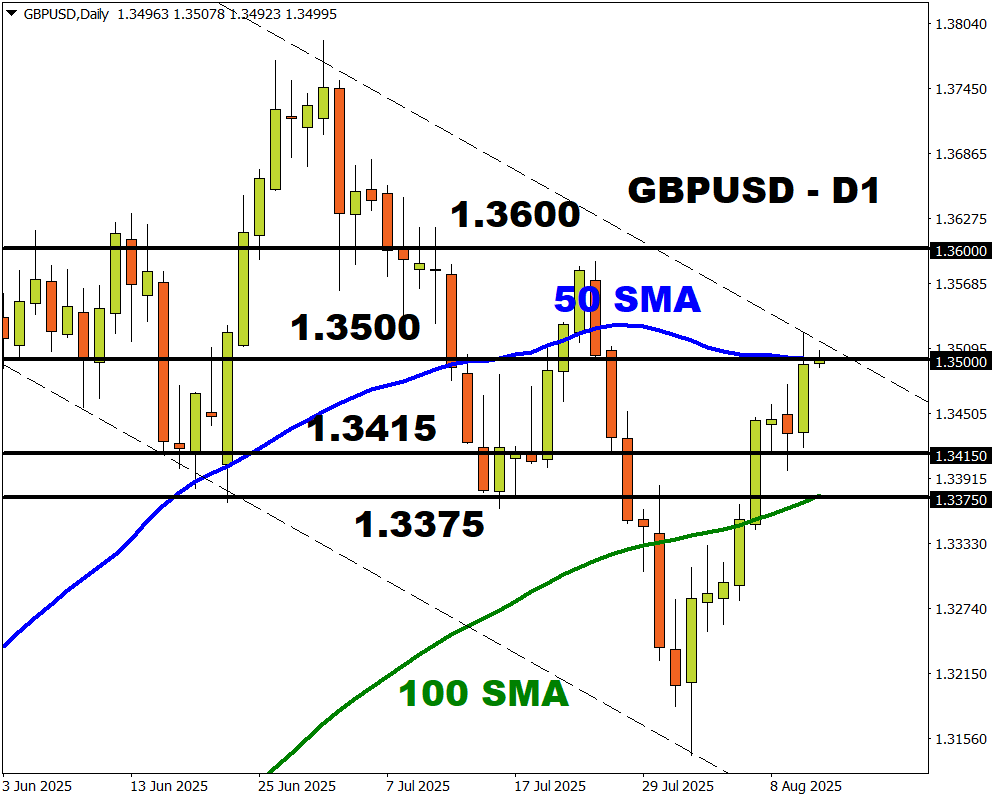
  • GBP: BOE Governor Andrew Bailey speech
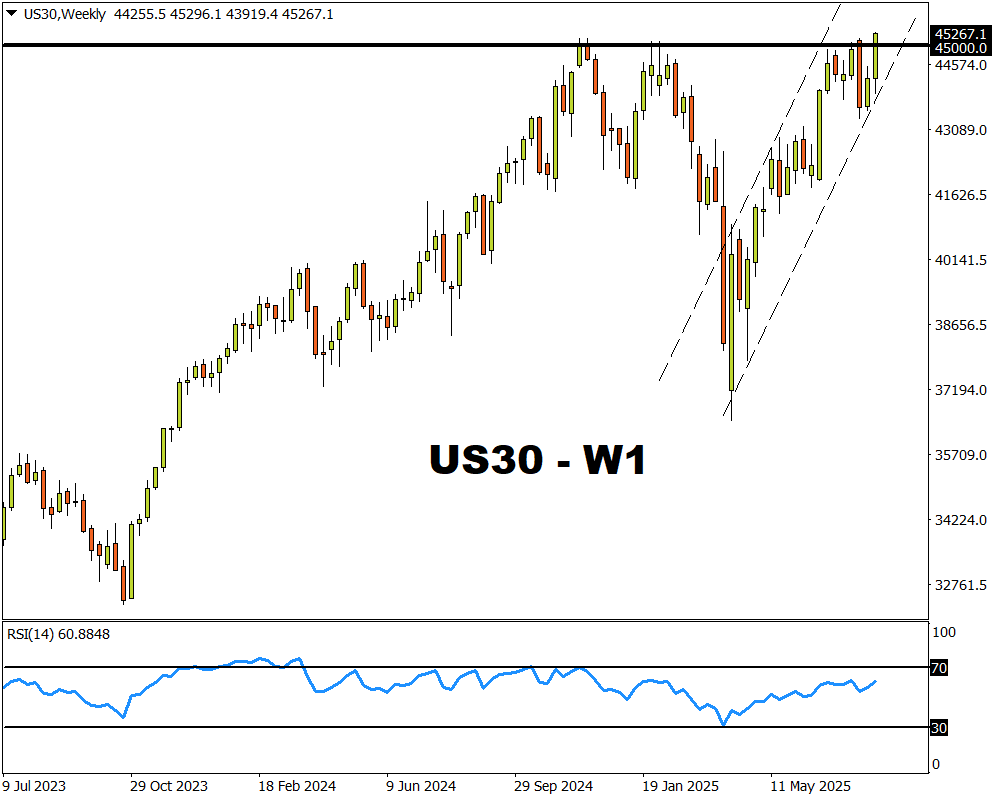
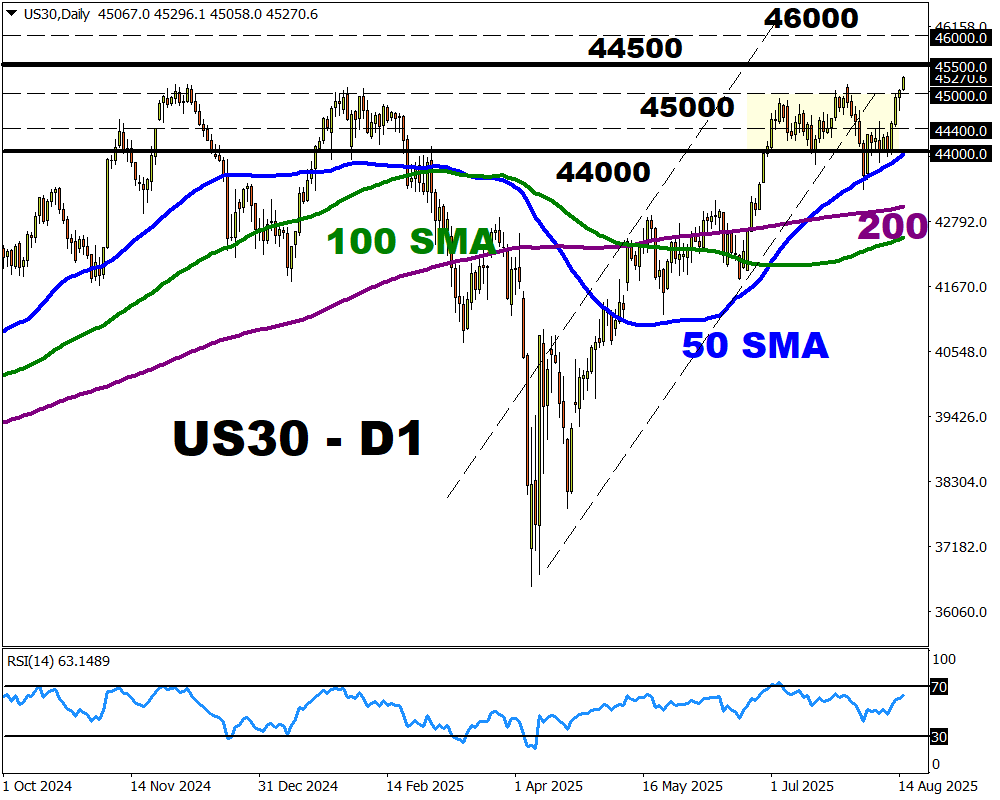
  • US30: US revised GDP, initial jobless claims, Fed speak

Friday, 27th June

  • CN50: China industrial profits
  • CAD: Canada GDP
  • EUR: Eurozone economic confidence, consumer confidence
  • JPY: Japan Tokyo CPI, unemployment, retail sales
  • US30: Fed releases annual bank stress test results
  • US500: US personal income, PCE price index, University of Michigan consumer sentiment, Fed speech

Our attention is drawn to FXTM’s US500, which has been confined within a daily range since the start of June.

Imagen
us500 4

Note: FXTM’s US500 tracks the underlying S&P 500 index

Recently, US equities have been pressured by mounting geopolitical risks, despite the Federal Reserve still penciling in two interest rate cuts for 2025.

Still, US500 is up roughly 1% this month and trading less than 3% away from its all-time high at 6151.3.


Here are 4 factors that could trigger a major breakout:


1) Ongoing Middle East conflict

Israel and Iran have exchanged missile attacks for one week after tensions escalated last Friday.

The conflict between both sides has shown no signs of cooling with investors watching whether the United States will get involved. Although Trump has delayed this decision by two weeks, any hints of potential actions could influence risk sentiment.

  • Any signs of the United States holding off on joining the Israel-Iran conflict may support risk appetite – keeping the US500 buoyed. 
  • Should expectations mount around the US attacking Iran, this may spark fears of a wider conflict. Such development may hit the US500 as risk aversion intensifies. 


2) Fed Chair Powell’s 2-day Testimony

Fed Chair Jerome Powell’s semi-annual testimony before Congress may provide key insight into future policy moves.

During June’s FOMC meeting, Powell stated that the Fed was ‘well-positioned to wait’ before moving further on rates. He also expressed concerns over the effects of tariffs on inflation.

  • Should Powell repeat the same message and strike a hawkish note, this could weigh on the US500.
  • If the Fed Chair sounds more dovish than expected and signals a rate cut in September, the US500 may rise. 


3) US May PCE report

The Fed’s preferred inflation gauge – the Core PCE could influence expectations about when the central bank will cut rates in the second half of 2025.

Markets are forecasting PCE deflators to rise in May with the core figure nudging up 2.6% year-on-year compared to 2.5% seen in the previous month. Ultimately, more signs of rising price pressure may shave bets around lower US interest rates.

Traders are currently pricing in a 68% probability of a 25-basis point cut by September.

Beyond the PCE report, it will be wise to keep an eye on speeches by a host of Fed officials and other US data, including PMI’s which may influence the US500.

US500 is forecasted to move as much as 1.3% or decline 1.0% in a 6-hour window post release.

  • The US500 may slip on signs of rising price pressures in the United States.
  • A cooler-than-expected PCE report could support the US500.


4) Technical forces

The US500 remains trapped within a range with support at 5920 and resistance at 6060.

  • A solid daily close and breakout above 6000 may open a path toward 6060 and 6151.3. 
  • Sustained weakness below 5920 may trigger a selloff toward 5850, the 200-day SMA and 100-day SMA.
Imagen
US500 6

Forex-Time-LogoArticle by ForexTime

ForexTime Ltd (FXTM) is an award winning international online forex broker regulated by CySEC 185/12 www.forextime.com

The SNB reduced the interest rate to 0%. The Norges Bank cut its interest rate for the first time in five years

By JustMarkets 

The US stock indices did not trade yesterday due to a public holiday.

The Mexican peso (MXN) weakened to 19.1 per US dollar, down from a ten-month high of 18.886 reached on June 12, as the US dollar regained strength amid expectations of easing by the Bank of Mexico and renewed geopolitical risks. The US Federal Reserve’s decision to keep rates at 4.25–4.50% and Chairman Powell’s warning that US tariffs could cause inflation boosted demand for dollars. At the same time, markets began to price in an earlier-than-expected rate cut by the Bank of Mexico, even though Mexico’s benchmark rate remains at 8.5%, which negates the carry premium that had been supporting the peso.

European stock markets were mostly down on Thursday. Germany’s DAX (DE40) fell by 1.12%, France’s CAC 40 (FR40) closed down 1.34%, Spain’s IBEX35 (ES35) lost 1.28%, and the British FTSE 100 (UK100) closed down 0.58%.

At its June meeting, the Bank of England (BoE) voted 6-3 to keep the bank rate at 4.25%, focusing on the complex backdrop of heightened global uncertainty and persistent inflationary pressures. Three members of the bank voted to cut the rate by 0.25 percentage points to 4%, although investors had expected the split to be 7–2. The Central Bank noted that consumer price inflation is likely to remain broadly at current levels until the end of the year and return to target next year.

The Swiss National Bank (SNB) lowered its key interest rate by 25 basis points to 0% in June 2025, as expected, setting the cost of borrowing at zero for the first time since the introduction of negative rates at the end of 2022. This decision was made against the backdrop of easing inflationary pressures and a deterioration in the global economic outlook. Consumer prices in Switzerland fell by 0.1% in May, the first decline in four years. The SNB currently expects average inflation of 0.2% in 2025, 0.5% in 2026, and 0.7% in 2027. In the first quarter of 2025, Switzerland’s GDP also showed strong growth, partly driven by exports to the US ahead of the introduction of new tariffs, although the underlying momentum was more modest.

At its meeting in June 2025, Norges Bank lowered its key rate by 25 basis points to 4.25%. This is the first rate cut in five years. Policymakers said that inflation had slowed since the March meeting and that it was appropriate to ease financial conditions and support economic growth. However, the Monetary Policy Committee emphasized that borrowing costs should remain sufficiently tight to prevent a resurgence of inflation. According to the latest expectations, the rate will be around 4% at the end of the year and 3% by 2028.

WTI crude oil prices slowed their growth at the start of Thursday’s session and are trading below $75 per barrel, just slightly below their five-month high, after President Trump’s statement that he would decide on US involvement in the Israeli-Iranian conflict “within two weeks” allayed fears of an immediate supply shock from the Middle East.

Asian markets were in sell-off mode yesterday. Japan’s Nikkei 225 (JP225) fell by 1.02%, China’s FTSE China A50 (CHA50) lost 0.64%, Hong Kong’s Hang Seng (HK50) decreased by 1.99%, and Australia’s ASX 200 (AU200) showed a negative result of 0.09%.

The Philippine Central Bank cut its benchmark interest rate by 25 basis points to 5.25% at its June 2025 policy meeting, the lowest level in two and a half years and in line with market expectations. BSP Governor Eli Remolona said the decision reflected a more moderate inflation outlook and the need to support growth with a more accommodative policy. Annual inflation in May 2025 fell to 1.3% from 1.4% in the previous month, matching market expectations and reaching its lowest level since November 2019. The inflation projections for 2025 was revised downward from 2.4% to 1.6%, reflecting easing price pressures.

S&P 500 (US500) 5,980.87 −1.85 (−0.03%)

Dow Jones (US30) 42,171.66 −44.14 (−0.10%)

DAX (DE40) 23,057.38 −260.43 (−1.12%)

FTSE 100 (UK100) 8,791.80 −51.67 (−0.58%)

USD Index 98.76 −0.14 (−0.14%)

News feed for: 2025.06.20

  • Japan National Core Consumer Price Index at 02:30 (GMT+3);
  • Japan Monetary Policy Meeting Minutes at 02:50 (GMT+3);
  • China PBoC Loan Prime Rate (m/m) at 04:15 (GMT+3);
  • German Producer Price Index (m/m) at 09:00 (GMT+3);
  • UK Retail Sales (m/m) at 09:00 (GMT+3);
  • Japan BOJ Gov Ueda Speaks at 09:40 (GMT+3);
  • Canada Retail Sales (m/m) at 15:30 (GMT+3);
  • US Philadelphia Fed Manufacturing Index (m/m) at 15:30 (GMT+3).

By JustMarkets


This article reflects a personal opinion and should not be interpreted as an investment advice, and/or offer, and/or a persistent request for carrying out financial transactions, and/or a guarantee, and/or a forecast of future events.

The US Federal Reserve left interest rates unchanged. The Riksbank lowered its interest rate by 0.25%

By JustMarkets 

At the end of the trading day, the Dow Jones Index (US30) fell by 0.10%. The S&P 500 Index (US500) fell by 0.03%. The Nasdaq (US100) Technology Index closed higher by 0.01%. Investors reacted to the Federal Reserve’s decision to leave interest rates unchanged and Fed Chairman Powell’s cautious tone amid growing geopolitical and economic uncertainty. Powell emphasized the Fed’s wait-and-see stance, citing uncertainty about the inflationary impact of President Trump’s tariffs and the risk of stagflation. Officials expect two rate cuts in 2025 but lowered growth expectations and raised inflation expectations.

Initial jobless claims in the US fell by 5,000 from the previous week to 245,000 for the week ending June 14, in line with market expectations, but held on to recent gains and were the fifth-highest reading since August 2023. At the same time, the number of applications for unemployment benefits in the previous week was 1,945,000, remaining at a more than three-year high of 1,951,000 recorded in the last week of May. The results reinforced the view that the US labor market is softening after initially resisting the economic uncertainty this year.

Visa, Mastercard, and PayPal each fell more than 4% after Congress passed the stablecoin bill.

In June, the Canadian dollar weakened to 1.37 per US dollar, retreating from its strongest level in eight months of 1.357, recorded on June 16. Expectations of a divergence in monetary policy with the US, weaker commodity prices, and geopolitical safe-haven flows undermined its recent gains. Traders are now pricing in more aggressive easing by the Bank of Canada compared to the Fed, which is narrowing the yield differential and undermining the loonie’s advantage.

European stock markets traded mixed on Wednesday. Germany’s DAX (DE40) fell by 0.50%, France’s CAC 40 (FR40) closed down by 0.36%, the Spanish IBEX35 (ES35) rose by 0.08%, and the British FTSE 100 (UK100) closed positive 0.08%. The annual core inflation rate in the Eurozone, excluding energy, food, alcohol, and tobacco prices, fell to 2.3% in May 2025 from 2.7% in the previous month, which was in line with preliminary estimates and below the market’s initial expectations of 2.5%. Although this figure remained above the 2% target, it was the lowest since October 2021, reinforcing calls from dovish members of the European Central Bank’s Governing Council for monetary policy easing and addressing growth concerns.

Sweden’s Riksbank cut its key interest rate by 25 basis points to 2% in June, in line with expectations, as the country’s economic recovery slows and inflation declines. Recent data points to weak growth and persistently high unemployment. The future course of monetary policy will depend on new data and how it affects inflation and growth expectations.

WTI oil prices fell more than 1% to $73.7 per barrel on Wednesday after rising to $76 at the start of the session, as President Trump hinted at the possibility of dialogue with Iran, easing fears of an inevitable conflict. While tensions remain high amid ongoing Iranian-Israeli military action, Trump refused to confirm plans for a US strike and said Iran had come to the negotiating table, although he called it “very late”.

Asian markets traded without a single trend yesterday. Japan’s Nikkei 225 (JP225) rose by 0.90%, China’s FTSE China A50 (CHA50) added 0.07%, Hong Kong’s Hang Seng (HK50) fell by 1.12%, and Australia’s ASX 200 (AU200) showed a negative result of 0.12%.

On June 19, the Hong Kong Monetary Authority (HKMA) left its base rate unchanged at 4.75%, echoing the US Federal Reserve’s decision to keep its base rate at 4.25–4.50% for the fourth consecutive meeting, despite pressure from President Trump to lower rates. The HKMA’s policy remains in line with that of the Fed due to the Hong Kong dollar’s peg to the US currency.

Bank Indonesia kept its base interest rate unchanged at 5.5% at its June 2025 policy meeting, following a 25 bps cut in May, in line with market expectations. This decision was supported by lower inflation, stability in the rupiah exchange rate, and ongoing efforts to sustain economic growth. In May 2025, annual inflation fell to 1.60% from an eight-month high of 1.95% in April.

The Australian dollar fell to $0.648 on Thursday, reversing the previous session’s significant gains, after labor market data reinforced the Reserve Bank of Australia’s view that monetary policy needs to be eased. Markets now see an 80% chance that the RBA will cut its key interest rate from 3.85% to 3.6% at its July 8 meeting, with two more cuts expected later this year.

S&P 500 (US500) 5,980.87 −1.85 (−0.03%)

Dow Jones (US30) 42,171.66 −44.14 (−0.10%)

DAX (DE40) 23,317.81 −116.84 (−0.50%)

FTSE 100 (UK100) 8,843.47 +9.44 (+0.11%)

USD Index 98.88 +0.06 (+0.06%)

News feed for: 2025.06.19

  • New Zealand QDP (q/q) at 01:45 (GMT+3);
  • Australia Unemployment Rate (m/m) at 04:30 (GMT+3);
  • Switzerland Trade Balance (m/m) at 09:00 (GMT+3);
  • Switzerland SNB Interest Rate Decision at 10:30 (GMT+3);
  • Switzerland SNB Monetary Policy Assessment at 10:30 (GMT+3);
  • Norway Norges Bank Interest Rate Decision (m/m) at 11:00 (GMT+3);
  • Switzerland SNB Press Conference at 11:00 (GMT+3);
  • UK BoE Interest Rate Decision at 14:00 (GMT+3);
  • UK BoE MPC Meeting Minutes at 14:00 (GMT+3).

By JustMarkets


This article reflects a personal opinion and should not be interpreted as an investment advice, and/or offer, and/or a persistent request for carrying out financial transactions, and/or a guarantee, and/or a forecast of future events.

Environmental Co. Report Uncovers Fertilizer Technology Breakthrough

Source: Streetwise Reports (6/17/25)

Advanced organic waste treatment and resource recovery company Bion Environmental Technologies Inc. (BNET:OTCQB) says it has completed the technology-optimization report for its Ammonia Recover System (ARS) at Fair Oaks Indiana. Find out how the company expects to use its technology in the organic food sector.

Advanced organic waste treatment and resource recovery company Bion Environmental Technologies Inc. (BNET:OTCQB) announced it has completed the technology-optimization report for its Ammonia Recover System (ARS) at Fair Oaks Indiana.

The optimized ARS proved it remains stable and can sustain continuous steady-state functions; it operates reliably; and is scalable. The ARS also displayed its capability to reach ammonia reduction objectives by evaporating one-third less water than was projected and modeled. This results in substantially improved economics, including reduced production costs for the premium nitrogen fertilizers the ammonia is upcycled into.

“As we have indicated for some time, the ARS has exceeded our expectations. This report details by just how much,” said Chief Executive Officer Craig Scott. “We are now sorting through and evaluating dozens of potential projects and partners to find the best fit to fill our initial fertilizer offtake agreements. Our goal is to identify a project (or projects) that will allow us to supply our unique organic nitrogen fertilizer to growers during the 2026 growing season.”

The report outlines over a decade of ARS concept advancement and technology R&D, emphasizing what was accomplished during the optimization phase at Fair Oaks. Bion enlisted Buflovak, a New York engineering company, as its ARS development collaborator, due to their specialized expertise in evaporation, distillation, and separation processes. The Buflovak engineering team participated closely during six years of ARS R&D and testing, including offering guidance during the 18-month optimization phase at Fair Oaks, and a final review of the report. The Buflovak engineering team remains available to discuss the report and its findings.

Economics were not assessed during optimization, but Bion noted in a release that the considerable operational improvements that were achieved, during that phase, directly impact modeled system economics and fertilizer manufacturing expenses.

The Fair Oaks findings indicate operating expenses for a full-scale commercial system will be approximately 25% lower than previously modeled, with a corresponding reduction in fertilizer manufacturing costs. Modeled capital expense, either overall or as a function of fertilizer or treatment capacity, will decrease substantially, as well.

The Most Rapidly Expanding Area of US Agriculture

The organic food sector represents the most rapidly expanding area of U.S. agriculture, based on the U.S. Department of Agriculture. Nevertheless, something commonly referred to as the “organic yield gap” can reduce the productivity of these operations.

An absence of an affordable, organic (but readily-available) nitrogen, similar to the synthetic nitrogen fertilizer utilized in traditional farming, constitutes a major factor why organic agriculture generates fewer pounds per acre. Organic growers can’t afford the organic nitrogen that gives that additional “boost” of late-season development and growth that traditional crops get — that’s why organic fruit and produce tends to be smaller, the company stated. It also results in a greater carbon footprint per pound for organic foods.

Bion’s ARS handles and treats livestock waste flows in order to isolate and capture the ammonia (organic nitrogen) that is also released during biogas production in an anaerobic digester. The ARS is the foundation of the company’s Gen3Tech technology, which generates renewable energy, nutrients, and clean water from livestock waste flows. Instead of that ammonia being lost and polluting the environment, the ARS repurposes it into low-carbon and organic nitrogen fertilizers. By using only the compounds in the waste stream itself, the nitrogen remains organic, giving organic growers the late-season nitrogen they need to enhance yields.

Last summer, Bion revealed its “pure” commercial nitrogen fertilizer, manufactured from livestock waste, was OMRI-listed for use in organic production. Bion’s ammonium bicarbonate fertilizer constitutes a partially-stabilized source of nitrogen, upcycled from reactive ammonia in organic waste streams through a patented process. OMRI operates as an international nonprofit organization that lists products permitted for use in organic production under the USDA’s National Organic Program.

Protecting Surface Waters, Aquifers, the Atmosphere

Bion stated its methodology will diminish the carbon footprint linked with organic systems and “significantly reduce nitrogen runoff and off-gassing to protect surface waters, aquifers, and the atmosphere. It can quickly bring soil microbes in organic systems back to a healthy and productive balance and reduce the yield gap of organic crops as compared to conventional.”

An organic fertilizer, manure is conventionally administered to farmland before planting occurs. The volatile ammonia-nitrogen it holds — approximately 75% of the fertilizer’s nitrogen/nutrient value — typically escapes to pollute the environment. However, Bion stated its patented ARS technology focuses on this volatile and highly mobile ammonia nitrogen, stabilizes it with carbon dioxide also in the waste flow, and transforms it into ammonium bicarbonate, a 100% soluble nitrogen fertilizer that can be easily absorbed by plants and administered to organic crops.

“It is pathogen-free,” the company stated. “So, unlike manure, it can be applied at any time in the plant growth cycle.”

Bion stated it anticipates further economic improvements as the ARS is expanded to full commercial scale. “While engineering challenges are expected, Bion believes those risks are substantially mitigated because the ARS platform and the processes it uses perform better at larger scale,” it stated. Bion also said, “Over the next several months, we intend to evaluate additional modifications to the ARS we believe could dramatically reduce system capital costs and operating expenses.”

Bion stated the engineering report, produced with guidance and review from Bion’s engineering partner, along with the OMRI Listing, should allow it to advance with strategic relationships in the fertilizer industry.

The Catalyst: Europe Ahead of the US

Based on a report from Markets and Markets, the marketplace size for organic fertilizers is valued at US$7.9 billion in 2024 and is projected to expand at a compound annual growth rate (CAGR) of 11.5% through 2029 to reach US$13.6 billion.

“The rising preference for environmentally conscious food fuels the growth of the organic fertilizers industry,” the report said. “This transition underscores a wider dedication to sustainable farming methods and reducing ecological damage.”

Governments worldwide are responding to this transformation by implementing regulations and incentives to promote organic farming, enhancing the demand for organic fertilizers, Markets and Markets stated.

The global marketplace for biogas is projected to expand by US$19.51 billion from 2024-2028 at a CAGR of 6.01%, based on a report by Technavio.

Europe is significantly ahead of America regarding utilizing the technology to handle organic wastes. In a 2022 report by Waste 360, there were approximately 17,500 such facilities in the European Union in 2016 and fewer than 350 in the U.S. A 2024 article by Ecohaz showed there were almost 20,000 biogas plants in Europe at the time of the report. However, America is making moves to catch up.

A February 2025 report by the American Biogas Council reported that 2024 saw record numbers in the sector. The report noted that “In the 12 months ending in December, 125 new biogas projects came online, representing over US$3 billion in new U.S. investments. New projects in 2024 exceeded new projects in 2023 by 17%, while total investment in those projects increased by 40% compared to investment in projects opened in the previous year.” This brought the total of U.S.-based biogas facilities to almost 2,500.

Scott observed that it’s a resource that’s being squandered. “Farmers buy synthetic nitrogen fertilizer all day long to replace what is lost out of the nitrogen cycle. We upcycle what’s already here, and it’s more valuable because it is organic. You’ve got one of two choices: either lose it to atmosphere and runoff, where it becomes pretty nasty air and water pollution, or capture it, harness it, and repurpose it, and add value to your operations,” he said.

Ownership and Share Structure 

According to Refinitiv, about 20% of Bion Environmental is owned by management and insiders.

About 1.24% is with Centerpoint Corp. with 0.70 million shares. Less than 1% is held by institutions.

The rest is with retail.

Bion has a market cap of US$11.34 million. Trading over the past 52 weeks ranged from US$0.04 per share to US$0.57.


Important Disclosures:

  1. As of the date of this article, officers and/or employees of Streetwise Reports LLC (including members of their household) own securities of Bion Environmental Technologies Inc.
  2. Steve Sobek wrote this article for Streetwise Reports LLC and provides services to Streetwise Reports as an employee.
  3. This article does not constitute investment advice and is not a solicitation for any investment. Streetwise Reports does not render general or specific investment advice and the information on Streetwise Reports should not be considered a recommendation to buy or sell any security. Each reader is encouraged to consult with his or her personal financial adviser and perform their own comprehensive investment research. By opening this page, each reader accepts and agrees to Streetwise Reports’ terms of use and full legal disclaimer. Streetwise Reports does not endorse or recommend the business, products, services or securities of any company.

For additional disclosures, please click here.

Escalating tensions in the Middle East continue to put pressure on markets. Silver reaches 13-year high

By JustMarkets

The US stocks fell on Tuesday as investors closely monitored escalating tensions in the Middle East, where the Israeli-Iranian conflict has been ongoing for five days. At the end of the trading day, the Dow Jones (US30) Index fell by 0.70%. The S&P 500 (US500) Index fell by 0.84%. The Nasdaq (US100) Technology Index closed lower by 0.91%. President Trump stepped up his rhetoric, demanding Iran’s “unconditional surrender” and warning of a possible strike against Supreme Leader Khamenei in a series of posts on the Truth social network.

At the same time, disappointing US retail sales data, which fell by 0.9% in May, signaled a slowdown in consumer growth, and that tariffs may have a huge impact on the economy.

Today, Federal Reserve officials will give their views on the future path of interest rates, as well as how tariffs and unrest in the Middle East will affect the economy. Although an immediate change in interest rates seems unlikely, the Fed meeting, which ends on Wednesday, will provide important signals that could still influence the markets. Among the most significant points to watch will be whether Federal Open Market Committee members stick to their previous expectations of two rate cuts this year.

Minutes from the meeting show that earlier this month, senior Bank of Canada officials considered the possibility of lowering interest rates. The main source of uncertainty — and the biggest threat facing the Canadian economy — is the trade conflict initiated by the United States. The Bank of Canada’s next interest rate decision is scheduled for July 30.

Stock markets in Europe were mostly lower on Tuesday. The German DAX (DE40) fell by 1.12%, the French CAC 40 (FR40) closed down 0.76%, the Spanish IBEX35 (ES35) lost 1.41%, and the British FTSE 100 (UK100) closed down 0.46%.

WTI oil prices rose by 4.3% to $74.8 per barrel on Tuesday as escalating tensions between the US and Iran reignited concerns about supplies. US President Donald Trump demanded Iran’s “unconditional surrender” and directly threatened Supreme Leader Ayatollah Ali Khamenei. According to Goldman Sachs, any attempt by Iran to block the Strait of Hormuz, a key point on the global oil supply route, could lead to a sharp rise in prices above $100.

On Wednesday, silver prices rose above $37.20 per ounce, reaching their highest level since 2012, driven by high industrial demand, persistent supply shortages, and increased purchases of the safe-haven metal amid geopolitical uncertainty. The expanding use of this metal in solar energy, electronics, and broader electrification trends now accounts for more than half of global demand, reinforcing its long-term structural importance. On the supply side, the silver market has been in deficit for the fifth consecutive year.

Asian markets traded without a single trend yesterday. Japan’s Nikkei 225 (JP225) rose by 0.59%, China’s FTSE China A50 (CHA50) added 0.01%, Hong Kong’s Hang Seng (HK50) fell by 0.34%, and the Australian ASX 200 (AU200) showed a negative result of 0.08%.

In New Zealand, attention this week is focused on the first quarter GDP report, which will be released on Thursday. Analysts expect the economy to expand by 0.7% on a quarterly basis but contract by 0.8% on an annual basis. On the policy front, the Reserve Bank of New Zealand has already signaled that its aggressive easing campaign is coming to an end, and markets are expecting a final rate cut later this year.

The Australian dollar strengthened to $0.649 on Wednesday, recouping some of the previous session’s losses, as rising oil prices caused by heightened geopolitical tensions supported demand for commodity-linked currencies. Market jitters intensified as the conflict between Israel and Iran entered its sixth day and President Trump demanded Iran’s unconditional surrender and hinted at possible US intervention. In response, oil prices continued to rise, supporting the Australian dollar, as it is strongly correlated with commodity markets.

S&P 500 (US500) 5,982.72 −50.39 (−0.84%)

Dow Jones (US30) 42,215.80 −299.29 (−0.70%)

DAX (DE40) 23,434.65 −264.47 (−1.12%)

FTSE 100 (UK100) 8,834.03 −41.19 (−0.46%)

USD Index 98.82 +0.82 (+0.84%)

News feed for: 2025.06.18

  • Japan Trade Balance (m/m) at 02:50 (GMT+3);
  • UK Consumer Price Index (m/m) at 09:00 (GMT+3);
  • UK Producer Price Index (m/m) at 09:00 (GMT+3);
  • Indonesian IB Interest Rate Decision (m/m) at 10:30 (GMT+3);
  • Sweden Riksbank Rate Decision (m/m) at 10:30 (GMT+3);
  • Eurozone Consumer Price Index (m/m) at 12:00 (GMT+3);
  • US Initial Jobless Claims (w/w) at 15:30 (GMT+3);
  • US Building Permits (m/m) at 15:30 (GMT+3);
  • US Crude Oil Reserves (w/w) at 17:30 (GMT+3);
  • Canada BOC Gov Macklem Speaks at 18:15 (GMT+3);
  • US Natural Gas Storage (w/w) at 19:00 (GMT+3);
  • US Federal Funds Rate at 21:00 (GMT+3);
  • US FOMC Economic Projections at 21:00 (GMT+3);
  • US FOMC Statement at 21:00 (GMT+3);
  • US FOMC Press Conference at 21:30 (GMT+3).

By JustMarkets


This article reflects a personal opinion and should not be interpreted as an investment advice, and/or offer, and/or a persistent request for carrying out financial transactions, and/or a guarantee, and/or a forecast of future events.

How was the wheel invented? Computer simulations reveal the unlikely birth of a world-changing technology nearly 6,000 years ago

By Kai James, Georgia Institute of Technology 

Imagine you’re a copper miner in southeastern Europe in the year 3900 B.C.E. Day after day you haul copper ore through the mine’s sweltering tunnels.

You’ve resigned yourself to the grueling monotony of mining life. Then one afternoon, you witness a fellow worker doing something remarkable.

With an odd-looking contraption, he casually transports the equivalent of three times his body weight on a single trip. As he returns to the mine to fetch another load, it suddenly dawns on you that your chosen profession is about to get far less taxing and much more lucrative.

What you don’t realize: You’re witnessing something that will change the course of history – not just for your tiny mining community, but for all of humanity.

AI-generated image of a wheeled cart inside a mine tunnel.
An illustration of what the original mine carts used in the Carpathian mountains may have looked like in 3900 B.C.E.
Kai James via DALL·E

Despite the wheel’s immeasurable impact, no one is certain as to who invented it, or when and where it was first conceived. The hypothetical scenario described above is based on a 2015 theory that miners in the Carpathian Mountains – in present-day Hungary – first invented the wheel nearly 6,000 years ago as a means to transport copper ore.

The theory is supported by the discovery of more than 150 miniaturized wagons by archaeologists working in the region. These pint-sized, four-wheeled models were made from clay, and their outer surfaces were engraved with a wickerwork pattern reminiscent of the basketry used by mining communities at the time. Carbon dating later revealed that these wagons are the earliest known depictions of wheeled transport to date.

This theory also raises a question of particular interest to me, an aerospace engineer who studies the science of engineering design. How did an obscure, scientifically naive mining society discover the wheel, when highly advanced civilizations, such as the ancient Egyptians, did not?

A controversial idea

It has long been assumed that wheels evolved from simple wooden rollers. But until recently no one could explain how or why this transformation took place. What’s more, beginning in the 1960s, some researchers started to express strong doubts about the roller-to-wheel theory.

After all, for rollers to be useful, they require flat, firm terrain and a path free of inclines and sharp curves. Furthermore, once the cart passes them, used rollers need to be continually brought around to the front of the line to keep the cargo moving. For all these reasons, the ancient world used rollers sparingly. According to the skeptics, rollers were too rare and too impractical to have been the starting point for the evolution of the wheel.

But a mine – with its enclosed, human-made passageways – would have provided favorable conditions for rollers. This factor, among others, compelled my team to revisit the roller hypothesis.

Flow chart showing the key stages of the evolution from rollers to wheels.
Key stages in the evolution of the first wheels, beginning from simple rollers and eventually arriving at a wheel-and-axle structure in which a slender axle is connected to large solid discs, or wheels, on both ends.
Kai James

A turning point

The transition from rollers to wheels requires two key innovations. The first is a modification of the cart that carries the cargo. The cart’s base must be outfitted with semicircular sockets, which hold the rollers in place. This way, as the operator pulls the cart, the rollers are pulled along with it.

This innovation may have been motivated by the confined nature of the mine environment, where having to periodically carry used rollers back around to the front of the cart would have been especially onerous.

The discovery of socketed rollers represented a turning point in the evolution of the wheel and paved the way for the second and most important innovation. This next step involved a change to the rollers themselves. To understand how and why this change occurred, we turned to physics and computer-aided engineering.

Simulating the wheel’s evolution

To begin our investigation, we created a computer program designed to simulate the evolution from a roller to a wheel. Our hypothesis was that this transformation was driven by a phenomenon called “mechanical advantage.” This same principle allows pliers to amplify a user’s grip strength by providing added leverage. Similarly, if we could modify the shape of the roller to generate mechanical advantage, this would amplify the user’s pushing force, making it easier to advance the cart.

Our algorithm worked by modeling hundreds of potential roller shapes and evaluating how each one performed, both in terms of mechanical advantage and structural strength. The latter was used to determine whether a given roller would break under the weight of the cargo. As predicted, the algorithm ultimately converged upon the familiar wheel-and-axle shape, which it determined to be optimal.

This diagram shows twelve illustrations, progressing from images of rollers to a wheel-and-axle structure.
A computer simulation of the evolution from a roller to a wheel-and-axle structure. Each image represents a design evaluated by the algorithm. The search ultimately converges upon the familiar wheel-and-axle design.
Kai James

During the execution of the algorithm, each new design performed slightly better than its predecessor. We believe a similar evolutionary process played out with the miners 6,000 years ago.

It is unclear what initially prompted the miners to explore alternative roller shapes. One possibility is that friction at the roller-socket interface caused the surrounding wood to wear away, leading to a slight narrowing of the roller at the point of contact. Another theory is that the miners began thinning out the rollers so that their carts could pass over small obstructions on the ground.

Either way, thanks to mechanical advantage, this narrowing of the axle region made the carts easier to push. As time passed, better-performing designs were repeatedly favored over the others, and new rollers were crafted to mimic these top performers.

Consequently, the rollers became more and more narrow, until all that remained was a slender bar capped on both ends by large discs. This rudimentary structure marks the birth of what we now refer to as “the wheel.”

According to our theory, there was no precise moment at which the wheel was invented. Rather, just like the evolution of species, the wheel emerged gradually from an accumulation of small improvements.

This is just one of the many chapters in the wheel’s long and ongoing evolution. More than 5,000 years after the contributions of the Carpathian miners, a Parisian bicycle mechanic invented radial ball bearings, which once again revolutionized wheeled transportation.

Ironically, ball bearings are conceptually identical to rollers, the wheel’s evolutionary precursor. Ball bearings form a ring around the axle, creating a rolling interface between the axle and the wheel hub, thereby circumventing friction. With this innovation, the evolution of the wheel came full circle.

This example also shows how the wheel’s evolution, much like its iconic shape, traces a circuitous path – one with no clear beginning, no end, and countless quiet revolutions along the way.The Conversation

About the Author:

Kai James, Professor of Aerospace Engineering, Georgia Institute of Technology

This article is republished from The Conversation under a Creative Commons license. Read the original article.


 

Optimism about easing geopolitical tensions boosted investor sentiment

By JustMarkets 

At the end of Monday, the Dow Jones Industrial Average (US30) Index rose by 0.75%. The S&P 500 (US500) Index rose by 0.94%. The Nasdaq (US100) Technology Index closed higher by 1.42%. The US stocks rose on Monday as optimism about easing geopolitical tensions boosted investor sentiment, while attention shifted to the Federal Reserve’s decision on Wednesday, with markets widely expecting rates to remain unchanged. These reports reinforced hopes for an end to the Iran-Israel conflict, which led to lower oil prices and triggered a rise in risk appetite.

The US Federal Reserve will begin a two-day meeting on Tuesday, and interest rates are expected to remain unchanged at around 4.5% following the meeting on Wednesday. However, the main focus will be on whether the Central Bank will signal future rate cuts, especially given falling inflation in the US and signs of an economic slowdown. Until now, the Central Bank has largely maintained that interest rates will remain unchanged in the near term. However, weak inflation data in recent months, combined with signs of a cooling labor market and slowing economic growth, have fueled bets that the Fed may change its tone in the coming months.

The Mexican peso (MXN) strengthened to 18.90 per US dollar, its strongest level since August, amid a broad sell-off of the dollar and hawkish expectations regarding the Bank of Mexico. Domestically, an unexpected rise in core inflation to 4.42% in May prompted Bank of Mexico policymakers to advocate for a pause in the easing cycle, contingent on data, which bolstered support for the peso’s yield.

In June, the Canadian dollar (CAD) strengthened to 1.35 per US dollar, its strongest level in eight months, as a broad sell-off in the US dollar coincided with rising crude oil prices. The rise in oil prices directly increased Canada’s energy export revenues, which provided strong support for the loonie. Investors are also paying attention to the G7 summit, where coordinated measures will be taken to resolve global issues, from the Middle East and Ukraine to trade frictions, as well as a tense week of decisions by central banks.

European stock markets were mostly up on Monday. The German DAX (DE40) rose by 0.78%, the French CAC 40 (FR40) closed up 0.75%, the Spanish IBEX35 (ES35) jumped 1.44%, and the British FTSE 100 (UK100) closed positive 0.28%. European stocks closed with solid gains yesterday, ending five consecutive sessions of losses, as easing concerns that military action between Israel and Iran could disrupt the global economy lifted stocks around the world. Reports indicated that Tehran was ready to resume nuclear talks with the United States to demonstrate its willingness to de-escalate the exchange of blows with Israel, raising hopes that the conflict would not hamper global economic activity and energy prices. Markets also positioned themselves in anticipation of important monetary policy decisions this week, chief among them those of the Bank of England, the SNB, the Riksbank, Norges Bank, as well as the Fed and the Bank of Japan outside Europe.

On Monday, the Swiss government lowered its growth expectations for 2025 and 2026 as the export-oriented economy braces for the fallout from the global trade war. The Swiss economy, traditionally one of the most stable in Europe, is expected to grow by 1.3% in 2025, down from the government’s March expectations of 1.4%.

WTI oil prices fell by 1.7% to $71.80 per barrel on Monday, pausing a sharp 7% rise on Friday as reports emerged that Iran was seeking to ease tensions with Israel and resume nuclear talks. The decline followed an overnight surge to $77.49 after Israeli strikes on Iran’s South Pars gas field and an oil storage facility near Tehran. Despite the flare-up, market sentiment improved on hopes that the conflict would be contained and not cause significant damage to energy infrastructure or key shipping routes. Traffic through the Strait of Hormuz declined only slightly: 111 ships passed through on June 15, compared with 116 on June 12, indicating minimal disruption to oil supplies. Analysts expect the conflict to be short-lived and to help prevent further price spikes.

Asian markets mostly rose yesterday. Japan’s Nikkei 225 (JP225) rose by 1.26%, the Chinese FTSE China A50 (CHA50) gained 0.23%, the Hong Kong Hang Seng (HK50) added 0.70%, and the Australian ASX 200 (AU200) showed a positive result of 0.01%.

At its June meeting, the Bank of Japan left its key short-term interest rate unchanged at 0.5%, keeping it at its highest level since 2008, in line with market expectations. The unanimous decision underscored the Central Bank’s cautious stance amid escalating geopolitical risks and ongoing uncertainty over US tariff policy, which continues to pose a threat to global economic growth. Meanwhile, as part of its gradual policy normalization, the Bank of Japan confirmed its plan to reduce purchases of Japanese government bonds by 400 billion yen each quarter until March 2026.

S&P 500 (US500) 6,033.11 +56.14 (0.94%)

Dow Jones (US30) 42,515.09 +317.30 (0.75%)

DAX (DE40) 23,699.12 +182.89 (0.78%)

FTSE 100 (UK100) 8,875.22 +24.59 (0.28%)

USD Index 98.13 -0.01 (-0.01%)

News feed for: 2025.06.17

  • Japan BoJ Interest Rate Decision at 06:00 (GMT+3);
  • Japan BoJ Rate Statement at 06:00 (GMT+3);
  • Japan BoJ Press Conference at 07:30 (GMT+3);
  • German ZEW Economic Sentiment (m/m) at 12:00 (GMT+3);
  • Eurozone ZEW Economic Sentiment (m/m) at 12:00 (GMT+3);
  • US Retail Sales (m/m) at 15:30 (GMT+3);
  • US Industrial Production (m/m) at 16:15 (GMT+3).

By JustMarkets


This article reflects a personal opinion and should not be interpreted as an investment advice, and/or offer, and/or a persistent request for carrying out financial transactions, and/or a guarantee, and/or a forecast of future events.

Risk appetite has fallen sharply amid the conflict between Israel and Iran

By JustMarkets 

The US stocks fell sharply on Friday amid weakening risk appetite after Iran condemned Israel’s airstrikes as a “declaration of war” and responded with missile strikes. The strikes targeted Iran’s nuclear and military facilities, significantly increasing geopolitical tensions and causing concern in global markets. At the end of Friday, the Dow Jones Index (US30) fell by 1.79% (-1.38% for the week). The S&P 500 (US500) Index fell by 1.13% (-0.46% for the week). The Nasdaq (US100) Technology Index closed lower by 1.29% (-0.68% for the week). Financial and technology companies led the losses: Nvidia fell by 2.1%, Apple declined by 1.4%, and Visa and Mastercard fell by more than 4%. Airline stocks also fell: American, Delta, and United declined by 4.5–5%. Meanwhile, energy and defense stocks did well as oil prices jumped nearly 7%. On the other hand, inflation expectations showed a noticeable improvement: inflation expectations for the year ahead fell sharply to 5.1% in June from 6.6% in May, while long-term inflation expectations fell for the second month in a row, dropping to 4.1% from 4.2%.

European stock markets were mostly down on Friday. The German DAX (DE40) fell by 1.07% (-3.03% for the week), the French CAC 40 (FR40) closed down 1.04% (-1.43% for the week), the Spanish IBEX35 (ES35) lost 1.27% (-2.23% for the week), and the British FTSE 100 (UK100) closed down 0.39% (+0.14% for the week). The Eurozone trade surplus in April 2025 fell to €9.9 billion from €13.6 billion a year earlier and was below market expectations of €18.2 billion. This also marked a sharp decline from March’s record high of €37.3 billion, with the decline mainly due to a sharp reduction in the chemical products surplus following the introduction of new US tariffs. European stock markets opened cautiously on Monday as investors monitored the escalating conflict between Israel and Iran, which risks escalating into a broader regional crisis. Military action continued over the weekend, with both countries striking energy infrastructure, causing oil prices to rise further. Iran also warned that it could block the Strait of Hormuz, a key bottleneck for global oil supplies.

The Swiss franc traded at around 0.81 per US dollar, close to its highest levels since 2011, amid a broad flight to safety triggered by escalating tensions in the Middle East. In addition to geopolitical risk, several other factors contributed to the strengthening of the franc, which has risen by about 10% this year. These include uncertainty over President Trump’s trade policy and a broad weakening of the dollar caused by lower inflation data and growing concerns about the US economic and fiscal outlook. Domestically, the Swiss National Bank (SNB) may soon reintroduce negative interest rates. Markets widely expect the SNB to cut its key rate this week.

WTI oil prices jumped by 7.2% on Friday and settled just below $73 per barrel on Friday. On Monday, oil prices continued to rise to $75 per barrel. Israel launched an attack on the giant South Pars gas field in the Persian Gulf over the weekend, forcing the production platform to shut down, following airstrikes on Iran’s nuclear facilities and military leadership last week. Although the strikes have not yet led to a halt in Iranian oil exports, markets fear the worst-case scenario, in which Tehran disrupts supplies through the Strait of Hormuz, a vital shipping route.

Asian markets were mostly down last week. Japan’s Nikkei 225 (JP225) fell 0.51%, China’s FTSE China A50 (CHA50) declined 0.29%, Hong Kong’s Hang Seng (HK50) fell 0.35%, and Australia’s ASX 200 (AU200) showed a positive result of 0.10% over the past week. Hong Kong stocks are down for the third consecutive session, despite strong economic data from China. Mainland retail sales in May grew at their fastest pace in 15 months, while industrial production grew at its slowest pace in six months, and the unemployment rate fell to a six-month low.

S&P 500 (US500) 5,976.97 −68.29 (−1.13%)

Dow Jones (US30) 42,197.79 −769.83 (−1.79%)

DAX (DE40) 23,516.23 −255.22 (−1.07%)

FTSE 100 (UK100) 8,850.63 −34.29 (−0.39%)

USD Index 98.14 +0.22 (+0.22%)

News feed for: 2025.06.16

  • China Industrial Production (m/m) at 05:00 (GMT+3);
  • China Retail Sales (m/m) at 05:00 (GMT+3);
  • China Unemployment Rate (m/m) at 05:00 (GMT+3);
  • Switzerland Producer Price Index (m/m) at 09:30 (GMT+3).

By JustMarkets


This article reflects a personal opinion and should not be interpreted as an investment advice, and/or offer, and/or a persistent request for carrying out financial transactions, and/or a guarantee, and/or a forecast of future events.

You’re probably richer than you think because of the safety net – but you’d have more of that hidden wealth if you lived in Norway

By Robert Manduca, University of Michigan 

How wealthy are you?

Like most people, you probably would do some math before answering this question. You would add up the money in your bank accounts, the value of your investments and any equity in a home you own, then subtract your debts, such as mortgages and car loans.

But many economists believe this approach, known as calculating your net worth, leaves out a big chunk of your wealth: the benefits you’ll get in the future from Social Security, if you live in the United States, or similar government benefits programs that help retirees pay their bills in other countries.

As a sociologist who studies income and wealth inequality, I wanted to figure out just how much government safety net programs are worth to their recipients, and whether they truly can substitute for private savings.

A $40 trillion trove

A team of researchers recently estimated that future Social Security payments amounted to more than US$40 trillion as of 2019 – about $123,000 for everyone in the U.S. That huge number, which is not adjusted for inflation, was nearly one-third of the $110 trillion of Americans’ collective net worth in that year.

In a recent peer-reviewed study, published in April 2025 in Socio-Economic Review, I found that even this expanded definition of wealth leaves some important things out: unemployment insurance, the child tax credit and other widely available benefits. People who have access to these programs don’t have to dip into their savings as much when unexpected costs come up.

Social Security is by far the largest of these programs. As of 2019, the typical worker nearing retirement had banked about $412,000 in future Social Security benefits, I found – nearly as much as the $472,000 in private retirement savings such workers had. This estimate doesn’t include Social Security benefits to orphans, widows or people with disabilities.

The value of Social Security retirement benefits varies according to workers’ income and work history, ranging from $271,000 for the poorest 10% of recipients to $669,000 for the richest 10%.

Benefits from smaller safety net programs can also add up. Because some programs differ by state, I analyzed California and Texas, the two largest states. In California, I calculated that the average 45-year-old worker can count on almost $12,000 in unemployment insurance over 26 weeks, while in Texas the same worker would be eligible for more than $15,000 over the same period.

Meanwhile, under current law, many families having a child in 2025 can expect to receive about $29,000 through the federal child tax credit over the course of that kid’s lifetime.

Texas doesn’t mandate paid family leave, but California requires that each parent receive eight weeks of their salary. That’s worth another $13,000 to a family earning $90,000 a year – the median in my study – and more if the parents have higher incomes.

Where there’s even more hidden wealth

These somewhat hidden sources of wealth are worth far more in many other countries, especially Scandinavian ones. Norway provides a useful contrast.

The typical Norwegian worker retires with more than $510,000 in public pension wealth, I calculated. The exact amount they collect will vary depending on what they’ve earned and how long they live, as is the case with Social Security. But, unlike in the U.S., if they get sick, Norwegians are eligible for a up to a year of paid sick leave – worth about $57,000 to the median worker.

Norwegians can get unemployment insurance benefits for almost two years, amounting to $70,000 for the average worker, depending on their wages. And the combination of Norway’s child benefit and parental leave is worth between $60,000 and $80,000 from the time each child is born until they turn 18, depending on the parents’ exact income.

In the past few years, researchers have estimated the wealth value of public pensions – though not other government benefits – in several countries, including Australia, Austria, Germany, Poland and Switzerland, among others.

In many nations, this value rivals or exceeds that of all stocks, real estate and other private assets held by their residents combined.

Because so many people are eligible for Social Security or its equivalent public pension programs in other countries, there is also much less inequality in total retirement wealth than in standard measures of net worth.

Wealth vs. income

Wealth is much more unequally distributed than income just about everywhere. In the United States, for example, the richest 5% of the population has 32% of all income, but 70% of all wealth.

Wealth inequality has grown over time, and the Black-white wealth gap in the United States is particularly large. While typical Black families have incomes that are about 56% of what white families earn, they own only 18% as much wealth as the typical white family.

For these reasons, many politicians, scholars and activists have proposed ambitious policies to reduce inequality in private wealth, such as a wealth tax. Another idea gaining in popularity is to start issuing “baby bonds,” which give each newborn a prefunded savings account.

Wealth embedded in government benefits offers a complementary method of addressing wealth inequality. Even today, when Social Security and similar pension programs in other places are counted alongside private savings, inequality in retirement wealth is much lower than in privately held wealth alone.

Less flexible source of wealth

To be sure, the wealth you’re eventually due through Social Security and other government programs isn’t the same as the private assets you might own.

You can’t sell or borrow against your future Social Security benefits to meet an unexpected expense or make a down payment on a home. And if you die before reaching retirement age, you won’t receive any payments from the Social Security system yourself, although your spouse or heirs may be eligible for survivor benefits.

Also, government programs are not set in stone. Eligibility requirements can change, and benefit levels can be cut.

For instance, if the Social Security trust fund is depleted, retirees could see their benefits decline. But private wealth is also never guaranteed to last: Stock values can fluctuate wildly, and inflation erodes the value of any cash you’ve saved over time.

For these reasons, having a combination of private savings and government benefits offers the most promising way for everyone to prepare for their future. This can also help society address wealth inequality.The Conversation

About the Author:

Robert Manduca, Assistant Professor of Sociology, University of Michigan

This article is republished from The Conversation under a Creative Commons license. Read the original article.