By Shahid S. Hamid, Florida International University
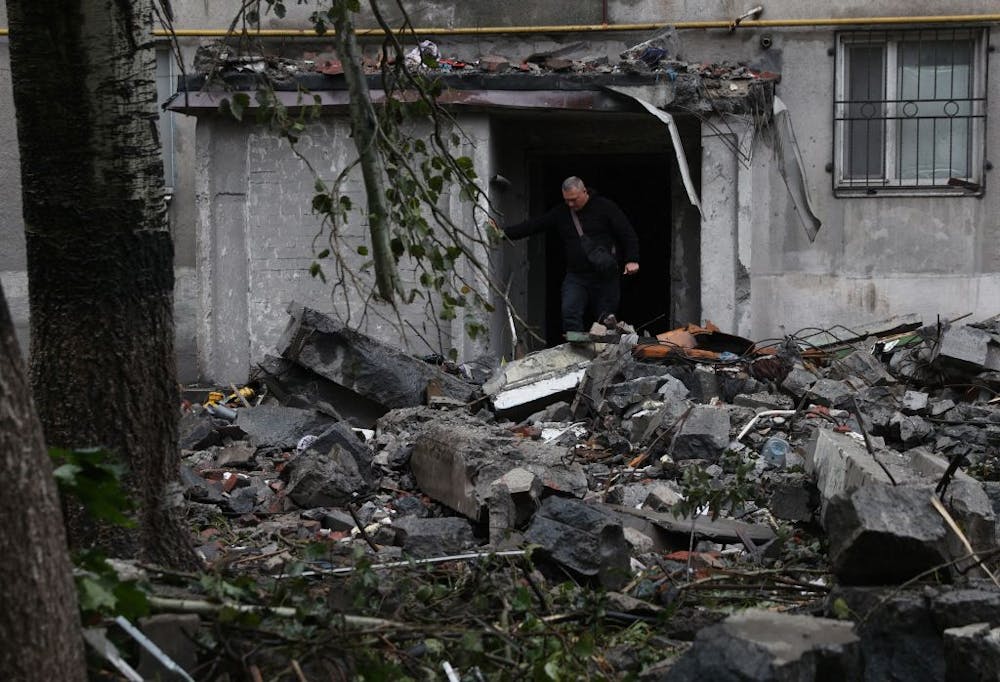
Hurricane Ian’s widespread damage is another disaster for Florida’s already shaky insurance industry. Even though home insurance rates in Florida are nearly triple the national average, insurers have been losing money. Six have failed since January 2022. Now, insured losses from Ian are estimated to exceed US$40 billion
Hurricane risk might seem like the obvious problem, but there is a more insidious driver in this financial train wreck.
Finance professor Shahid Hamid, who directs the Laboratory for Insurance at Florida International University, explained how Florida’s insurance market got this bad – and how the state’s insurer of last resort, Citizens Property Insurance, now carrying more than 1 million policies, can weather the storm.
What’s making it so hard for Florida insurers to survive?
Florida’s insurance rates have almost doubled in the past five years, yet insurance companies are still losing money for three main reasons.
One is the rising hurricane risk. Hurricanes Matthew (2016), Irma (2017) and Michael (2018) were all destructive. But a lot of Florida’s hurricane damage is from water, which is covered by the National Flood Insurance Program, rather than by private property insurance.
Another reason is that reinsurance pricing is going up – that’s insurance for insurance companies to help when claims spike.
But the biggest single reason is the “assignment of benefits” problem, involving contractors after a storm. It’s partly fraud and partly taking advantage of loose regulation and court decisions that have affected insurance companies.
It generally looks like this: Contractors will knock on doors and say they can get the homeowner a new roof. The cost of a new roof is maybe $20,000-$30,000. So, the contractor inspects the roof. Often, there isn’t really that much damage. The contractor promises to take care of everything if the homeowner assigns over their insurance benefit. The contractors can then claim whatever they want from the insurance company without needing the homeowner’s consent.
If the insurance company determines the damage wasn’t actually covered, the contractor sues.
So insurance companies are stuck either fighting the lawsuit or settling. Either way, it’s costly.
Other lawsuits may involve homeowners who don’t have flood insurance. Only about 14% of Florida homeowners pay for flood insurance, which is mostly available through the federal National Flood Insurance Program. Some without flood insurance will file damage claims with their property insurance company, arguing that wind caused the problem.
How widespread of a problem are these lawsuits?
Overall, the numbers are pretty striking.
About 9% of homeowner property claims nationwide are filed in Florida, yet 79% of lawsuits related to property claims are filed there.
The legal cost in 2019 was over $3 billion for insurance companies just fighting these lawsuits, and that’s all going to be passed on to homeowners in higher costs.
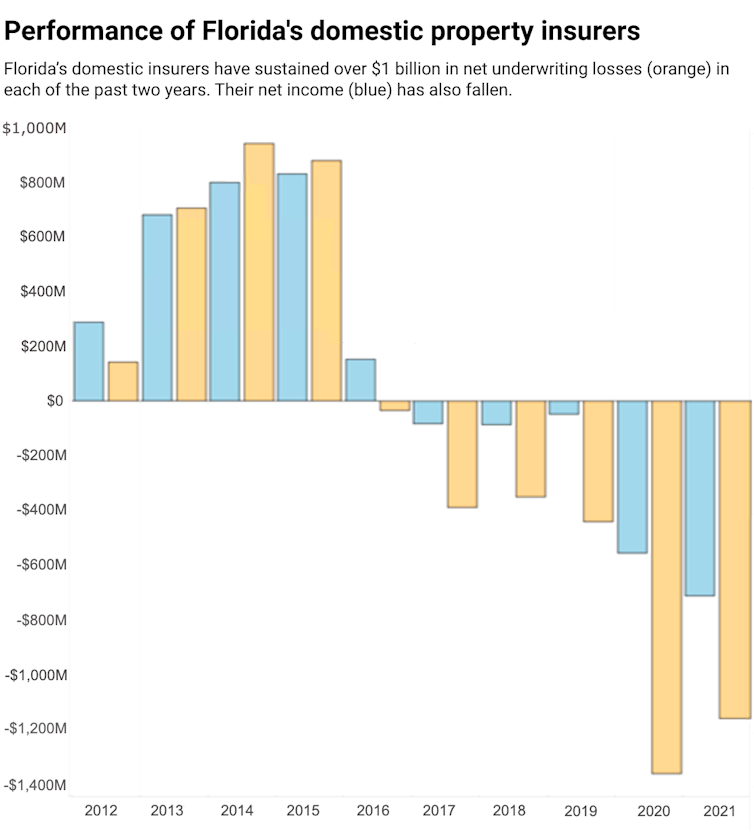
Insurance companies had a more than $1 billion underwriting loss in 2020 and again in 2021. Even with premiums going up so much, they’re still losing money in Florida because of this. And that’s part of the reason so many companies are deciding to leave.
Assignment of benefits is likely more prevalent in Florida than most other states because there is more opportunity from all the roof damage from hurricanes. The state’s regulation is also relatively weak. This may eventually be fixed by the legislature, but that takes time and groups are lobbying against change. It took a long time to pass a law saying the attorney fee has to be capped.
How bad is the situation for insurers?
We’ve seen about a dozen companies be declared insolvent or leave since early 2020. At least six dropped out this year alone.
Thirty more are on the Florida Office of Insurance Regulation’s watch list. About 17 of those are likely to be or have been downgraded from A rating, meaning they’re no longer considered to be in good financial health.
The ratings downgrades have consequences for the real estate market. To get a loan from the federal mortgage lenders Freddie Mac and Fannie Mae, you have to have insurance. But if an insurance company is downgraded to below A, Freddie Mac and Fannie Mae won’t accept it. Florida established a $2 billion reinsurance fund in May 2022 that can help smaller insurance companies in situations like this. If they get downgraded, the reinsurance can act like co-signing the loan so the mortgage lenders will accept it.
But it’s a very fragile market.
Ian could be one of the costliest hurricanes in Florida history. I’ve seen estimates of $40 billion to $60 billion in losses. I wouldn’t be surprised if some of those companies on the watch list leave after this storm. That will put more pressure on Citizens Property Insurance, the state’s insurer of last resort.
Some headlines suggest that Florida’s insurer of last resort is also in trouble. Is it really at risk, and what would that mean for residents?
Citizens is not facing collapse, per se. The problem with Citizens is that its policy numbers typically swell after a crisis because as other insurers go out of business, their policies shift to Citizens. It sells off those policies to smaller companies, then another crisis comes along and its policy numbers rise again.
Three years ago, Citizens had half a million policies. Now, it has twice that. All these insurance companies that left in the last two years, their policies have been migrated to Citizens.
Ian will be costly, but Citizens is flush with cash right now because it had a lot of premium increases and built up its reserves.
Citizens also has a lot of backstops.
It has the Florida Hurricane Catastrophe Fund, established in the 1990s after Hurricane Andrew. It’s like reinsurance, but it’s tax-exempt so it can build reserves faster. Once a trigger is reached, Citizens can go to the catastrophe fund and get reimbursed.
More importantly, if Citizens runs out of money, it has the authority to impose a surcharge on everyone’s policies – not just its own policies, but insurance policies across Florida. It can also impose surcharges on some other types of insurance, such as life insurance and auto insurance. After Hurricane Wilma in 2005, Citizens imposed a 1% surcharge on all homeowner policies.
Those surcharges can bail Citizens out to some degree. But if payouts are in the tens of billions of dollars in losses, it will probably also get a bailout from the state.
So, I’m not as worried for Citizens. Homeowners will need help, though, especially if they’re uninsured. I expect Congress will approve some special funding, as it did in the past for hurricanes like Katrina and Sandy, to provide financial aid for residents and communities.![]()
About the Author:
Shahid S. Hamid, Professor of Finance, Florida International University
This article is republished from The Conversation under a Creative Commons license. Read the original article.