The US consumer inflation rate fell from 7.7% to 7.1% year-over-year. Core inflation (which excludes food and energy prices) also fell from 6.3% to 6.1%. Overall, the latest data provided the strongest evidence that the United States inflation is slowing steadily. The markets reacted with an impulse to this data. As the stock market closed Tuesday, the Dow Jones Index (US30) increased by 0.30%, and the S&P 500 Index (US500) jumped by 0.73%. The technology index NASDAQ (US100) was up 1.01% on Tuesday. All three indices closed the day in positive territory.
There is a 79.4% chance that the Fed will raise interest rates by 0.5% today. This move will follow four hikes of three quarters in a row. A half-point hike would put the Fed’s key short-term rate at 4.5%. Markets will also be watching closely for Fed Chairman Jerome Powell’s speech after the Fed meeting to see signs of whether the Central Bank believes inflation has declined enough to continue lowering the pace of interest rate hikes.
But the inflation report has some negative things to say. For example, the cost of housing, which makes up nearly a third of the US consumer price index, continues to rise. But real-time rent and home price indicators are starting to fall. The real estate market remains in recession.
President Joe Biden called the inflation report “good news for families across the country” and noted that lower car and toy prices should benefit holiday shoppers. Nevertheless, Biden acknowledged that inflation may not return to “normal levels” until late next year.
Equity markets in Europe were mostly up yesterday. The German DAX (DE30) gained 1.34%, the French CAC 40 (FR40) added 1.42%, the Spanish IBEX 35 (ES35) jumped by 0.83%, the British FTSE 100 (UK100) closed Tuesday in plus 0.76%.
Unlike the US Federal Reserve, the ECB is still far from completing its monetary tightening cycle. The ECB politicians will meet tomorrow, expecting to raise the interest rate by 0.5%. But with a high probability, the “lowering” of the step from 75 to 50 basis points will be accompanied by more aggressive quantitative tightening (QT). Experts believe that the ECB will phase out reinvestment of its asset purchase program portfolio during 2023.
The ZEW economic sentiment indicator for Germany rose by 13.4 points from 36.7 to 23.3. The German economic sentiment indicator also continues to improve and is currently at 61.4, up 3.1 points from the previous month. Germany’s economic outlook has thus become significantly more optimistic over the past two months.
Gold prices hit a six-month high amid slowing US inflation. Prices of precious metals are inversely correlated with the dollar index and government bond yields, so when the dollar falls, gold and silver prices rise.
The price of oil surpassed $80 a barrel on Tuesday and recorded its biggest daily gain in more than a month as investors bought up risky assets after US data pointed to a slowdown in inflation. Concerns over oil supply disruptions, including the ongoing shutdown of the Keystone pipeline from Canada to the US after a major leak last week, also supported the market.
Asian markets were mostly up yesterday. Japan’s Nikkei 225 (JP225) gained 0.44%, China’s FTSE China A50 (CHA50) was down by 0.02%, Hong Kong’s Hang Seng (HK50) jumped by 0.68% on the day, India’s NIFTY 50 (IND50) added 0.60%, and Australia’s S&P/ASX 200 (AU200) was up 0.31% on the day.
Sentiment among Japan’s big manufacturers deteriorated in the fourth quarter amid rising price pressures, a Bank of Japan survey showed Wednesday, although the lifting of restrictions because of COVID-19 boosted service sector sentiment. The Tankan Large Non-Manufacturers Index jumped to 19 in the fourth quarter, beating expectations of 17 and the previous quarter’s reading of 14. Japan’s manufacturing sector has been hit hard by rising inflation and a weaker yen this year, which has increased manufacturing costs. Although most manufacturers have passed these costs on to customers, this has also had a negative impact on sales.
S&P 500 (F) (US500) 4,019.65 +29.09 (+0.73%)
Dow Jones (US30) 34,108.64 +103.60 (+0.30%)
DAX (DE40) 14,497.89 +191.26 (+1.34%)
FTSE 100 (UK100) 7,502.89 +56.92 (+0.76%)
USD Index 105.02 +0.21 (+0.20%)
Important events for today:
– Australia RBA Gov Lowe Speaks at 00:30 (GMT+2);
– Japan Tankan Manufacturing (q/q) at 01:50 (GMT+2);
– Japan Non-Tankan Manufacturing (q/q) at 01:50 (GMT+2);
– Japan Industrial Production (m/m) at 06:30 (GMT+2);
– UK Consumer Price Index (m/m) at 09:00 (GMT+2);
– Spanish Consumer Price Index (m/m) at 10:00 (GMT+2);
– Eurozone Industrial Production (m/m) at 12:00 (GMT+2);
This article reflects a personal opinion and should not be interpreted as an investment advice, and/or offer, and/or a persistent request for carrying out financial transactions, and/or a guarantee, and/or a forecast of future events.
American scientists have announced what they have called a major breakthrough in a long-elusive goal of creating energy from nuclear fusion.
The U.S. Department of Energy said on Dec. 13, 2022, that for the first time – and after several decades of trying – scientists have managed to get more energy out of the process than they had to put in.
But just how significant is the development? And how far off is the long-sought dream of fusion providing abundant, clean energy? Carolyn Kuranz, an associate professor of nuclear engineering at the University of Michigan who has worked at the facility that just broke the fusion record, helps explain this new result.
Fusion is a nuclear reaction that combines two atoms to create one or more new atoms with slightly less total mass. The difference in mass is released as energy, as described by Einstein’s famous equation, E = mc2 , where energy equals mass times the speed of light squared. Since the speed of light is enormous, converting just a tiny amount of mass into energy – like what happens in fusion – produces a similarly enormous amount of energy.
Researchers at the U.S. Government’s National Ignition Facility in California have demonstrated, for the first time, what is known as “fusion ignition.” Ignition is when a fusion reaction produces more energy than is being put into the reaction from an outside source and becomes self-sustaining.
The technique used at the National Ignition Facility involved shooting 192 lasers at a 0.04 inch (1 mm) pellet of fuel made of deuterium and tritium – two versions of the element hydrogen with extra neutrons – placed in a gold canister. When the lasers hit the canister, they produce X-rays that heat and compress the fuel pellet to about 20 times the density of lead and to more than 5 million degrees Fahrenheit (3 million Celsius) – about 100 times hotter than the surface of the Sun. If you can maintain these conditions for a long enough time, the fuel will fuse and release energy.
The fuel and canister get vaporized within a few billionths of a second during the experiment. Researchers then hope their equipment survived the heat and accurately measured the energy released by the fusion reaction.
So what did they accomplish?
To assess the success of a fusion experiment, physicists look at the ratio between the energy released from the process of fusion and the amount of energy within the lasers. This ratio is called gain.
Anything above a gain of 1 means that the fusion process released more energy than the lasers delivered.
On Dec. 5, 2022, the National Ignition Facility shot a pellet of fuel with 2 million joules of laser energy – about the amount of power it takes to run a hair dryer for 15 minutes – all contained within a few billionths of a second. This triggered a fusion reaction that released 3 million joules. That is a gain of about 1.5, smashing the previous record of a gain of 0.7 achieved by the facility in August 2021.
How big a deal is this result?
Fusion energy has been the “holy grail” of energy production for nearly half a century. While a gain of 1.5 is, I believe, a truly historic scientific breakthrough, there is still a long way to go before fusion is a viable energy source.
While the laser energy of 2 million joules was less than the fusion yield of 3 million joules, it took the facility nearly 300 million joules to produce the lasers used in this experiment. This result has shown that fusion ignition is possible, but it will take a lot of work to improve the efficiency to the point where fusion can provide a net positive energy return when taking into consideration the entire end-to-end system, not just a single interaction between the lasers and the fuel.
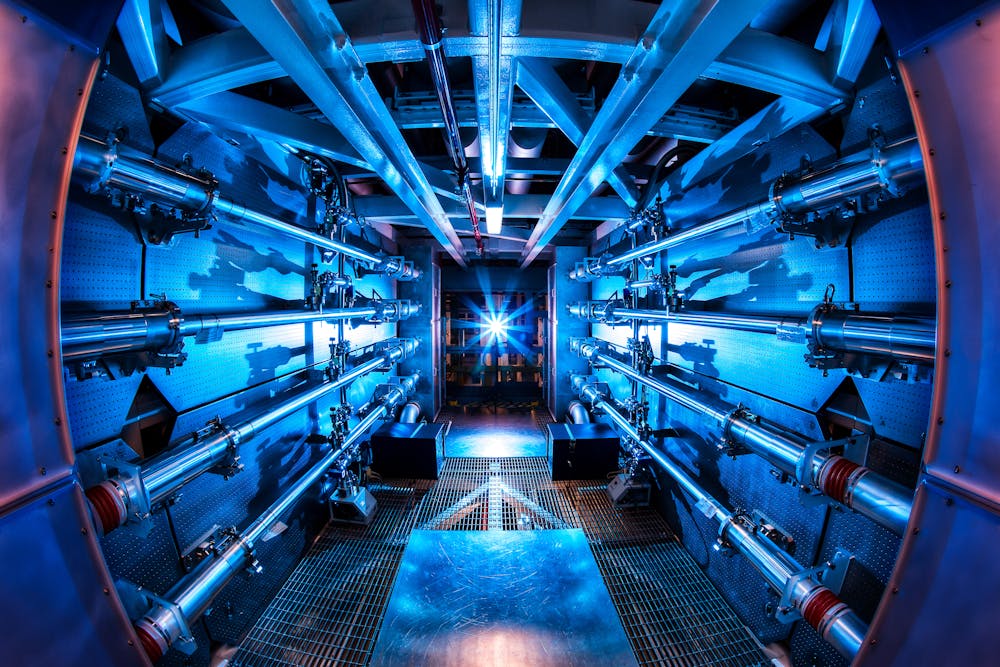
Machinery used to create the powerful lasers, like these pre-amplifiers, currently requires a lot more energy than the lasers themselves produce. Lawrence Livermore National Laboratory, CC BY-SA
What needs to be improved?
There are a number of pieces of the fusion puzzle that scientists have been steadily improving for decades to produce this result, and further work can make this process more efficient.
These and other scientific, technological and engineering hurdles will need to be overcome before fusion will produce electricity for your home. Work will also need to be done to bring the cost of a fusion power plant well down from the US$3.5 billion of the National Ignition Facility. These steps will require significant investment from both the federal government and private industry.
It’s worth noting that there is a global race around fusion, with many other labs around the world pursuing different techniques. But with the new result from the National Ignition Facility, the world has, for the first time, seen evidence that the dream of fusion is achievable.
What’s so special about the number 2? Quite a lot, if you’re a central banker – and that number is followed by a percent sign.
That’s been the de facto or official target inflation rate for the Federal Reserve, the European Central Bank and many other similar institutions since at least the 1990s.
The U.S. inflation rate hit its 2022 peak in July at an annual rate of 9.1%. The last time consumer prices were rising this fast was back in 1981 – over 40 years ago.
Since 1996, Fed policymakers have generally adopted the stance that their target for doing so was an inflation rate of around 2%. In January 2012, then-Chairman Ben Bernanke made this target official, and both of his successors, including current Chair Jerome Powell, have made clear that the Fed sees 2% as the appropriate desired rate of inflation.
Until very recently, though, the problem wasn’t that inflation was too high – it was that it was too low. That prompted Powell in 2020, when inflation was barely more than 1%, to call this a cause for concern and say the Fed would let it rise above 2%.
Many of you may find it counterintuitive that the Fed would want to push up inflation. But inflation that is persistently too low can pose serious risks to the economy.
These risks – namely sparking a deflationary spiral – are why central banks like the Fed would never want to adopt a 0% inflation target.
Perils of deflation
When the economy shrinks during a recession with a fall in gross domestic product, aggregate demand for all the things it produces falls as well. As a result, prices no longer rise and may even start to fall – a condition called deflation.
Deflation is the exact opposite of inflation – instead of prices rising over time, they are falling. At first, it would seem that falling and lower prices are a good thing – who wouldn’t want to buy the same thing at a lower price and see their purchasing power go up?
But deflation can actually be pretty devastating for the economy. When people feel prices are headed down – not just temporarily, like big sales over the holidays, but for weeks, months or even years – they actually delay purchases in the hopes that they can buy things for less at a later date.
For example, if you are thinking of buying a new car that currently costs US$60,000, during periods of deflation you realize that if you wait another month, you can buy this car for $55,000. As a result, you don’t buy the car today. But after a month, when the car is now for sale for $55,000, the same logic applies. Why buy a car today, when you can wait another month and buy a car for $50,000 next month.
This lower spending leads to less income for producers, which can lead to unemployment. In addition, businesses, too, delay spending since they expect prices to fall further. This negative feedback loop – the deflationary spiral – generates higher unemployment, even lower prices and even less spending.
So it’s pretty clear some inflation is probably necessary to avoid a deflation trap, but how much? Could it be 1%, 3% or even 4%?
Maybe. There isn’t any strong theoretical or empirical evidence for an inflation target of exactly 2%. The figure’s origin is a bit murky, but some reports suggest it simply came from a casual remark made by the New Zealand finance minister back in the late 1980s during a TV interview.
Moreover, there’s concern that creating economic targets for economic indicators like inflation corrupts the usefulness of the metric. Charles Goodhart, an economist who worked for the Bank of England, created an eponymous law that states: “When a measure becomes a target, it ceases to be a good measure.”
Since a core mission of the Fed is price stability, the target is beside the point. The main thing is that the Fed guide the economy toward an inflation rate high enough to allow it room to lower interest rates if it needs to stimulate the economy but low enough that it doesn’t seriously erode consumer purchasing power.
In the United States, the PPI, which measures inflation between factories and plants, rose by 0.4% last month. This is a negative sign, indicating that the current rate of inflation may not yet be peaking. A stronger-than-expected consumer confidence report also contributed to a late-session sell-off in stocks. At the close of the stock market on Friday, the Dow Jones Index (US30) decreased by 0.90% (-2.50% for the week) and the S&P 500 Index (US500) lost 0.73% (-2.90% for the week). The Technology Index NASDAQ (US100) was down by 0.70% on Friday (-3.31% for the week). All three indices closed the week lower.
The PPI report confirmed Chairman Powell’s recent speech that while the October inflation data was encouraging, it will take much more effort to bring down inflation. But there is also a positive side. Annual inflation expectations fell to 4.6% from 4.9%, the lowest since September 2021, according to a University of Michigan survey.
The US Federal Reserve will hold its last meeting of the year this week. Experts point to a 78% chance that the Fed will raise rates by 0.5%. The probability of raising the rate by 0.75% is 21%. Meanwhile, US inflation data on Tuesday will shed light on the Fed’s future plans, which will set the tone for US indices and stocks for the rest of the year and the beginning of 2023.
Equity markets in Europe were mostly down last week. German DAX (DE30) gained 0.74% (-0.81% for the week), French CAC 40 (FR40) added 0.46% (-0.76% for the week), Spanish IBEX 35 (ES35) gained 0.78% (-1.20% for the week), British FTSE 100 (UK100) closed on Friday up by 0.06% (-1.05% for the week).
The UK will publish the next GDP and Industrial Production Data today. Analysts believe that if the GDP shows a decline, the UK will move from the stagflation phase to a full-blown recession. The wage and price spiral could lead to hyperinflation and destabilize the economy. According to the latest CBI report, UK business investment continues to decline.
The Swiss National Bank (SNB) will meet on December 15 and is expected to decide on a third rate hike, this time probably by 50 basis points, in the context of stabilizing inflation at 3%. A further rate hike could come in March 2023, after which the SNB will probably pause for the rest of the year.
Gold and silver have been trading higher in recent weeks as the US dollar lost some ground due to an impending rate hike by the US Federal Reserve. But as central banks remain focused on curbing inflation through restrictive tightening of monetary policy, the fundamental component is not yet in favor of the precious metals. On the other hand, the tightening cycle is in its final stages, and investors are beginning to move into gold and silver in advance. But traders should understand that if recession fears weaken, the dollar index might strengthen again, which would have a negative impact on gold quotes.
Last week, black gold prices were falling as the EU and allies put a price cap on Russian oil. But oil prices rose on Friday and continued to rise in Asian morning trading on Monday as Russian President Vladimir Putin threatened to cut production in response to a Western price cap on Russian oil exports. Another factor in the rise in oil prices was the closure of a key oil pipeline between Canada and the United States over the weekend.
Asian markets traded flat last week. Japan’s Nikkei 225 (JP225) gained 0.53% over the week, China’s FTSE China A50 (CHA50) was down by 0.87%, Hong Kong’s Hang Seng (HK50) jumped by 3.53%, India’s NIFTY 50 (IND50) decreases by 0.84%, and Australia’s S&P/ASX 200 (AU200) was down by 1.21%.
Optimism about the cancellation of COVID measures in China was largely neutralized by fears that a large spike in local infections would delay a broader opening.
Wholesale prices in Japan fell from 9.4% to 9.3% year-over-year in November. The drop in producer prices points to a possible peak in inflation amid a decline in global commodity prices. Global commodity prices and the weakness of the yen, which increases the cost of imports, are pushing wholesale and consumer inflation upward. Japanese policymakers fear that such a trend could hurt Japan’s fragile economic recovery, so they are keeping rates at ultra-low levels.
In the commodities market, futures on orange juice (+5.45%), lumber (+3.76%), soybeans (+3.06%), and palladium (+2.86%) showed the biggest gains by the end of the week. Futures on WTI oil (-10.49%), BRENT oil (-10.23%), gasoline (-9.67%), wheat (-3.71%), coffee (-3.01%), and cotton (-2.62%) showed the biggest drop.
S&P 500 (F) (US500) 3,934.38 −29.13 (−0.73%)
Dow Jones (US30) 33,476.46 −305.02 (−0.90%)
DAX (DE40) 14,370.72 +106.16 (+0.74%)
FTSE 100 (UK100) 7,476.63 +4.46 (+0.06%)
USD Index 104.93 +0.16 (+0.15%)
Important events for today:
– UK GDP (m/m) at 09:00 (GMT+2);
– UK Industrial Production (m/m) at 09:00 (GMT+2);
– UK Manufacturing Production (m/m) at 09:00 (GMT+2);
This article reflects a personal opinion and should not be interpreted as an investment advice, and/or offer, and/or a persistent request for carrying out financial transactions, and/or a guarantee, and/or a forecast of future events.
The International Space Station is no longer the only place where humans can live in orbit.
On Nov. 29, 2022, the Shenzhou 15 mission launched from China’s Gobi Desert carrying three taikonauts – the Chinese word for astronauts. Six hours later, they reached their destination, China’s recently completed space station, called Tiangong, which means “heavenly palace” in Mandarin. The three taikonauts replaced the existing crew that helped wrap up construction. With this successful mission, China has become just the third nation to operate a permanent space station.
China’s space station is an achievement that solidifies the country’s position alongside the U.S. and Russia as one of the world’s top three space powers. As scholars of space law and space policy who lead the Indiana University Ostrom Workshop’s Space Governance Program, we have been following the development of the Chinese space station with interest.
Unlike the collaborative, U.S.-led International Space Station, Tiangong is entirely built and run by China. The successful opening of the station is the beginning of some exciting science. But the station also highlights the country’s policy of self-reliance and is an important step for China toward achieving larger space ambitions among a changing landscape of power dynamics in space.
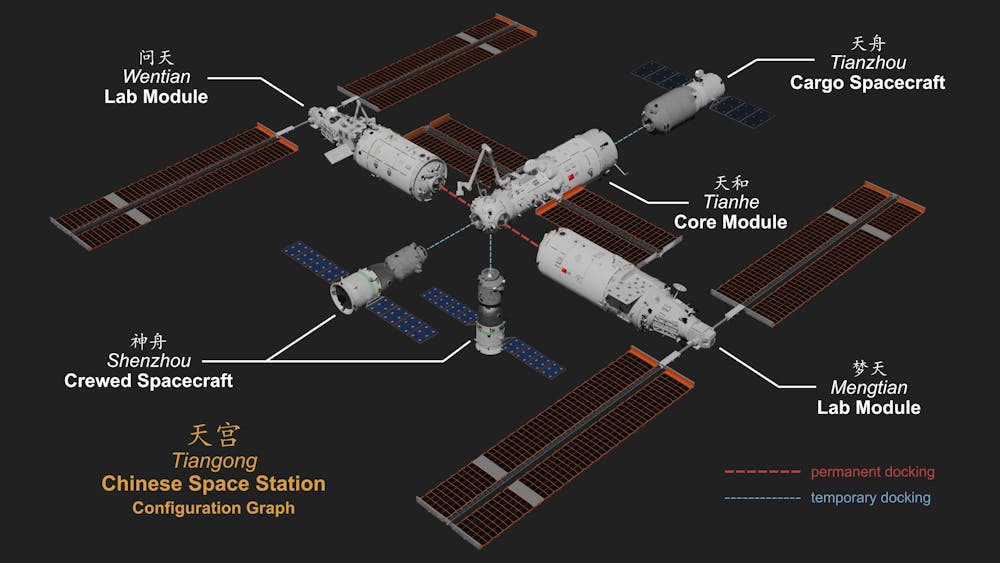
The Tiangong space station is much smaller than the International Space Station and consists of three modules. Shujianyang/Wikimedia Commons, CC BY-SA
Capabilities of a Chinese station
The Tiangong space station is the culmination of three decades of work on the Chinese manned space program. The station is 180 feet (55 meters) long and is comprised of three modules that were launched separately and connected in space. These include one core module where a maximum of six taikonauts can live and two experiment modules for a total of 3,884 cubic feet (110 cubic meters) of space, about one-fifth the size of the International Space Station. The station also has an external robotic arm, which can support activities and experiments outside the station, and three docking ports for resupply vehicles and manned spacecraft.
Like China’s aircraft carriers and other spacecraft, Tiangong is based on a Soviet-era design – it is pretty much a copy of the Soviet Mir space station from the 1980s. But the Tiangong station has been heavily modernized and improved.
The Chinese space station is slated to stay in orbit for 15 years, with plans to send two six-month crewed missions and two cargo missions to it annually. The science experiments have already begun, with a planned study involving monkey reproduction commencing in the station’s biological test cabinets. Whether the monkeys will cooperate is an entirely different matter.
Tiangong is strictly Chinese made and managed, but China has an open invitation for other nations to collaborate on experiments aboard Tiangong. So far, nine projects from 17 countries have been selected.
Although the new station is small compared to the 16 modules of the International Space Station, Tiangong and the science done aboard will help support China’s future space missions. In December 2023, China is planning to launch a new space telescope called Xuntian. This telescope will map stars and supermassive black holes among other projects with a resolution about the same as the Hubble Space Telescope but with a wider view. The telescope will periodically dock with the station for maintenance.
China also has plans to launch multiple missions to Mars and nearby comets and asteroids with the goal of bringing samples back to Earth. And perhaps most notably, China has announced plans to build a joint Moon base with Russia – though no timeline for this mission has been set.
The three-person crew of taikonauts greets the crew already aboard the Tiangong station in early December 2022.
Astropolitics
A new era in space is unfolding. The Tiangong station is beginning its life just as the International Space Station, after more than 30 years in orbit, is set to be decommissioned by 2030.
The International Space Station is the classic example of collaborative ideals in space – even at the height of the Cold War, the U.S. and the Soviet Union came together to develop and launch the beginnings of the space station in the early 1990s. By comparison, China and the U.S. have not been so jovial in their orbital dealings.
In the 1990s, when China was still launching U.S. satellites into orbit, concerns emerged that China was accidentally acquiring – or stealing – U.S. technology. These concern in part led to the Wolf Amendment, passed by Congress in 2011, which prohibits NASA from collaborating with China in any capacity. China’s space program was not mature enough to be part of the construction of the International Space Station in the 1990s and early 2000s. By the time China had the ability to contribute to the International Space Station, the Wolf Amendment prevented it from doing so.
It remains to be seen how the map of space collaboration will change in the coming years. The U.S.-led Artemis Program that aims to build a self-sustaining habitat on the Moon is open to all nations, and 19 countries have joined as partners so far. China has also recently opened its joint Moon mission with Russia to other nations. This was partly driven by cooling Chinese-Russian relations but also due to the fact that because of the war in Ukraine, Sweden, France and the European Space Agency canceled planned missions with Russia.
As tensions on Earth rise between China, Russia and the West, and some of that jockeying spills over into space, it remains to be seen how the decommissioning of the International Space Station and operation of the Tiangong station will influence the China-U.S. relationship.
An event like the famous handshake between U.S. astronauts and Russian cosmonauts while orbiting Earth in 1975 is a long way off, but collaboration between the U.S. and China could do much to cool tensions on and above the Earth.
Some of the world’s largest central banks are about to make their final rate decisions of the year, while offering their updated policy outlooks for 2023.
Throw into that mix: the latest inflation data out of major economies such as the US and the UK.
All that could make for some spicy market action, with FX pairs involving the US dollar, euro, and the British Pound perhaps feeling the burn going into 2023.
Here’s a list of the main economic data releases and events that could rock markets next week:
Monday, December 12
JPY: Japan November PPI
GBP: UK October monthly GDP, industrial production, manufacturing production
Tuesday, December 13
AUD: Australia November household spending, December consumer confidence
EUR: Germany November CPI (final print), December ZEW survey expectations
GBP: UK October unemployment rate, November jobless claims
USD: US November CPI – consumer price index
Wednesday, December 14
GBP: UK November CPI
EUR: Eurozone October industrial production
USD: Fed rate decision
Crude: EIA weekly oil inventories
Thursday, December 15
NZD: New Zealand Q3 GDP
AUD: Australia November unemployment, December inflation expectations
CNH: China medium-term lending rate; November industrial production, retail sales, jobless rate
CHF: Swiss National Bank rate decision
NOK: Norway’s Norges Bank rate decision
GBP: Bank of England rate decision
EUR: European Central Bank rate decision
USD: US weekly initial jobless claims, November retail sales, industrial production
Friday, December 16
AUD: Australia December PMIs
GBP: UK November retail sales; December PMIs and consumer confidence
S&P 500: ‘Triple witching day’ for US markets
USD: Deadline for avoiding US government shutdown
Markets are widely expecting a 50-bps hike respectively by the US Federal Reserve, the European Central Bank, and the Bank of England.
Anything other than a 50bps hike would be a surprise for markets, and likely translating into shock moves for USD, EUR, and/or GBP currency pairs.
A 50bps adjustment would also mark a “downshift” for these big 3 central banks, who had each hiked by 75bps at their previous meetings.
Focus on the Fed
As always, the Fed remains front and centre, given that it’s the most influential central bank in the world.
Consider how the rest of the FX world has found some relief from the US dollar’s declines over the past couple of months.
That’s largely due to markets becoming increasingly hopeful the eventual “downshift” (opting for smaller-sized rate hikes) by the Fed.
Such expectations have halved the benchmark US Dollar index’s year-to-date gains, from as much as 20% now down to 9.3% at the time of writing.
Watch what central bankers say and do
Markets are ready to react not just to what these central banks will do to their respective benchmark rates next week, but also to what each of these central banks say about their intentions on rate adjustments in 2023.
These policy outlooks will of course be informed by the latest figures on inflation, which we know is enemy #1 for these central bankers.
Hence, if we do see a higher-than-7.3% US CPI print next week, that should pave the way for the Fed to keep hiking its benchmark rates for longer.
Such a narrative could fuel a rebound for the US dollar, especially if Fed Chair Jerome Powell can convince markets once more of the central bank’s ultra-hawkish intentions.
Yet, we note that such a rebound for the greenback may prove limited and fleeting.
Looking back at the earlier DXY chart, the dollar’s rebound may be capped once more at its 200-day simple moving average (SMA).
From a fundamental perspective, the dollar’s rebound may run out of steam especially if markets persist with hopes on the eventual Fed “pivot”, despite what Powell may say to the contrary.
Brace for potentially imminent volatility
Overall, it remains to be seen which central bank can sound the most hawkish (intend to send its own benchmark rate higher) between the Fed, ECB, or the BOE.
And it’s the currency of that more-hawkish central bank that may outperform next week, and through year-end.
The US indices rose on Thursday amid a technology sector recovery, despite rising Treasury bond yields. By Thursday’s close, the Dow Jones Index (US30) increased by 0.55%, and the S&P 500 Index (US500) added 0.75%. The technology index NASDAQ (US100) gained 1.13% yesterday. All three indices closed on the plus side.
Initial jobless claims jumped to the highest level since February, an indication that unemployed people need more time to find work. These are the first signs that the labor market is beginning to “cool down,” which in turn will influence the Fed’s monetary policy to slow the pace of rate hikes. The end of the tightening cycle is close. The steep inversion of the Treasury yield curve is a harbinger of recession, which also raises the possibility that the US Federal Reserve will soon take a pause.
Equity markets in Europe traded yesterday without a single trend. German DAX (DE30) gained 0.02%, French CAC 40 (FR 40) declined by 0.20%, Spanish IBEX 35 (ES35) declined by 0.79%, and British FTSE 100 (UK100) closed on Thursday down by 0.23%.
According to analysts, after underestimating the structural uptrend in inflation that began in 2017 amid an emerging labor shortage, the ECB now appears to be overestimating inflationary pressures. The slight decline in euro area inflation to 10% in November from 10.6% in October, largely due to lower oil prices, suggests that the worst of the inflation-induced shocks may be coming soon. So a 50 basis point rate hike on December 15 to 2.5% on the main refinancing rate makes sense. But it does not make sense to keep raising rates in 2023 because the winter recession in Europe will be disinflationary. Falling private consumption will play a big role in this downturn. Germany’s 2.8% monthly drop in retail sales in October may be a harbinger of recession.
Crude oil prices hit a near-one-year low on Thursday. Oil prices will continue to fall as President Vladimir Putin’s administration shows no serious signs of responding to the price cap, leading traders to believe that oil prices will eventually trade close to the $ 60-a-barrel limit.
Asian markets were mostly down yesterday. Japan’s Nikkei 225 (JP225) decreased by 0.40%, Hong Kong’s Hang Seng (HK50) ended the day up by 3.38%, and Australia’s S&P/ASX 200 (AU200) ended the day down by 0.75%.
According to the National Bureau of Statistics of China, the Producer Price Index (PPI) remained unchanged compared to the previous month. November’s Consumer Price Index (CPI) fell to 1.6% year-on-year from 2.1%. This data suggests that economic growth continues to weaken. Growth in the world’s second-largest economy has slowed this year, largely under the influence of uncompromising COVID-19 restrictions.
Australia’s economy is likely to slow in the second half of 2023. Analysts project the Australian economy to contract from 2.6% in 2022 to 1.0% in 2023. Household consumption is projected to decline from about 2% in the first half of 2023 to nearly zero in the second half. Inflation will be 3% lower in 2024 than the RBA’s current forecast of 3.25%, allowing the RBA to cut rates by about 100 basis points in late 2023 and early 2024. The sharp slowdown in economic growth in 2023 will be due in part to the RBA continuing to raise interest rates in the first half of 2023 as wage growth and inflation remain high.
S&P 500 (F) (US500) 3,963.51 +29.59 (+0.75%)
Dow Jones (US30) 33,781.48 +183.56 (+0.55%)
DAX (DE40) 14,264.56 +3.37 (+0.024%)
FTSE 100 (UK100) 7,472.17 −17.02 (−0.23%)
USD Index 104.81 -0.29 (-0.28%)
Important events for today:
– China Consumer Price Index (m/m) at 03:30 (GMT+3);
– China Producer Price Index (m/m) at 03:30 (GMT+3);
– US Producer Price Index (m/m) at 15:30 (GMT+3);
– US Michigan Consumer Sentiment (m/m) at 17:00 (GMT+3).
This article reflects a personal opinion and should not be interpreted as an investment advice, and/or offer, and/or a persistent request for carrying out financial transactions, and/or a guarantee, and/or a forecast of future events.
With Russian troops digging trenches to prepare for an expected winter standoff, it would be easy to conclude that fighting will slow in Ukraine until after the ground thaws in the spring.
But evidence from the Ukrainian battlefields point to a different trajectory.
As a career U.S. special forces officer who conducted field research on the 2008 and 2014 wars in Georgia and Ukraine, it is my view that this war has demonstrated that only one side, the Ukrainians, can execute effective combat maneuvers. I believe that the Ukrainians will attempt to launch a large-scale counteroffensive in late winter when the ground is still frozen.
Winter’s impact on war
Historically, the pace of fighting does slow in the winter.
Weapons and other equipment can freeze up in extreme cold, and it’s much more difficult to shoot a weapon while wearing thick gloves.
Shorter days are a factor. Despite technological advances, most of the fighting during this war has occurred during the day.
But this winter may be different for the Ukrainian military.
First, Ukrainian winters are not nearly as cold and snowy as many believe.
Donetsk, for example, has an average temperature of nearly 25 degrees Fahrenheit (-4 degrees Celsius) in January and February.
Its snowiest month, January, averages only 4.9 inches of snow, or .12 meters. Both January and February average just as many rainy days as snowy days – roughly two days of each.
A brief history of Russian attack
Since the invasion began in February 2022, Russia made most of its gains in the first month of the war when it seized Kherson, surrounded Mariupol, and was on the doorsteps of Kyiv and Kharkiv.
But Russia soon gave up on Kyiv and withdrew all its forces from the north.
During this time, Ukraine built up its combat power with new weaponry from the West and planned a large counteroffensive, which it initiated on Aug. 28, 2022.
In the first week of the counteroffensive, Ukraine liberated more territory than Russia had captured in the previous five months.
The success of the counteroffensive showed that Ukraine’s military was superior to Russia’s in every category with the exception of size. It had better doctrine, leaders, strategy, culture and will – and it had just proved that it could effectively fight battles with a combination of artillery, tanks, soldiers and air attacks.
By Sept. 12, 2022, Ukraine had liberated much of Kharkiv Oblast as Russian troops routinely fled from their positions.
After liberating the entirety of Kharkiv Oblast in early October 2022, Ukraine turned its attention to Kherson in the south. This was a different fight, and in some ways Ukraine’s military followed Chinese military strategist Sun Tzu’s axiom of “winning without fighting.”
The Ukrainians were able to conquer much of the territory without using many troops on the ground.
Russia’s best forces have been decimated throughout the conflict, and it is now increasingly relying on untrained conscripts.
Likewise, Russia is exhausting much of its weaponry as international sanctions against them are limiting Russia’s wartime production. Aside from Iran, few nations are providing military aid to Russia.
Russia’s military is now less trained, has lower morale, and has significantly fewer weapons and less ammunition than it had at the beginning of the current war.
As a result, Russia lacks the ability to conduct large-scale attacks, and it is left with little option but to continue what it has been doing: conducting missile strikes against targets that are either defenseless or offer little strategic value.
Limiting Russia’s options further, these strikes have been less effective as the war has progressed.
Winter should not affect these types of combat operations.
But snow will have an impact on Russia’s already stressed and underperforming logistical system, and the cold will further lower – if that is possible – the already low morale of Russia’s poorly outfitted and undertrained soldiers.
What to expect from Ukraine
As the smaller military, Ukraine cannot afford to take heavy losses.
Thus far, it has used a strategy of defending territory when it could, retreating when it should to preserve combat power, and attacking when the opportunities have presented themselves.
An important question must be asked. Why did it take six months for Ukraine to launch its counteroffensive?
One reason is that Ukraine had to wait several months for promised Western aid to arrive at its bases. In my view, a significant factor is the lengthy amount of time it takes to plan large counteroffensives and to position supplies, equipment and forces.
The fact that Ukraine conducted the counterattacks in succession suggests that Ukraine lacks the combat power to conduct two large-scale counterattacks at the same time.
Ukraine is going to need time to regroup, refit and plan for its next large-scale operation.
Thus, it seems reasonable that Ukraine will have to wait at least 30 to 45 days – maybe more – before it is ready to execute its next counteroffensive, which would be in the heart of winter.
While conducting an attack in winter may be difficult, off-road movement in the spring could become impossible, as the Russians discovered during their initial invasion in muddy and wet terrain.
It seems reasonable to conclude that Ukraine may wish to initiate its next counteroffensive while the ground is still frozen – and Russian troop morale is at its lowest point since the invasion.
With inflation on the rise, investor attention has shifted to more tangible assets such as zinc-lead. With a positive relationship with locals and good ESG, Slave Lake Zinc Corp. may be one company you want to add to your radar.
Inflation generally drives smart investors into tangible assets, and few assets are more tangible than ore-bearing ground. Hard to steal and easy to profit from, rich mining claims often provide the perfect, slow-but-steady appreciation to counterbalance the bipolar nature of the equities market.
In-ground zinc-lead, in particular, has become a prized commodity among investors seeking to diversify around the vagaries of commercial exchanges.
Zinc-lead “is among the most important of base metals, constituting an essential requirement of a country’s industrial development,” explained analyst Rick Mills on November 22, 2022. “The two metals keep us powered and sheltered, yet the zinc-lead sector has not seen a major discovery in over two decades, leading to concerns over resource depletion.”
Reporting on November 17, 2022, Echelon Capital Markets stated that BCA Research’s Chief Commodity and Energy Strategist Robert Ryan “noted that risks to the global demand picture have prompted a continued decline in copper prices year-to-date, with inventories at exchanges extending their downtrend prompting expectations for tight supply over the coming decade.”
The report goes on to explain funds raised for base metals increased 17% month-over-month to US$262,000,000 in October on rapidly expanding transaction volume. Currently, zinc is sitting at around US$1.38 per lb and lead at US$0.97, which is quite rich for the metals, and one company, in particular, to keep watch on isSlave Lake Zinc Corp. (SLZ:CSE).
Slave Lake’s name comes from the lake itself, and the company’s large claim lies somewhat south of this eponymous feature of the northern Canadian landscape.
The claim is in an area briefly mined for lead and zinc at the end of the second world war, but the owners at the time halted production after the market for the metals cratered in the 1950s.
American Yellowknife Mines, which operated the mine then, identified 67,950 tons grading 7.64% Zinc, 3.12% lead, 0.13% copper, and 8.22 grams per tonne (8.22 g/pt) silver near the Shaft Zone, an area that includes a headframe and underground drifting of over 400 meters into various smaller pits.
This zone includes drilling down to 200 meters, with complete mineralization found the whole way down. Samples from the pits contained 10% to 27% zinc plus lead. The existing 55-meter deep three-compartment shaft has a drift station at 45 meters providing access to a seam assayed at 55% lead, 13.5% zinc, and 84.4 g/t silver.
Technical analyst Clive Maund opined that “with the company looking set to move forward, the move looks like the beginning of a new uptrend following the tedious downtrend from the highs of last April, and it is viewed as a speculative Buy here.”
Of course, these uses are all somewhat niche compared to the metal’s primary industrial use in the galvanization process. Zinc is important enough that governments in both the U.S. and Canada designate it as a critical material.
Currently, Slave Lake is fully permitted with a has a Type A Land Use permit and Type B Water license to have a 49-person, 3-drill operation to begin with, which allows it to move forward immediately, further de-risking the company’s plans moving forward. Funding-dependent, the company could potentially start drilling tomorrow.
However, as it stands, Slave Lake Zinc Corp. is not producing any materials for sale.
Instead, the company is continuing to expand its claim as it does further geological work to map out the footprint of a large, high-quality hydrothermal formation.
“At this stage, we are highly focused on diminishing risk,” explained Slave Lake Zinc Corp.’s CEO, Ritch Wigham. He’s recently overseen the company’s expansion from a 600-acre claim to one that’s over 18,000 acres or 76.25 sqkm and has been busy acquiring permits and developing a strong “right of first refusal” working relationship with members of the local community.
Positive Relationships and ESG
Slave Lake Zinc Corp. is one of only two companies that have successfully negotiated the multi-year, international process required to allow tribal lands in Canada to revert to Crown ownership and be claimed by commercial producers.
“We can confirm that Slave Lake Zinc and the NWTMN have a positive working relationship, as provided for in the Collaboration Agreement between the NWTMN and Slave Lake Zinc,” explained Dr. Ronald Yaworsky of KHL Consulting, speaking on behalf of the nation itself. “Slave Lake Zinc has been respectful and proactive in [its] engagement
In addition to the considerable goodwill and rich in-ground reserves he has ferreted out, Wigham says the claim’s close proximity (about 37 miles) to the Taltson hydroelectric plant will allow for an ESG-forward, hydrocarbon-free operation once the mine is up and running.
Wigham’s strategy is to continue building the claim’s value by mitigating the risks any processor would face when taking on the site and ramping up to full production.
As it currently stands, Slave Lake Zinc Corp. is a basic buy-and-hold play for those interested in buying unexploited base metal reserves to hedge against either inflation or an equities market downturn. The company plans to start a comprehensive drilling program early next year to quantify in-ground reserves better and explore claim expansion opportunities.
On November 9, 2022, technical analyst Clive Maund opined that “with the company looking set to move forward, the move [up on Nov 8th, 2022] looks like the beginning of a new uptrend following the tedious downtrend from the highs of last April, and it is viewed as a speculative Buy here, and especially on any near-term dips.”
Ownership, Coverage, and Share Structure
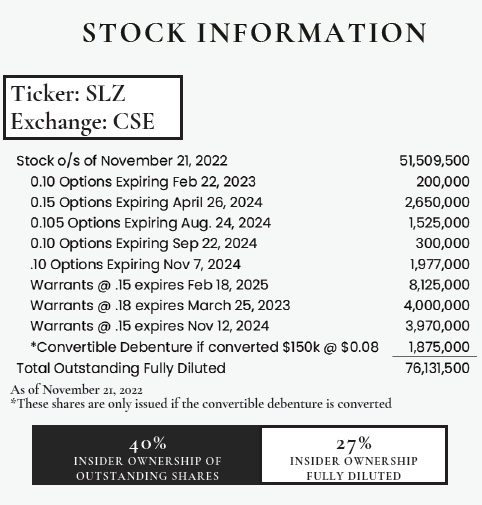
Source: Slave Lake Zinc Corp.
Company management owns approximately 20.8 million shares — 40% of outstanding shares, or 27% on a fully diluted basis. There are no institutional investors on record, and all of the outstanding stock is retail except for the CA$150,000.00 balance of the debenture outstanding.
Technical analyst Clive Maund of Clivemaund.com follows this stock. Click See More Live Data” to view more of what he is saying.
The company has roughly CA$300,000 in the bank and is burning CA$25,000/month at current operating levels.
Slave Lake also has 6,652,000 options in the CA$0.10 to CA$0.15 price range expiring between Feb 22, 2023, and Nov 7, 2024, as well as 16,095,000 warrants ranging from CA$0.15 to CA$0.18 expiring between March 25, 2023, and Feb 18, 2025.
An additional CA$150,000 in CA$0.08 convertible debenture financing adds another 1,875,000 potential claims. The total outstanding fully diluted share count is 76,131,500.
Slave Lake Zinc Corp. has a market cap of around US$3.153 million, with 51,509,500 shares outstanding, and it trades in the 52-week range of US$0.0115 and US$0.1429.
Disclosures: 1) Owen Ferguson wrote this article for Streetwise Reports LLC and provides services to Streetwise Reports as an independent contractor. He or members of his household own securities of the following companies mentioned in the article: None. He or members of his household are paid by the following companies mentioned in this article: None.
2) The following companies mentioned in this article are billboard sponsors of Streetwise Reports: None. Click here for important disclosures about sponsor fees. The information provided above is for informational purposes only and is not a recommendation to buy or sell any security. As of the date of this article, an affiliate of Streetwise Reports has a consulting relationship with Slave Lake Zinc Corp. Please click herefor more information.
3) Statements and opinions expressed are the opinions of the author and not of Streetwise Reports or its officers. The author is wholly responsible for the validity of the statements. The author was not paid by Streetwise Reports for this article. Streetwise Reports was not paid by the author to publish or syndicate this article. Streetwise Reports requires contributing authors to disclose any shareholdings in, or economic relationships with, companies that they write about. Streetwise Reports relies upon the authors to accurately provide this information and Streetwise Reports has no means of verifying its accuracy.
4) This article does not constitute investment advice. Each reader is encouraged to consult with his or her individual financial professional and any action a reader takes as a result of information presented here is his or her own responsibility. By opening this page, each reader accepts and agrees to Streetwise Reports’ terms of use and full legal disclaimer. This article is not a solicitation for investment. Streetwise Reports does not render general or specific investment advice and the information on Streetwise Reports should not be considered a recommendation to buy or sell any security. Streetwise Reports does not endorse or recommend the business, products, services or securities of any company mentioned on Streetwise Reports.
5) From time to time, Streetwise Reports LLC and its directors, officers, employees or members of their families, as well as persons interviewed for articles and interviews on the site, may have a long or short position in securities mentioned. Directors, officers, employees or members of their immediate families are prohibited from making purchases and/or sales of those securities in the open market or otherwise from the time of the decision to publish an article until three business days after the publication of the article. The foregoing prohibition does not apply to articles that in substance only restate previously published company releases. As of the date of this article, officers and/or employees of Streetwise Reports LLC (including members of their household) own securities of Slave Lake Zinc Corp., a company mentioned in this article.
Instead of a Santa Claus rally, the US stock indices have been under selling pressure in recent days. As the stock market closed Tuesday, the Dow Jones Index (US30) decreased by 1.03%, and the S&P 500 Index (US500) lost 1.44%. The technology Index NASDAQ (US100) was down by 2.00% yesterday. All three indices closed negative.
After strong jobs and services data in recent days, traders and investors are reassessing the risks and probabilities of how the Fed will act next and how much it will raise rates in the future. Analysts point to a 91% chance that the US central bank could raise rates by 50 basis points at its December 13-14 meeting, with rates expected to peak at 4.98% in May 2023. Concerns about lower economic growth come amid disappointing forecasts from banks such as Bank of America, J.P. Morgan, and BlackRock, which predict a recession in 2023.
The CEO of Bank of America Corp (BAC) predicted moderate negative growth for three-quarters of next year, while JPMorgan Chase (JPM) Governor Jamie Dimon said inflation would reduce consumer purchasing power and that inflation will be moderate or more pronounced. That said, there is a recession ahead of everyone. Analysts at BlackRock (BLK) believe an aggressive tightening of monetary policy by the US Federal Reserve to combat stubbornly high price increases could trigger an economic slowdown in 2023.
Shares of Meta Platforms Inc (META) fell by 6.8% yesterday after reports that European Union regulators ruled that the company should not require users to consent to personalized advertising based on their digital activity.
Stock markets in Europe were mostly down yesterday. German DAX (DE30) decreased by 0.72%, French CAC 40 (FR40) lost 0.14%, Spanish IBEX 35 (ES35) fell by 0.46%, and British FTSE 100 (UK100) closed on Tuesday down by 0.61%.
The UK Construction Business Activity Index fell to a three-month low. Business expectations were the weakest since May 2020. Rising interest rates, higher borrowing costs, and worries about the economic outlook reduced construction activity. The UK economic outlook remains bleak, but the new government is doing everything it can to cushion the falling economy. Analysts believe that economic indicators will decline until spring-summer 2023, after which they will reach a low point and then begin a slow recovery.
The Eurozone will have revised GDP data today. Growth in the region has slowed in recent months due to high energy costs and rising interest rates, and this trend is likely to continue until the end of the first quarter of 2023. On the other hand, the imposition of a ceiling on Russian oil, which went into effect on Monday, may soon begin to show its impact on Europe’s energy market in the direction of lower prices.
Europe’s energy market in the direction of lower prices. Tuesday’s drop was the biggest daily drop in oil prices since late September. Russia has said it will not sell oil to anyone who signs up to a price ceiling. Oil markets are likely to remain volatile in the near term due to news about COVID in China and the policies of the US and European central banks.
Asian markets were mostly down yesterday. Japan’s Nikkei 225 (JP225) gained 0.24%, Hong Kong’s Hang Seng (HK50) ended the day down by 0.40%, and Australia’s S&P/ASX 200 (AU200) fell by 0.47%.
Major Chinese cities have already loosened some travel restrictions and testing requirements in the face of a pronounced economic slowdown. Data released earlier Wednesday showed that the country’s foreign trade is in its worst condition since 2020.
Bank of Japan Governor Kuroda stated that the Bank of Japan is aiming for a steady and stable inflation target of 2%, accompanied by wage growth. Japan’s largest labor union decided last week to call for a wage increase of about 5% next spring, the highest demand in 28 years. The move indicates that Japan intends to fight rising prices by regulating wage levels rather than by changing monetary policy.
Australia’s GDP grew just 0.6% in the third quarter, below the previous figure of 0.9% and below the expected 0.7%. On the one hand, this is the fourth consecutive quarter of positive growth; on the other hand, it is the weakest over the past year. Annual GDP rose by 5.9% but below the 6.2% forecast. According to RBA forecasts, GDP is expected to continue to decline through 2024.
S&P 500 (F) (US500) 3,941.26 −57.58 (−1.44%)
Dow Jones (US30) 33,596.34 −350.76 (−1.03%)
DAX (DE40) 14,343.19 −104.42 (−0.72%)
FTSE 100 (UK100) 7,521.39 −46.15 (−0.61%)
USD Index 105.58 +0.29 (+0.28%)
Important events for today:
– Australia GDP (q/q) at 02:30 (GMT+3);
– China Trade Balance (m/m) at 05:00 (GMT+3);
– Switzerland Unemployment Rate (m/m) at 08:45 (GMT+3);
– German Industrial Production (m/m) at 09:00 (GMT+3);
– Eurozone GDP (q/q) at 12:00 (GMT+3);
– Canada BoC Interest Rate Decision at 17:00 (GMT+3);
This article reflects a personal opinion and should not be interpreted as an investment advice, and/or offer, and/or a persistent request for carrying out financial transactions, and/or a guarantee, and/or a forecast of future events.












 Article by