
By InvestMacro
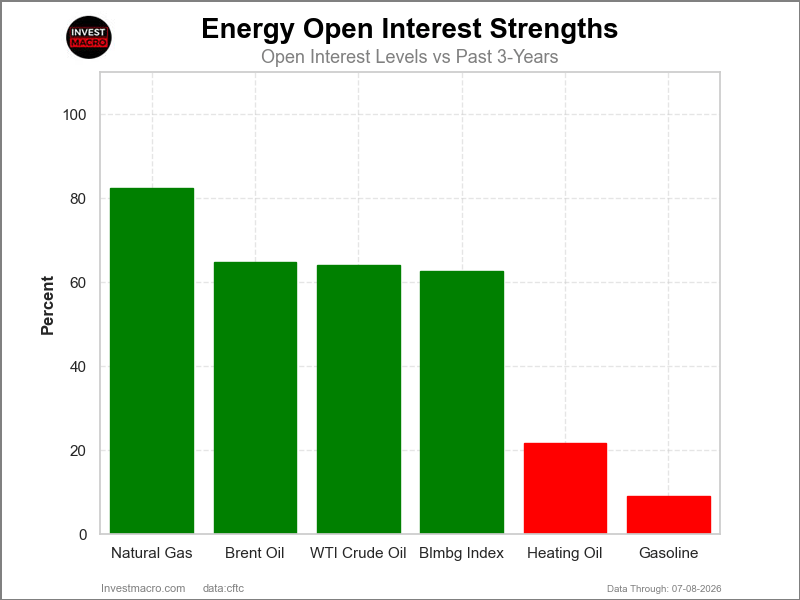
Here are the latest charts and statistics for the Commitment of Traders (COT) data published by the Commodities Futures Trading Commission (CFTC).
The latest COT data is updated through Tuesday July 7th and shows a quick view of how large traders (for-profit speculators and commercial entities) were positioned in the futures markets.
Weekly Speculator Changes led by Brent Oil
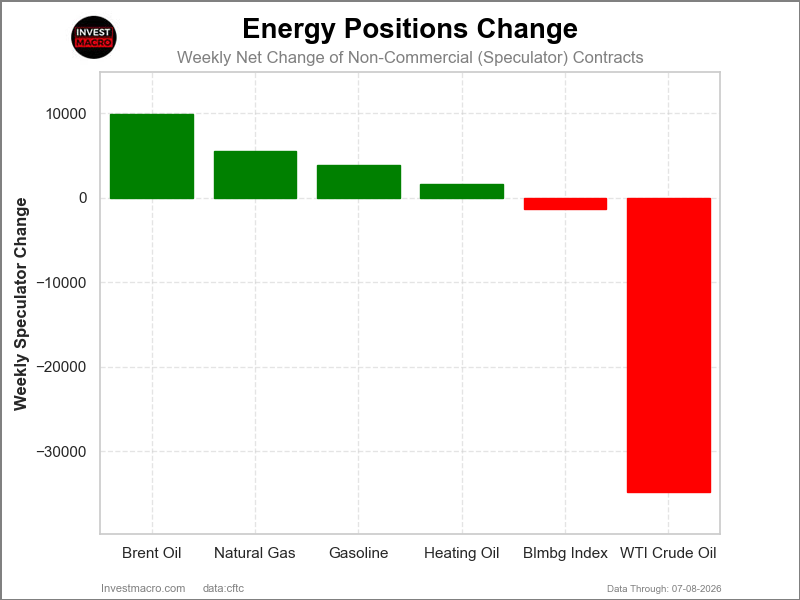
The COT energy market speculator bets were higher this week as four out of the six energy markets we cover had higher positioning while the other two markets had lower speculator contracts.
Leading the gains for the energy markets was Brent Oil (9,883 contracts) with Natural Gas (5,496 contracts), Gasoline (3,893 contracts) and Heating Oil (1,594 contracts) also having positive weeks.
The markets with declines in speculator bets for the week were WTI Crude (-34,782 contracts) and with the Bloomberg Index (-1,318 contracts) also seeing lower bets on the week.
Free Reports:
 Sign Up for Our Stock Market Newsletter – Get updated on News, Charts & Rankings of Public Companies when you join our Stocks Newsletter
 Get our Weekly Commitment of Traders Reports - See where the biggest traders (Hedge Funds and Commercial Hedgers) are positioned in the futures markets on a weekly basis.
Heating Oil leads Energy Markets price performance
Leading the Energy Markets price performances this week was Heating Oil, which saw a gain by 9.63% over the past five days. Gasoline came in second with a 7.59% rise, while Brent Oil was third with a 6.16% increase. WTI Crude Oil was up by 4.11% on the week and the Bloomberg Commodity Index rounded out the gainers with a 3.46% advance.
On the downside, Natural Gas was the only decliner with a -8.10% drop.
All of these six Energy Markets have seen lower levels or negative price gains over the past 30 days, while over the past 90 days, all of the Energy Markets have been lower except for the Bloomberg Commodity Index, which has risen by 3.32% in the past 90 days.
Energy Data:
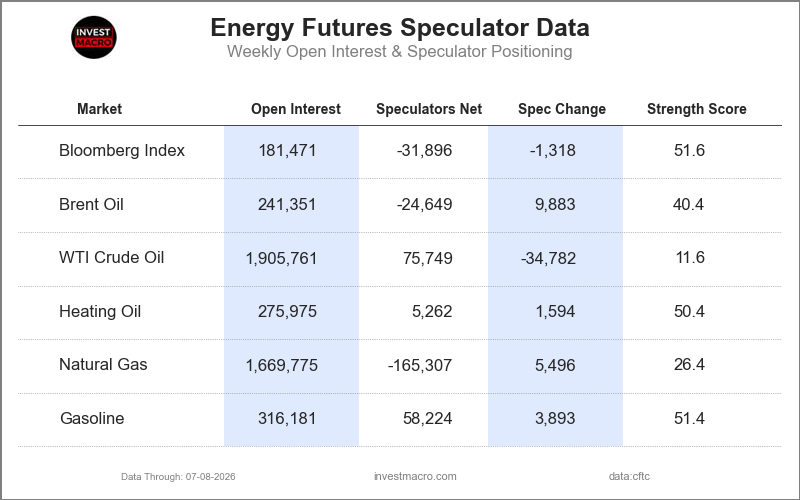
Legend: Weekly Speculators Change | Speculators Current Net Position | Speculators Strength Score compared to last 3-Years (0-100 range)
Strength Scores led by Bloomberg Index, Gasoline & Heating Oil
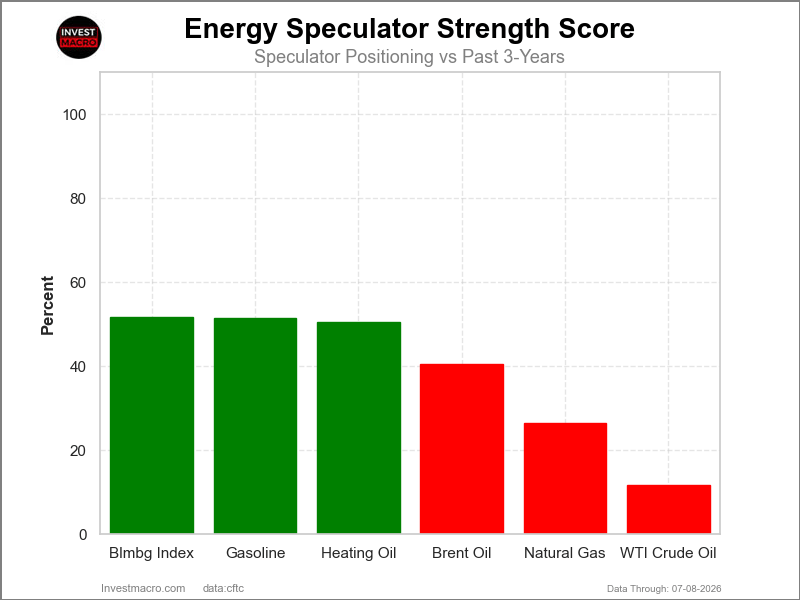
COT Strength Scores (a normalized measure of Speculator positions over a 3-Year range, from 0 to 100 where above 80 is Extreme-Bullish and below 20 is Extreme-Bearish) showed that Bloomberg Index (51.6 percent), Gasoline (51.4 percent) and Heating Oil (50.4 percent) lead the energy markets this week.
On the downside, WTI Crude (11.6 percent) comes in at the lowest strength level currently and is in Extreme-Bearish territory (below 20 percent). The next lowest strength score was Natural Gas (26.4 percent).
Strength Statistics:
WTI Crude Oil (11.6 percent) vs WTI Crude Oil previous week (22.8 percent)
Brent Crude Oil (40.4 percent) vs Brent Crude Oil previous week (24.8 percent)
Natural Gas (26.4 percent) vs Natural Gas previous week (22.9 percent)
Gasoline (51.4 percent) vs Gasoline previous week (47.1 percent)
Heating Oil (50.4 percent) vs Heating Oil previous week (48.3 percent)
Bloomberg Commodity Index (51.6 percent) vs Bloomberg Commodity Index previous week (52.8 percent)
Bloomberg Index & Natural Gas top the 6-Week Strength Trends
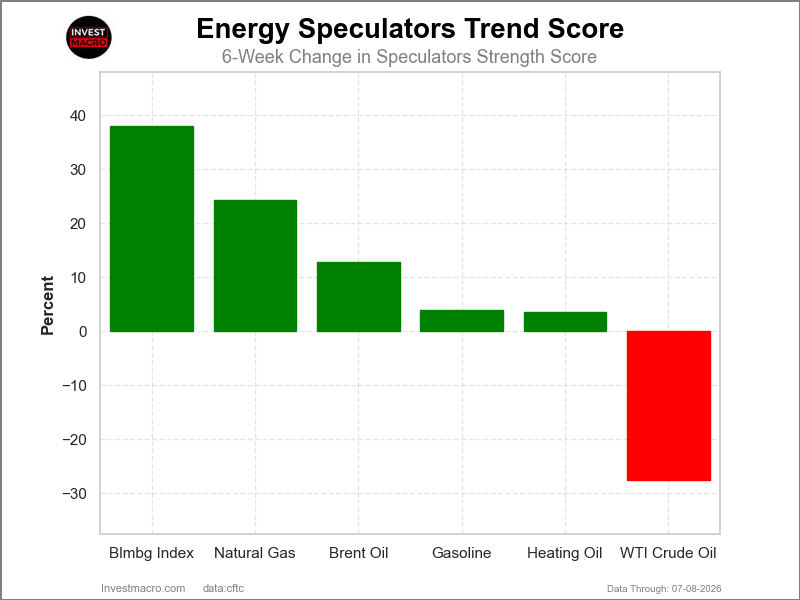
COT Strength Score Trends (or move index, calculates the 6-week changes in strength scores) showed that Bloomberg Index (38.0 percent) and Natural Gas (24.3 percent) lead the past six weeks trends for the energy markets. Brent Crude Oil (12.9 percent) is the next highest positive mover in the latest trends data.
WTI Crude (-27.5 percent) leads the downside trend scores currently.
Move Statistics:
WTI Crude Oil (-27.5 percent) vs WTI Crude Oil previous week (-20.0 percent)
Brent Crude Oil (12.9 percent) vs Brent Crude Oil previous week (-15.1 percent)
Natural Gas (24.3 percent) vs Natural Gas previous week (13.7 percent)
Gasoline (4.0 percent) vs Gasoline previous week (3.8 percent)
Heating Oil (3.5 percent) vs Heating Oil previous week (-2.6 percent)
Bloomberg Commodity Index (38.0 percent) vs Bloomberg Commodity Index previous week (40.2 percent)
Individual COT Market Charts:
WTI Crude Oil Futures Futures:
 Positioning Notes:
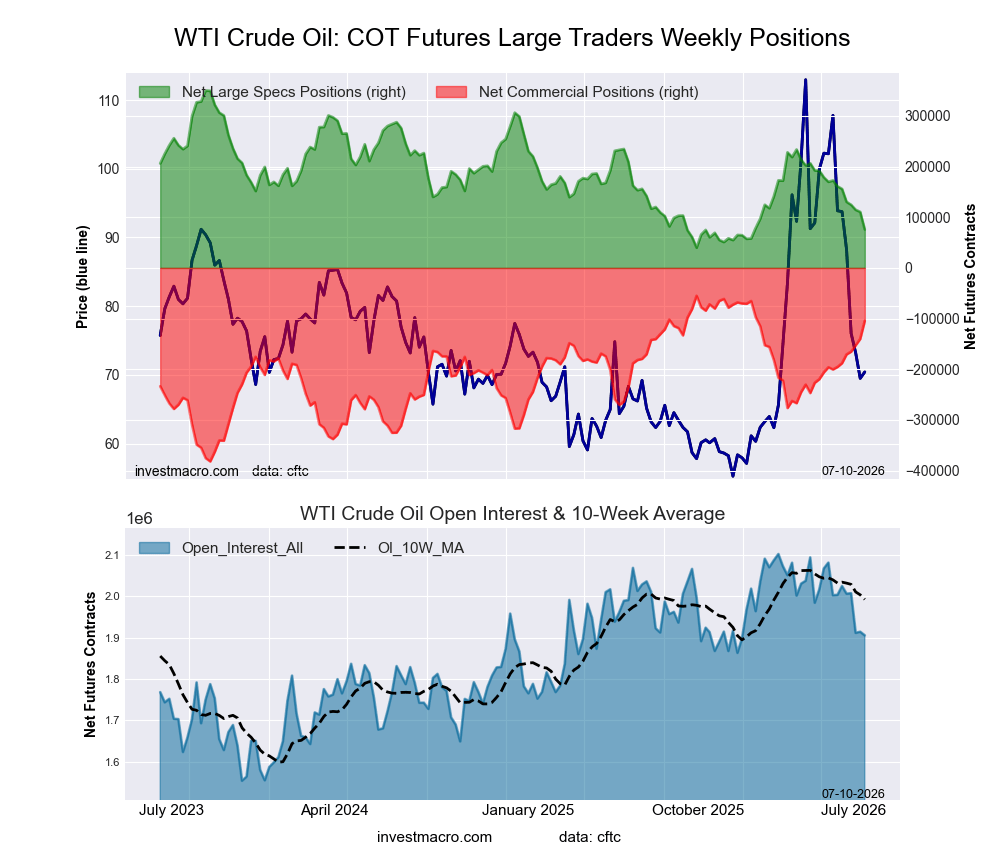
- WTI Crude Oil Futures large speculator standing this week recorded a net position of 75,749 contracts in the data reported through Tuesday.
- Weekly Speculator position decrease of -34,782 contracts from the previous week which had a total of 110,531 net contracts.
- This week’s current strength score (range over the past 3 years, measured from 0 to 100) shows the speculators are currently Bearish-Extreme with a score of 11.6 percent.
- The Commercials are Bullish-Extreme with a score of 84.8 percent.
- The Small Traders (not shown in chart) are Bullish with a score of 57.9 percent.
Price Trend-Following Model: Strong Downtrend
Our weekly trend-following model classifies the current market price position as: Strong Downtrend.
| WTI Crude Oil Futures Statistics | SPECULATORS | COMMERCIALS | SMALL TRADERS |
| – Percent of Open Interest Longs: | 16.7 | 48.5 | 4.1 |
| – Percent of Open Interest Shorts: | 12.7 | 54.0 | 2.6 |
| – Net Position: | 75,749 | -104,622 | 28,873 |
| – Gross Longs: | 317,773 | 924,510 | 78,825 |
| – Gross Shorts: | 242,024 | 1,029,132 | 49,952 |
| – Long to Short Ratio: | 1.3 to 1 | 0.9 to 1 | 1.6 to 1 |
| NET POSITION TREND: | |||
| – Strength Index Score (3 Year Range Pct): | 11.6 | 84.8 | 57.9 |
| – Strength Index Reading (3 Year Range): | Bearish-Extreme | Bullish-Extreme | Bullish |
| NET POSITION MOVEMENT INDEX: | |||
| – 6-Week Change in Strength Index: | -27.5 | 27.8 | -11.1 |
Brent Crude Oil Futures Futures:
 Positioning Notes:
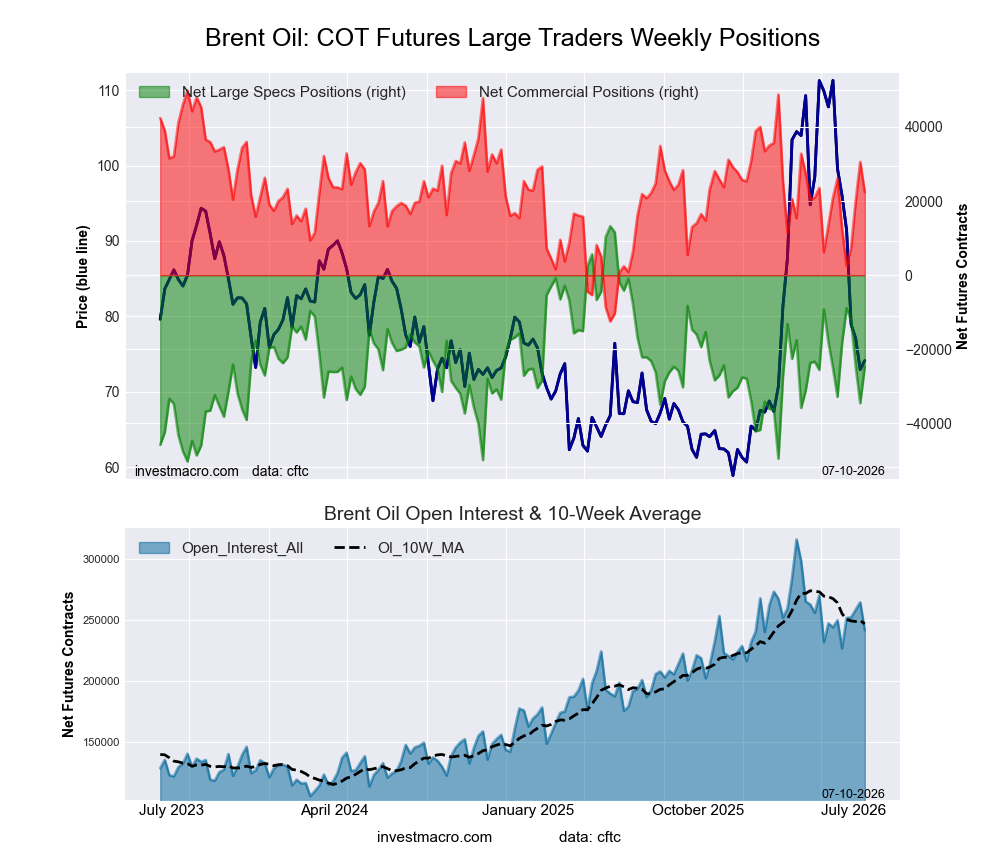
- Brent Crude Oil Futures large speculator standing this week recorded a net position of -24,649 contracts in the data reported through Tuesday.
- Weekly Speculator position gain of 9,883 contracts from the previous week which had a total of -34,532 net contracts.
- This week’s current strength score (range over the past 3 years, measured from 0 to 100) shows the speculators are currently Bearish with a score of 40.4 percent.
- The Commercials are Bullish with a score of 56.0 percent.
- The Small Traders (not shown in chart) are Bullish with a score of 53.4 percent.
Price Trend-Following Model: Strong Downtrend
Our weekly trend-following model classifies the current market price position as: Strong Downtrend.
| Brent Crude Oil Futures Statistics | SPECULATORS | COMMERCIALS | SMALL TRADERS |
| – Percent of Open Interest Longs: | 21.2 | 36.0 | 3.5 |
| – Percent of Open Interest Shorts: | 31.5 | 26.7 | 2.6 |
| – Net Position: | -24,649 | 22,442 | 2,207 |
| – Gross Longs: | 51,281 | 86,780 | 8,476 |
| – Gross Shorts: | 75,930 | 64,338 | 6,269 |
| – Long to Short Ratio: | 0.7 to 1 | 1.3 to 1 | 1.4 to 1 |
| NET POSITION TREND: | |||
| – Strength Index Score (3 Year Range Pct): | 40.4 | 56.0 | 53.4 |
| – Strength Index Reading (3 Year Range): | Bearish | Bullish | Bullish |
| NET POSITION MOVEMENT INDEX: | |||
| – 6-Week Change in Strength Index: | 12.9 | -5.8 | -46.6 |
Natural Gas Futures Futures:
 Positioning Notes:
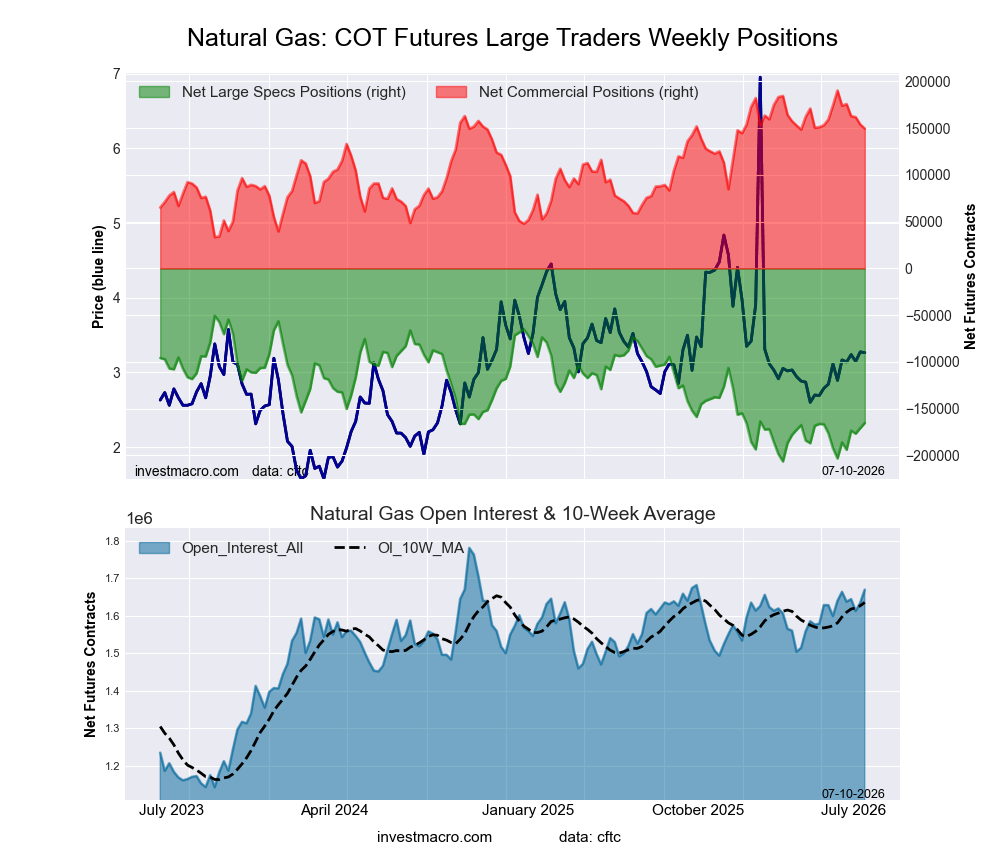
- Natural Gas Futures large speculator standing this week recorded a net position of -165,307 contracts in the data reported through Tuesday.
- Weekly Speculator position increase of 5,496 contracts from the previous week which had a total of -170,803 net contracts.
- This week’s current strength score (range over the past 3 years, measured from 0 to 100) shows the speculators are currently Bearish with a score of 26.4 percent.
- The Commercials are Bullish with a score of 74.0 percent.
- The Small Traders (not shown in chart) are Bearish with a score of 43.1 percent.
Price Trend-Following Model: Weak Uptrend
Our weekly trend-following model classifies the current market price position as: Weak Uptrend.
| Natural Gas Futures Statistics | SPECULATORS | COMMERCIALS | SMALL TRADERS |
| – Percent of Open Interest Longs: | 16.4 | 32.4 | 3.2 |
| – Percent of Open Interest Shorts: | 26.3 | 23.5 | 2.3 |
| – Net Position: | -165,307 | 149,504 | 15,803 |
| – Gross Longs: | 273,556 | 541,591 | 53,470 |
| – Gross Shorts: | 438,863 | 392,087 | 37,667 |
| – Long to Short Ratio: | 0.6 to 1 | 1.4 to 1 | 1.4 to 1 |
| NET POSITION TREND: | |||
| – Strength Index Score (3 Year Range Pct): | 26.4 | 74.0 | 43.1 |
| – Strength Index Reading (3 Year Range): | Bearish | Bullish | Bearish |
| NET POSITION MOVEMENT INDEX: | |||
| – 6-Week Change in Strength Index: | 24.3 | -26.0 | 7.1 |
Gasoline Blendstock Futures Futures:
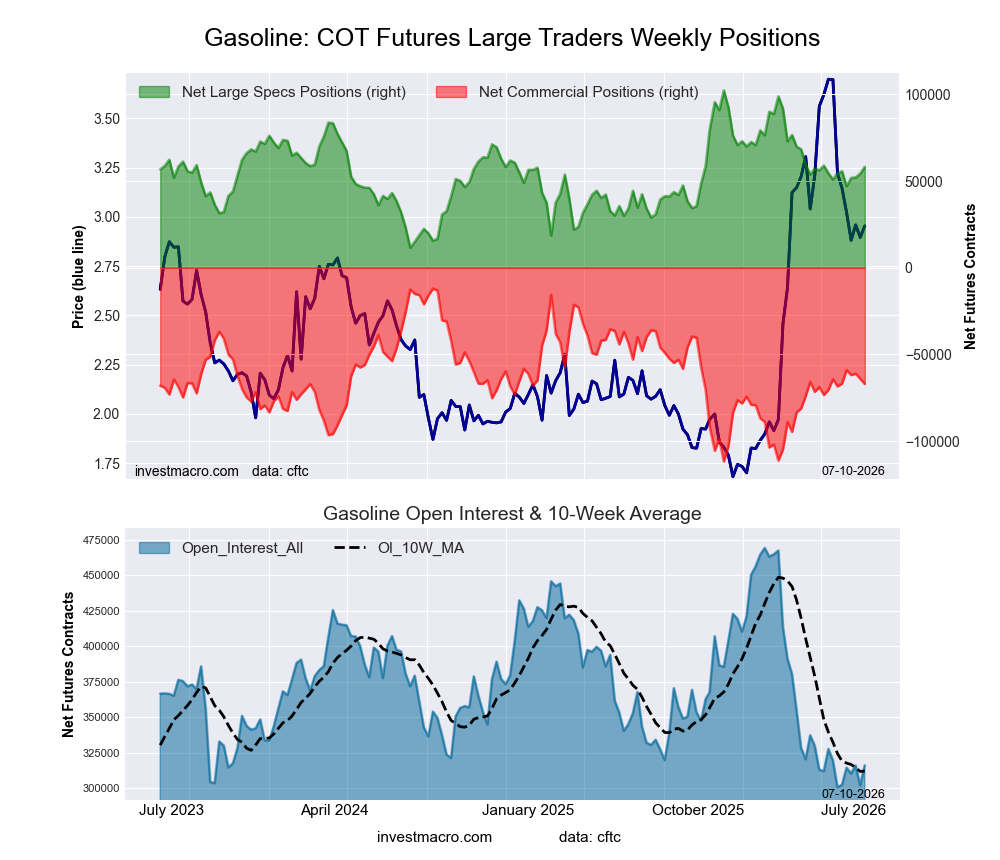 Positioning Notes:
- Gasoline Blendstock Futures large speculator standing this week recorded a net position of 58,224 contracts in the data reported through Tuesday.
- Weekly Speculator position increase of 3,893 contracts from the previous week which had a total of 54,331 net contracts.
- This week’s current strength score (range over the past 3 years, measured from 0 to 100) shows the speculators are currently Bullish with a score of 51.4 percent.
- The Commercials are Bearish with a score of 44.8 percent.
- The Small Traders (not shown in chart) are Bullish with a score of 57.6 percent.
Price Trend-Following Model: Weak Uptrend
Our weekly trend-following model classifies the current market price position as: Weak Uptrend.
| Nasdaq Mini Futures Statistics | SPECULATORS | COMMERCIALS | SMALL TRADERS |
| – Percent of Open Interest Longs: | 32.2 | 42.0 | 7.5 |
| – Percent of Open Interest Shorts: | 13.8 | 63.2 | 4.7 |
| – Net Position: | 58,224 | -67,028 | 8,804 |
| – Gross Longs: | 101,734 | 132,929 | 23,619 |
| – Gross Shorts: | 43,510 | 199,957 | 14,815 |
| – Long to Short Ratio: | 2.3 to 1 | 0.7 to 1 | 1.6 to 1 |
| NET POSITION TREND: | |||
| – Strength Index Score (3 Year Range Pct): | 51.4 | 44.8 | 57.6 |
| – Strength Index Reading (3 Year Range): | Bullish | Bearish | Bullish |
| NET POSITION MOVEMENT INDEX: | |||
| – 6-Week Change in Strength Index: | 4.0 | 1.4 | -22.8 |
#2 Heating Oil NY-Harbor Futures Futures:
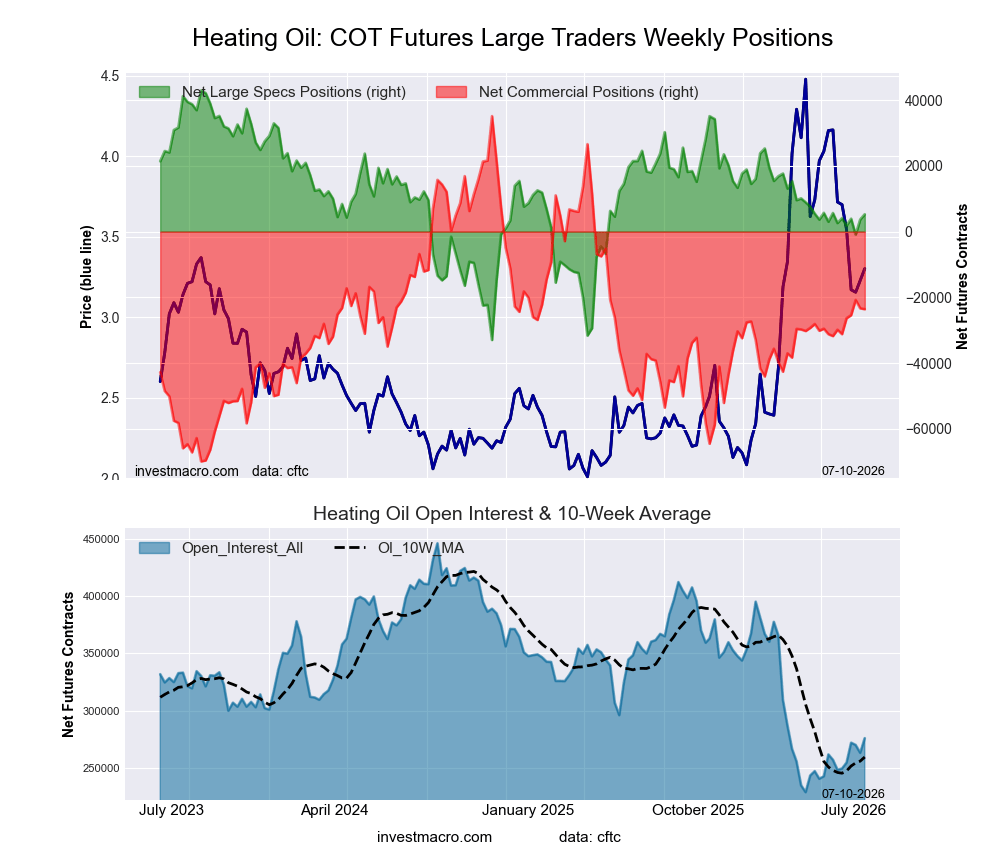 Positioning Notes:
- #2 Heating Oil NY-Harbor Futures large speculator standing this week recorded a net position of 5,262 contracts in the data reported through Tuesday.
- Weekly Speculator position gain of 1,594 contracts from the previous week which had a total of 3,668 net contracts.
- This week’s current strength score (range over the past 3 years, measured from 0 to 100) shows the speculators are currently Bullish with a score of 50.4 percent.
- The Commercials are Bearish with a score of 44.1 percent.
- The Small Traders (not shown in chart) are Bullish with a score of 68.2 percent.
Price Trend-Following Model: Downtrend
Our weekly trend-following model classifies the current market price position as: Downtrend.
| Heating Oil Futures Statistics | SPECULATORS | COMMERCIALS | SMALL TRADERS |
| – Percent of Open Interest Longs: | 18.0 | 46.2 | 16.5 |
| – Percent of Open Interest Shorts: | 16.0 | 54.7 | 9.9 |
| – Net Position: | 5,262 | -23,596 | 18,334 |
| – Gross Longs: | 49,554 | 127,375 | 45,673 |
| – Gross Shorts: | 44,292 | 150,971 | 27,339 |
| – Long to Short Ratio: | 1.1 to 1 | 0.8 to 1 | 1.7 to 1 |
| NET POSITION TREND: | |||
| – Strength Index Score (3 Year Range Pct): | 50.4 | 44.1 | 68.2 |
| – Strength Index Reading (3 Year Range): | Bullish | Bearish | Bullish |
| NET POSITION MOVEMENT INDEX: | |||
| – 6-Week Change in Strength Index: | 3.5 | 6.0 | -24.3 |
Bloomberg Commodity Index Futures Futures:
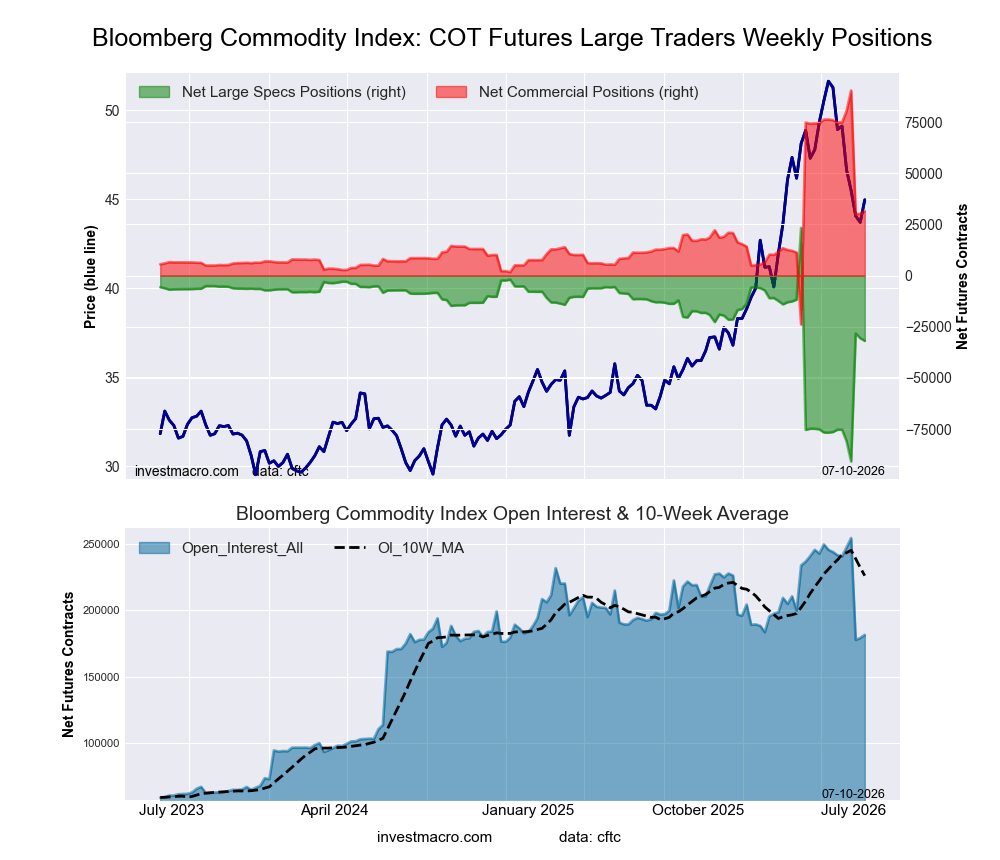 Positioning Notes:
- Bloomberg Commodity Index Futures large speculator standing this week recorded a net position of -31,896 contracts in the data reported through Tuesday.
- Weekly Speculator position lowering of -1,318 contracts from the previous week which had a total of -30,578 net contracts.
- This week’s current strength score (range over the past 3 years, measured from 0 to 100) shows the speculators are currently Bullish with a score of 51.6 percent.
- The Commercials are Bearish with a score of 48.4 percent.
- The Small Traders (not shown in chart) are Bullish with a score of 79.3 percent.
Price Trend-Following Model: Strong Downtrend
Our weekly trend-following model classifies the current market price position as: Strong Downtrend.
| Bloomberg Index Futures Statistics | SPECULATORS | COMMERCIALS | SMALL TRADERS |
| – Percent of Open Interest Longs: | 46.5 | 50.7 | 0.3 |
| – Percent of Open Interest Shorts: | 64.1 | 33.3 | 0.0 |
| – Net Position: | -31,896 | 31,468 | 428 |
| – Gross Longs: | 84,392 | 91,955 | 487 |
| – Gross Shorts: | 116,288 | 60,487 | 59 |
| – Long to Short Ratio: | 0.7 to 1 | 1.5 to 1 | 8.3 to 1 |
| NET POSITION TREND: | |||
| – Strength Index Score (3 Year Range Pct): | 51.6 | 48.4 | 79.3 |
| – Strength Index Reading (3 Year Range): | Bullish | Bearish | Bullish |
| NET POSITION MOVEMENT INDEX: | |||
| – 6-Week Change in Strength Index: | 38.0 | -37.9 | -1.6 |
Article By InvestMacro – Receive our weekly COT Reports by Email
*COT Report: The COT data, released weekly to the public each Friday, is updated through the most recent Tuesday (data is 3 days old) and shows a quick view of how large speculators or non-commercials (for-profit traders) were positioned in the futures markets.
The CFTC categorizes trader positions according to commercial hedgers (traders who use futures contracts for hedging as part of the business), non-commercials (large traders who speculate to realize trading profits) and nonreportable traders (usually small traders/speculators) as well as their open interest (contracts open in the market at time of reporting).See CFTC criteria here.
All information and opinions on this website and contained in this article are for general informational purposes only and do not constitute investment advice.

- COT Metals Charts: Weekly Speculator Bets see small gains for Silver & Gold Jul 12, 2026
- COT Bonds Charts: Speculator Bets led by SOFR 3-Months & 2-Year Bonds Jul 12, 2026
- COT Energy Charts: Weekly Speculator Changes led by Brent Oil Jul 12, 2026
- COT Soft Commodities Charts: Weekly Speculator Changes led by Sugar, Corn & Soybeans Jul 12, 2026
- The US and European stock indices are rising again amid renewed investor interest in the AI industry. Jul 10, 2026
- USD/JPY Falls as Yen Recovers Weekly Losses Jul 10, 2026
- Crude oil prices surged sharply by 7% in reaction to the rapid escalation of the conflict in the Middle East Jul 9, 2026
- Middle East Tensions Weigh on Gold Jul 9, 2026
- Pound Awaits Tighter Policy from Bank of England Jul 8, 2026
- The United States carried out airstrikes on Iran after Iran’s attacked tankers in the Strait of Hormuz. The RBNZ raised the interest rate to 2.5% Jul 8, 2026
