
By InvestMacro
Here are the latest charts and statistics for the Commitment of Traders (COT) data published by the Commodities Futures Trading Commission (CFTC).
The latest COT data is updated through Tuesday May 19th and shows a quick view of how large traders (for-profit speculators and commercial entities) were positioned in the futures markets.
Weekly Speculator Changes led by WTI Crude & Heating Oil
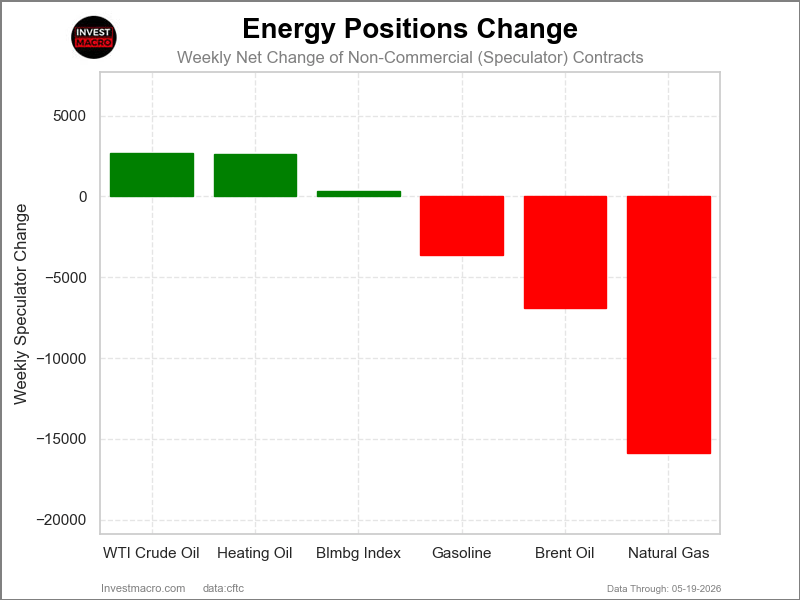
The COT energy market speculator bets were mixed this week as three out of the six energy markets we cover had higher positioning while the other three markets had lower speculator contracts.
Leading the gains for the energy markets with a modest weekly rise was WTI Crude (2,703 contracts) with Heating Oil (2,635 contracts) and the Bloomberg Index (315 contracts) also having positive weeks.
The markets with declines in speculator bets for the week were Natural Gas (-15,890 contracts), Brent Oil (-6,932 contracts) and with Gasoline (-3,596 contracts) also seeing lower bets on the week.
Free Reports:
 Get our Weekly Commitment of Traders Reports - See where the biggest traders (Hedge Funds and Commercial Hedgers) are positioned in the futures markets on a weekly basis.
 Download Our Metatrader 4 Indicators – Put Our Free MetaTrader 4 Custom Indicators on your charts when you join our Weekly Newsletter
Energy Markets price performance lower across the board.
The Energy Markets saw lower prices across the board with all six of the markets we cover seeing weekly declines. The lowest weekly decline for the past five days was by the Bloomberg Commodity Index, which fell by -1.94%. Natural Gas came in second with a -3.61% decline, and Gasoline fell by almost -4% with a -3.96% shortfall.
Heating Oil was next with a -5.42% decrease on the week, while WTI Crude Oil dropped by -6.78%. Brent Oil saw the biggest decline on the week with a -7.25% drop.
All the Energy Markets have seen higher percentages over the past 30 days, with Gasoline the highest at a 16.68% increase over the past 30 days.
Natural Gas is the only market with a decline over the past 90 days as it has fallen by -16.98%. Gasoline prices are up 78.39% over the past 90 days. Heating Oil, WTI Crude Oil, and Brent Oil are all higher by over 50% in these past 90 days.
Energy Data:
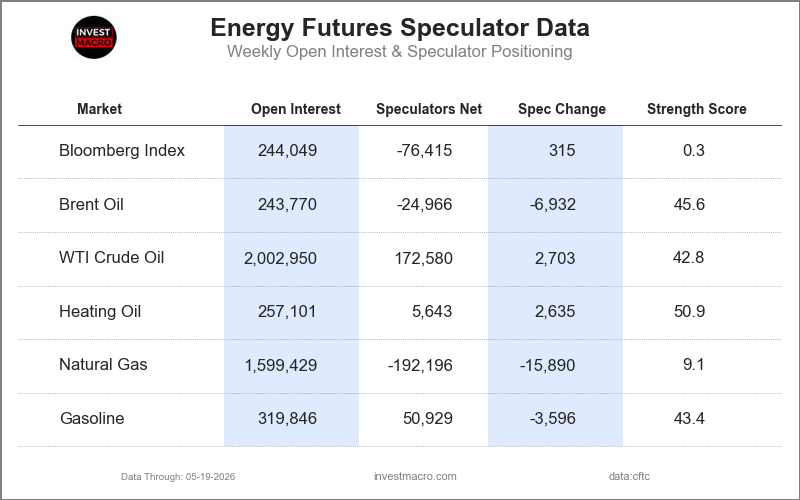
Legend: Weekly Speculators Change | Speculators Current Net Position | Speculators Strength Score compared to last 3-Years (0-100 range)
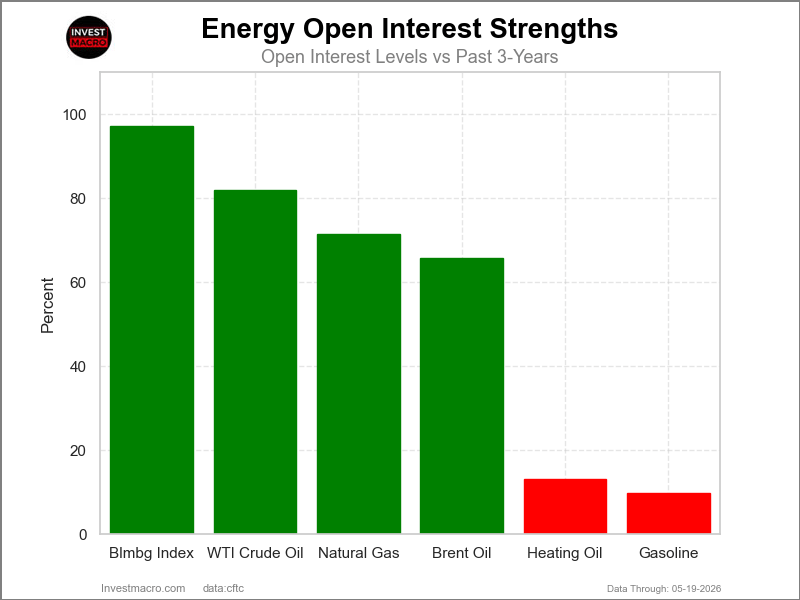
Strength Scores led by Heating Oil
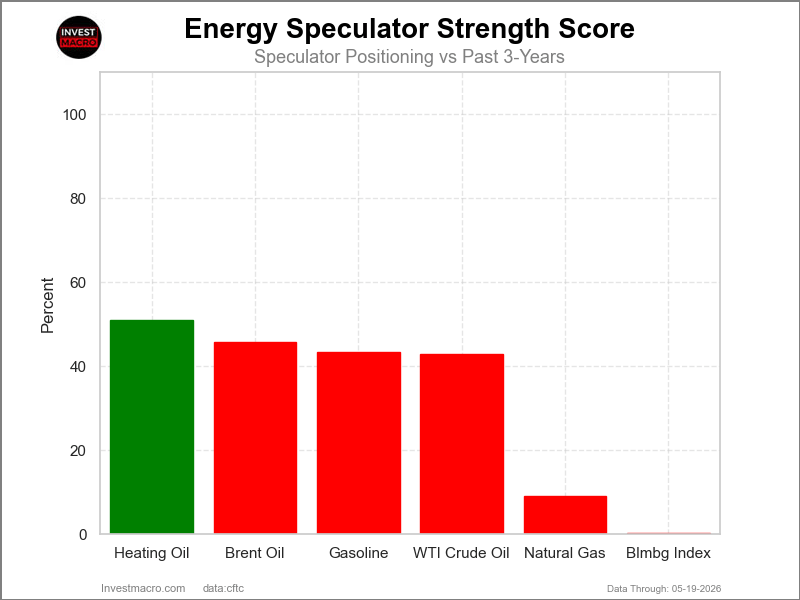
COT Strength Scores (a normalized measure of Speculator positions over a 3-Year range, from 0 to 100 where above 80 is Extreme-Bullish and below 20 is Extreme-Bearish) showed that Heating Oil (50.9 percent) leads the energy markets this week.
On the downside, the Bloomberg Commodity Index (0.3 percent) and Natural Gas (9.1 percent) come in at the lowest strength level currently and are in Extreme-Bearish territory (below 20 percent). The next lowest strength score was WTI Crude (42.8 percent).
Strength Statistics:
WTI Crude Oil (42.8 percent) vs WTI Crude Oil previous week (41.9 percent)
Brent Crude Oil (45.6 percent) vs Brent Crude Oil previous week (55.4 percent)
Natural Gas (9.1 percent) vs Natural Gas previous week (19.3 percent)
Gasoline (43.4 percent) vs Gasoline previous week (47.4 percent)
Heating Oil (50.9 percent) vs Heating Oil previous week (47.4 percent)
Bloomberg Commodity Index (0.3 percent) vs Bloomberg Commodity Index previous week (0.0 percent)
Brent Oil tops the 6-Week Strength Trends
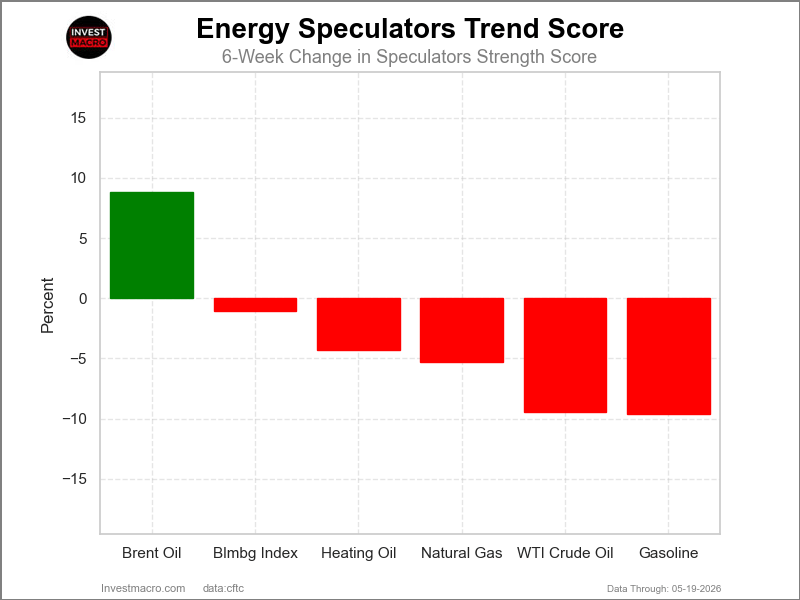
COT Strength Score Trends (or move index, calculates the 6-week changes in strength scores) showed that Brent Oil (8.8 percent) leads the past six weeks trends for the energy markets and was the only positive mover in the latest trends data.
Gasoline (-9.6 percent) and WTI Crude (-9.5 percent) lead the downside trend scores currently with Natural Gas (-5.3 percent) as the next market with lower trend scores.
Move Statistics:
WTI Crude Oil (-9.5 percent) vs WTI Crude Oil previous week (-14.1 percent)
Brent Crude Oil (8.8 percent) vs Brent Crude Oil previous week (25.4 percent)
Natural Gas (-5.3 percent) vs Natural Gas previous week (-5.7 percent)
Gasoline (-9.6 percent) vs Gasoline previous week (-15.2 percent)
Heating Oil (-4.3 percent) vs Heating Oil previous week (-9.3 percent)
Bloomberg Commodity Index (-1.1 percent) vs Bloomberg Commodity Index previous week (-100.0 percent)
Individual COT Market Charts:
WTI Crude Oil Futures Futures:
 Positioning Notes:
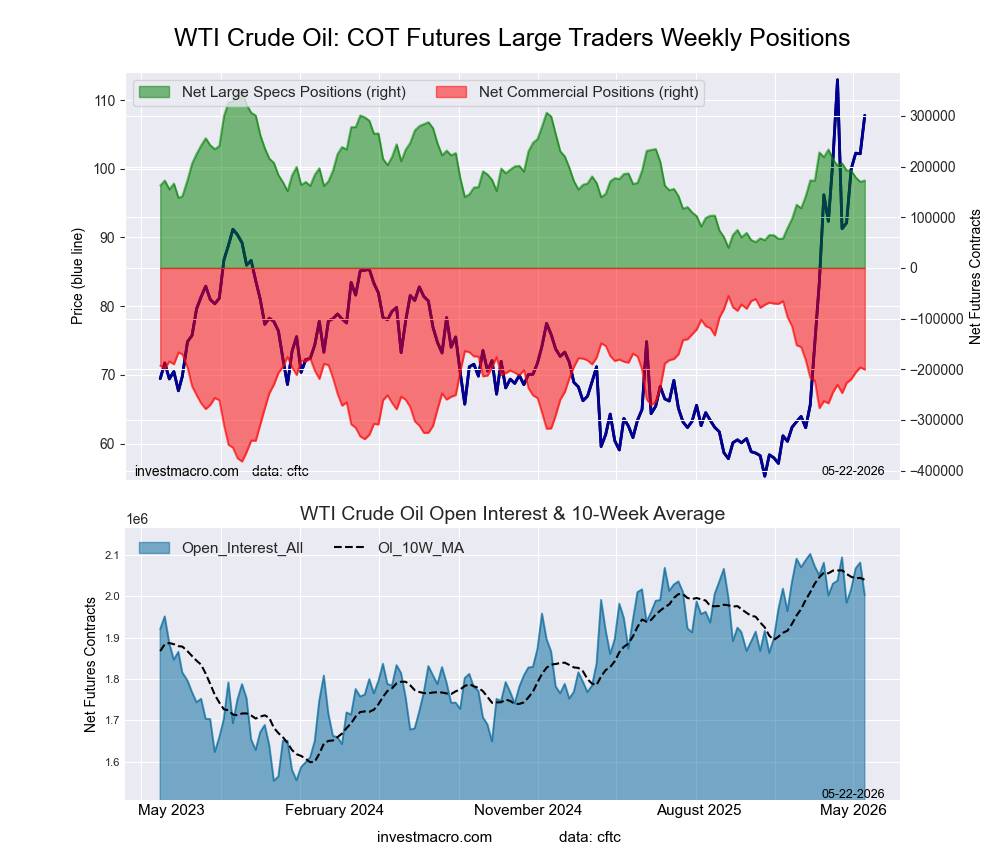
- WTI Crude Oil Futures large speculator standing this week recorded a net position of 172,580 contracts in the data reported through Tuesday.
- Weekly Speculator position lift of 2,703 contracts from the previous week which had a total of 169,877 net contracts.
- This week’s current strength score (range over the past 3 years, measured from 0 to 100) shows the speculators are currently Bearish with a score of 42.8 percent.
- The Commercials are Bullish with a score of 55.5 percent.
- The Small Traders (not shown in chart) are Bullish with a score of 55.9 percent.
Price Trend-Following Model: Uptrend
Our weekly trend-following model classifies the current market price position as: Uptrend.
| WTI Crude Oil Futures Statistics | SPECULATORS | COMMERCIALS | SMALL TRADERS |
| – Percent of Open Interest Longs: | 19.2 | 45.0 | 3.9 |
| – Percent of Open Interest Shorts: | 10.6 | 55.0 | 2.5 |
| – Net Position: | 172,580 | -200,409 | 27,829 |
| – Gross Longs: | 384,294 | 900,625 | 78,845 |
| – Gross Shorts: | 211,714 | 1,101,034 | 51,016 |
| – Long to Short Ratio: | 1.8 to 1 | 0.8 to 1 | 1.5 to 1 |
| NET POSITION TREND: | |||
| – Strength Index Score (3 Year Range Pct): | 42.8 | 55.5 | 55.9 |
| – Strength Index Reading (3 Year Range): | Bearish | Bullish | Bullish |
| NET POSITION MOVEMENT INDEX: | |||
| – 6-Week Change in Strength Index: | -9.5 | 9.2 | -1.0 |
Brent Crude Oil Futures Futures:
 Positioning Notes:
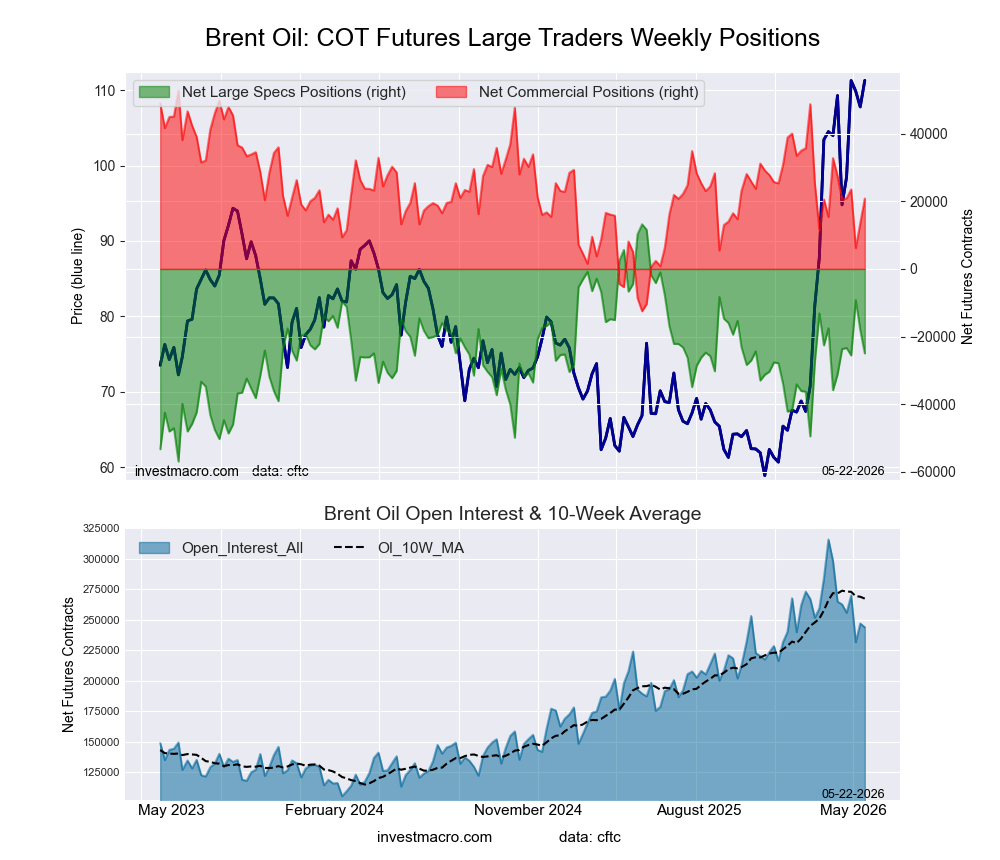
- Brent Crude Oil Futures large speculator standing this week recorded a net position of -24,966 contracts in the data reported through Tuesday.
- Weekly Speculator position decrease of -6,932 contracts from the previous week which had a total of -18,034 net contracts.
- This week’s current strength score (range over the past 3 years, measured from 0 to 100) shows the speculators are currently Bearish with a score of 45.6 percent.
- The Commercials are Bullish with a score of 51.1 percent.
- The Small Traders (not shown in chart) are Bullish-Extreme with a score of 95.7 percent.
Price Trend-Following Model: Uptrend
Our weekly trend-following model classifies the current market price position as: Uptrend.
| Brent Crude Oil Futures Statistics | SPECULATORS | COMMERCIALS | SMALL TRADERS |
| – Percent of Open Interest Longs: | 24.5 | 34.2 | 4.1 |
| – Percent of Open Interest Shorts: | 34.8 | 25.6 | 2.4 |
| – Net Position: | -24,966 | 20,829 | 4,137 |
| – Gross Longs: | 59,813 | 83,284 | 9,907 |
| – Gross Shorts: | 84,779 | 62,455 | 5,770 |
| – Long to Short Ratio: | 0.7 to 1 | 1.3 to 1 | 1.7 to 1 |
| NET POSITION TREND: | |||
| – Strength Index Score (3 Year Range Pct): | 45.6 | 51.1 | 95.7 |
| – Strength Index Reading (3 Year Range): | Bearish | Bullish | Bullish-Extreme |
| NET POSITION MOVEMENT INDEX: | |||
| – 6-Week Change in Strength Index: | 8.8 | -10.1 | 5.7 |
Natural Gas Futures Futures:
 Positioning Notes:
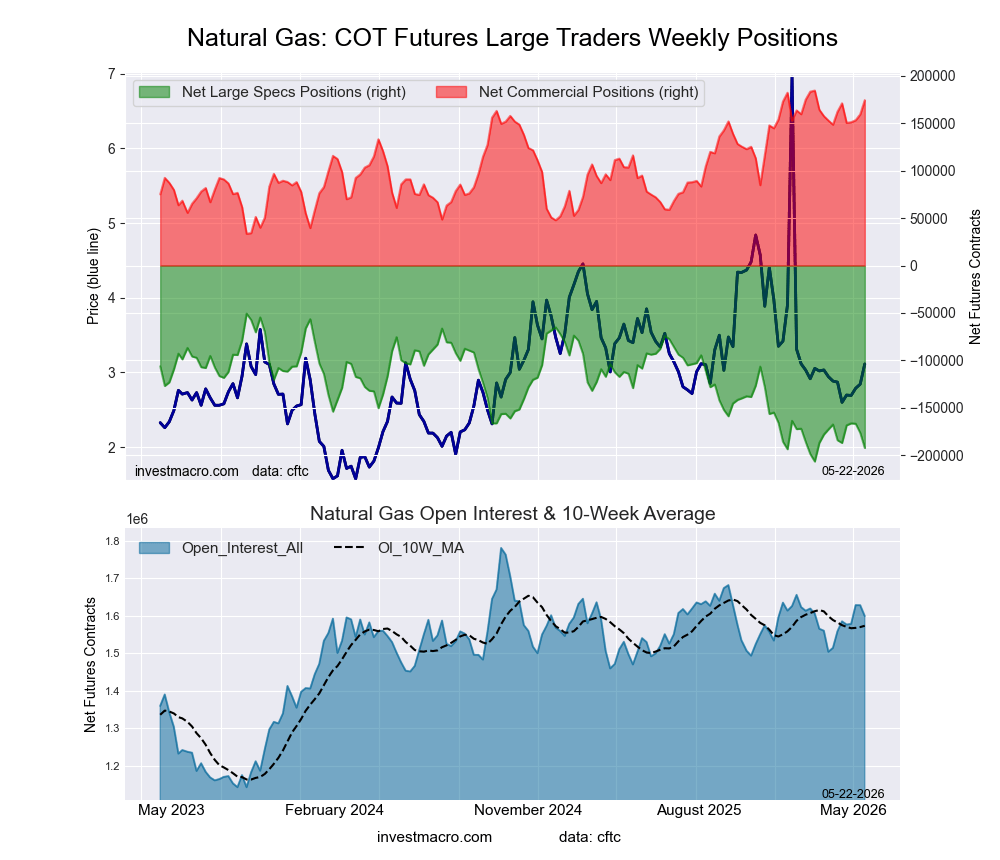
- Natural Gas Futures large speculator standing this week recorded a net position of -192,196 contracts in the data reported through Tuesday.
- Weekly Speculator position decrease of -15,890 contracts from the previous week which had a total of -176,306 net contracts.
- This week’s current strength score (range over the past 3 years, measured from 0 to 100) shows the speculators are currently Bearish-Extreme with a score of 9.1 percent.
- The Commercials are Bullish-Extreme with a score of 93.3 percent.
- The Small Traders (not shown in chart) are Bearish with a score of 48.5 percent.
Price Trend-Following Model: Downtrend
Our weekly trend-following model classifies the current market price position as: Downtrend.
| Natural Gas Futures Statistics | SPECULATORS | COMMERCIALS | SMALL TRADERS |
| – Percent of Open Interest Longs: | 14.4 | 36.2 | 3.7 |
| – Percent of Open Interest Shorts: | 26.4 | 25.3 | 2.6 |
| – Net Position: | -192,196 | 174,224 | 17,972 |
| – Gross Longs: | 230,391 | 578,821 | 59,864 |
| – Gross Shorts: | 422,587 | 404,597 | 41,892 |
| – Long to Short Ratio: | 0.5 to 1 | 1.4 to 1 | 1.4 to 1 |
| NET POSITION TREND: | |||
| – Strength Index Score (3 Year Range Pct): | 9.1 | 93.3 | 48.5 |
| – Strength Index Reading (3 Year Range): | Bearish-Extreme | Bullish-Extreme | Bearish |
| NET POSITION MOVEMENT INDEX: | |||
| – 6-Week Change in Strength Index: | -5.3 | 8.0 | -9.9 |
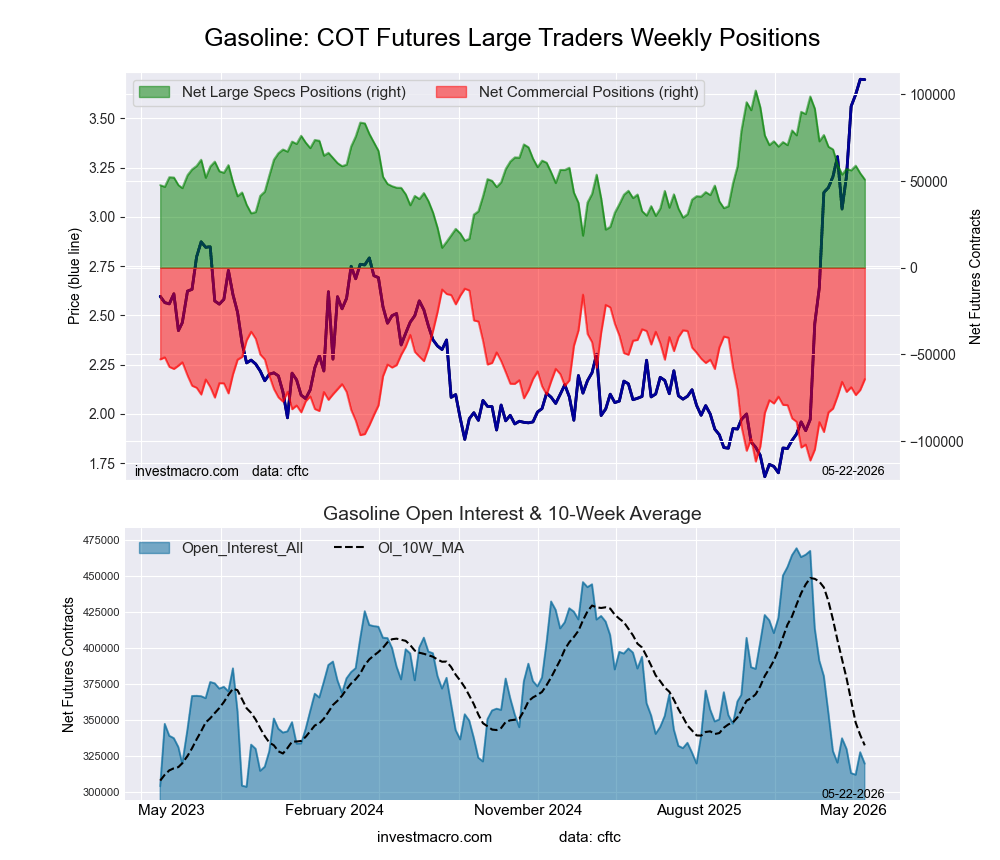
Gasoline Blendstock Futures Futures:
 Positioning Notes:
- Gasoline Blendstock Futures large speculator standing this week recorded a net position of 50,929 contracts in the data reported through Tuesday.
- Weekly Speculator position reduction of -3,596 contracts from the previous week which had a total of 54,525 net contracts.
- This week’s current strength score (range over the past 3 years, measured from 0 to 100) shows the speculators are currently Bearish with a score of 43.4 percent.
- The Commercials are Bearish with a score of 47.6 percent.
- The Small Traders (not shown in chart) are Bullish with a score of 78.2 percent.
Price Trend-Following Model: Uptrend
Our weekly trend-following model classifies the current market price position as: Uptrend.
| Nasdaq Mini Futures Statistics | SPECULATORS | COMMERCIALS | SMALL TRADERS |
| – Percent of Open Interest Longs: | 25.1 | 47.4 | 8.5 |
| – Percent of Open Interest Shorts: | 9.1 | 67.5 | 4.3 |
| – Net Position: | 50,929 | -64,242 | 13,313 |
| – Gross Longs: | 80,150 | 151,612 | 27,203 |
| – Gross Shorts: | 29,221 | 215,854 | 13,890 |
| – Long to Short Ratio: | 2.7 to 1 | 0.7 to 1 | 2.0 to 1 |
| NET POSITION TREND: | |||
| – Strength Index Score (3 Year Range Pct): | 43.4 | 47.6 | 78.2 |
| – Strength Index Reading (3 Year Range): | Bearish | Bearish | Bullish |
| NET POSITION MOVEMENT INDEX: | |||
| – 6-Week Change in Strength Index: | -9.6 | 9.8 | -5.1 |
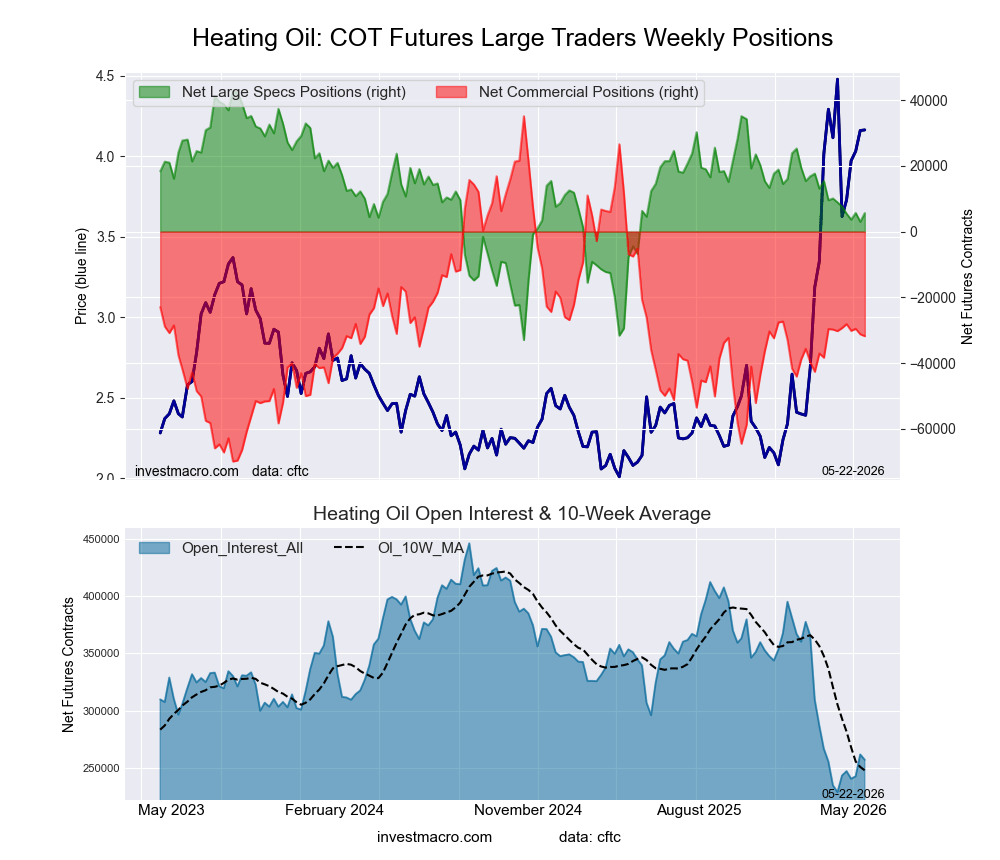
#2 Heating Oil NY-Harbor Futures Futures:
 Positioning Notes:
- #2 Heating Oil NY-Harbor Futures large speculator standing this week recorded a net position of 5,643 contracts in the data reported through Tuesday.
- Weekly Speculator position gain of 2,635 contracts from the previous week which had a total of 3,008 net contracts.
- This week’s current strength score (range over the past 3 years, measured from 0 to 100) shows the speculators are currently Bullish with a score of 50.9 percent.
- The Commercials are Bearish with a score of 36.3 percent.
- The Small Traders (not shown in chart) are Bullish-Extreme with a score of 89.5 percent.
Price Trend-Following Model: Uptrend
Our weekly trend-following model classifies the current market price position as: Uptrend.
| Heating Oil Futures Statistics | SPECULATORS | COMMERCIALS | SMALL TRADERS |
| – Percent of Open Interest Longs: | 16.2 | 46.3 | 19.6 |
| – Percent of Open Interest Shorts: | 14.0 | 58.6 | 9.4 |
| – Net Position: | 5,643 | -31,776 | 26,133 |
| – Gross Longs: | 41,735 | 118,940 | 50,371 |
| – Gross Shorts: | 36,092 | 150,716 | 24,238 |
| – Long to Short Ratio: | 1.2 to 1 | 0.8 to 1 | 2.1 to 1 |
| NET POSITION TREND: | |||
| – Strength Index Score (3 Year Range Pct): | 50.9 | 36.3 | 89.5 |
| – Strength Index Reading (3 Year Range): | Bullish | Bearish | Bullish-Extreme |
| NET POSITION MOVEMENT INDEX: | |||
| – 6-Week Change in Strength Index: | -4.3 | -1.5 | 13.1 |
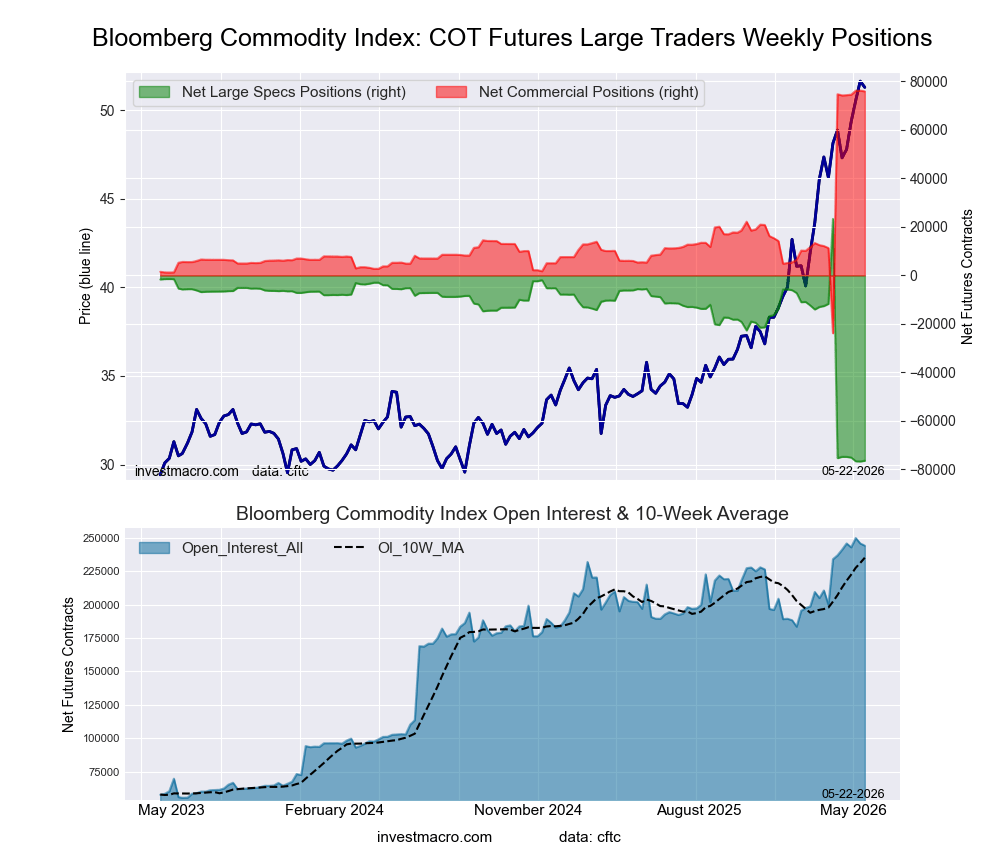
Bloomberg Commodity Index Futures Futures:
 Positioning Notes:
- Bloomberg Commodity Index Futures large speculator standing this week recorded a net position of -76,415 contracts in the data reported through Tuesday.
- Weekly Speculator position boost of 315 contracts from the previous week which had a total of -76,730 net contracts.
- This week’s current strength score (range over the past 3 years, measured from 0 to 100) shows the speculators are currently Bearish-Extreme with a score of 0.3 percent.
- The Commercials are Bullish-Extreme with a score of 99.7 percent.
- The Small Traders (not shown in chart) are Bullish with a score of 66.0 percent.
Price Trend-Following Model: Uptrend
Our weekly trend-following model classifies the current market price position as: Uptrend.
| Bloomberg Index Futures Statistics | SPECULATORS | COMMERCIALS | SMALL TRADERS |
| – Percent of Open Interest Longs: | 43.5 | 55.7 | 0.2 |
| – Percent of Open Interest Shorts: | 74.8 | 24.6 | 0.0 |
| – Net Position: | -76,415 | 75,902 | 513 |
| – Gross Longs: | 106,216 | 135,902 | 538 |
| – Gross Shorts: | 182,631 | 60,000 | 25 |
| – Long to Short Ratio: | 0.6 to 1 | 2.3 to 1 | 21.5 to 1 |
| NET POSITION TREND: | |||
| – Strength Index Score (3 Year Range Pct): | 0.3 | 99.7 | 66.0 |
| – Strength Index Reading (3 Year Range): | Bearish-Extreme | Bullish-Extreme | Bullish |
| NET POSITION MOVEMENT INDEX: | |||
| – 6-Week Change in Strength Index: | -1.1 | 1.2 | -8.6 |
Article By InvestMacro – Receive our weekly COT Reports by Email
*COT Report: The COT data, released weekly to the public each Friday, is updated through the most recent Tuesday (data is 3 days old) and shows a quick view of how large speculators or non-commercials (for-profit traders) were positioned in the futures markets.
The CFTC categorizes trader positions according to commercial hedgers (traders who use futures contracts for hedging as part of the business), non-commercials (large traders who speculate to realize trading profits) and nonreportable traders (usually small traders/speculators) as well as their open interest (contracts open in the market at time of reporting).See CFTC criteria here.
All information and opinions on this website and contained in this article are for general informational purposes only and do not constitute investment advice.

- The Tech‑heavy NASDAQ Index jumped by more than 3.3%. The offshore yuan is trading at its highest level since 2023 Jul 31, 2026
- USD/JPY After Volatility: Multiple Events in One Day Jul 31, 2026
- The US indices sell off amid renewed US-Iran clashes. Oil jumps by 7% Jul 30, 2026
- USD/JPY Temporary in Equilibrium: Multiple Factors in Focus Jul 30, 2026
- GBP/USD at Month’s Lows: The Outlook Remains Weak Jul 29, 2026
- Crude oil falls below $80 per barrel. Australia sees inflation slowdown Jul 29, 2026
- The US Tech sector hit by sell‑off. Oil prices decline on renewed negotiations Jul 28, 2026
- Gold Declines, Focus on Fed and Falling Oil Prices Jul 28, 2026
- This week will be one of the most crowded for central‑bank meetings Jul 27, 2026
- EUR/USD Ahead of a Key Week: Holding Near Lows Jul 27, 2026