
By InvestMacro
Here are the latest charts and statistics for the Commitment of Traders (COT) data published by the Commodities Futures Trading Commission (CFTC).
The latest COT data is updated through Tuesday February 3rd and shows a quick view of how large traders (for-profit speculators and commercial entities) were positioned in the futures markets.
Weekly Speculator Changes led by WTI Crude & Brent Oil
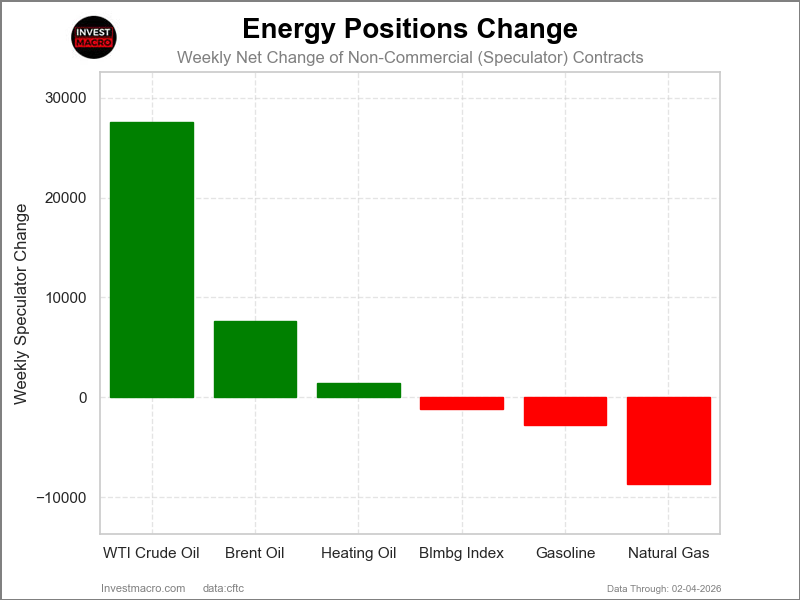
The COT energy market speculator bets were mixed this week as three out of the six energy markets we cover had higher positioning while the other three markets had lower speculator contracts.
Leading the gains for the energy markets was WTI Crude (27,583 contracts) with Brent Oil (7,638 contracts) and Heating Oil (1,444 contracts) also having a positive week.
The markets with declines in speculator bets for the week were Natural Gas (-8,704 contracts), Gasoline (-2,782 contracts) and with the Bloomberg Index (-1,171 contracts) also seeing lower bets on the week.
Free Reports:
 Get our Weekly Commitment of Traders Reports - See where the biggest traders (Hedge Funds and Commercial Hedgers) are positioned in the futures markets on a weekly basis.
 Download Our Metatrader 4 Indicators – Put Our Free MetaTrader 4 Custom Indicators on your charts when you join our Weekly Newsletter
The Energy Markets Prices were mostly lower on the week.
Gasoline was the only energy market that rose over the past five days with a small 0.09% uptick.
On the downside, Brent Oil fell by -2.82%, followed by WTI Crude Oil which fell by -3.18% and the Bloomberg Commodity Index which dipped by -3.28%. Heating oil saw a shortfall of -5.05% while Natural Gas saw a sharpest decline at -21.48%.
Over the past 30 days, all the energy markets have seen higher levels with Heating Oil up by 12.8% followed by Brent Oil which is higher by 11.2% in that time-frame. Also, over the past 90 days, all the energy markets have seen higher levels with the Bloomberg Commodity Index showing the largest gain of 15.69%.
Energy Data:
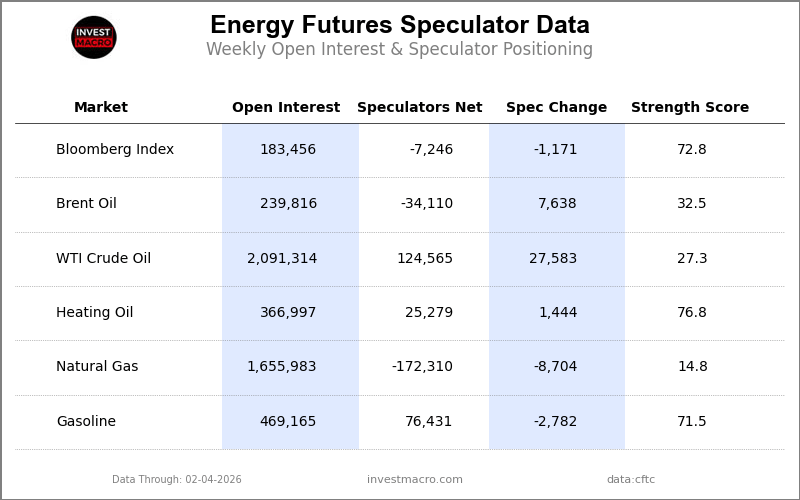
Legend: Weekly Speculators Change | Speculators Current Net Position | Speculators Strength Score compared to last 3-Years (0-100 range)
Strength Scores led by Heating Oil & Bloomberg Index
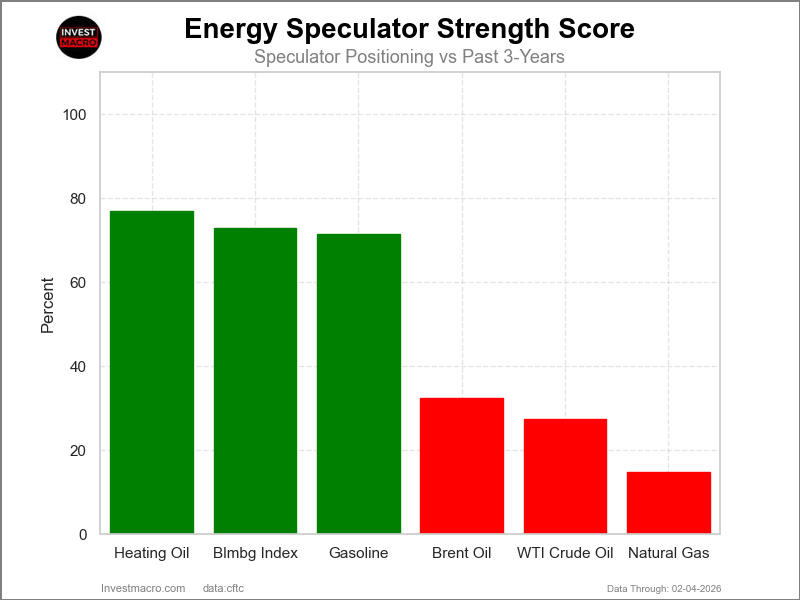
COT Strength Scores (a normalized measure of Speculator positions over a 3-Year range, from 0 to 100 where above 80 is Extreme-Bullish and below 20 is Extreme-Bearish) showed that Heating Oil (76.8 percent) and the Bloomberg Index (72.8 percent) lead the energy markets this week.
On the downside, Natural Gas (14.8 percent) comes in at the lowest strength level currently and is in Extreme-Bearish territory (below 20 percent). The next lowest strength score was the WTI Crude (27.3 percent).
Strength Statistics:
WTI Crude Oil (27.3 percent) vs WTI Crude Oil previous week (18.4 percent)
Brent Crude Oil (32.5 percent) vs Brent Crude Oil previous week (21.6 percent)
Natural Gas (14.8 percent) vs Natural Gas previous week (20.9 percent)
Gasoline (71.5 percent) vs Gasoline previous week (74.6 percent)
Heating Oil (76.8 percent) vs Heating Oil previous week (74.9 percent)
Bloomberg Commodity Index (72.8 percent) vs Bloomberg Commodity Index previous week (78.3 percent)
Bloomberg Index & WTI Crude top the 6-Week Strength Trends
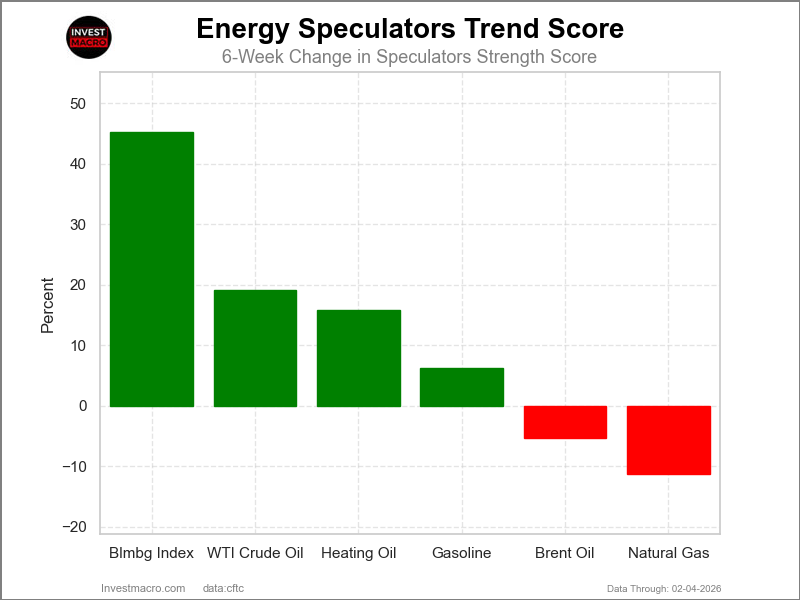
COT Strength Score Trends (or move index, calculates the 6-week changes in strength scores) showed that the Bloomberg Index (45.2 percent) and WTI Crude (19.2 percent) lead the past six weeks trends for the energy markets.
Natural Gas (-11.2 percent) leads the downside trend scores currently with Brent Oil (-5.4 percent) as the next market with lower trend scores.
Move Statistics:
WTI Crude Oil (19.2 percent) vs WTI Crude Oil previous week (13.6 percent)
Brent Crude Oil (-5.4 percent) vs Brent Crude Oil previous week (-14.9 percent)
Natural Gas (-11.2 percent) vs Natural Gas previous week (-24.9 percent)
Gasoline (6.2 percent) vs Gasoline previous week (3.1 percent)
Heating Oil (15.8 percent) vs Heating Oil previous week (11.2 percent)
Bloomberg Commodity Index (45.2 percent) vs Bloomberg Commodity Index previous week (72.1 percent)
Individual COT Market Charts:
WTI Crude Oil Futures:
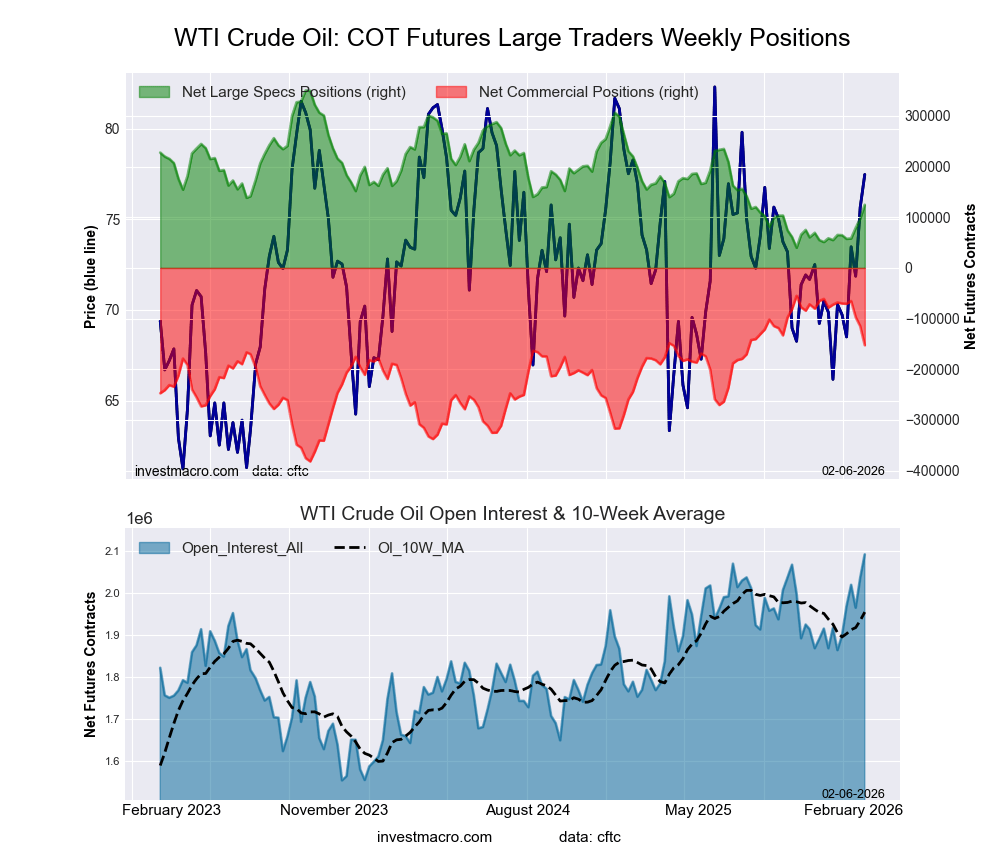 The WTI Crude Oil Futures large speculator standing this week resulted in a net position of 124,565 contracts in the data reported through Tuesday. This was a weekly increase of 27,583 contracts from the previous week which had a total of 96,982 net contracts.
This week’s current strength score (the trader positioning range over the past three years, measured from 0 to 100) shows the speculators are currently Bearish with a score of 27.3 percent. The commercials are Bullish with a score of 70.2 percent and the small traders (not shown in chart) are Bullish with a score of 58.7 percent.
Price Trend-Following Model: Strong Uptrend
Our weekly trend-following model classifies the current market price position as: Strong Uptrend.
| WTI Crude Oil Futures Statistics | SPECULATORS | COMMERCIALS | SMALL TRADERS |
| – Percent of Open Interest Longs: | 15.1 | 42.1 | 3.4 |
| – Percent of Open Interest Shorts: | 9.1 | 49.4 | 2.0 |
| – Net Position: | 124,565 | -152,499 | 27,934 |
| – Gross Longs: | 315,529 | 879,932 | 70,726 |
| – Gross Shorts: | 190,964 | 1,032,431 | 42,792 |
| – Long to Short Ratio: | 1.7 to 1 | 0.9 to 1 | 1.7 to 1 |
| NET POSITION TREND: | |||
| – Strength Index Score (3 Year Range Pct): | 27.3 | 70.2 | 58.7 |
| – Strength Index Reading (3 Year Range): | Bearish | Bullish | Bullish |
| NET POSITION MOVEMENT INDEX: | |||
| – 6-Week Change in Strength Index: | 19.2 | -25.8 | 50.9 |
Brent Crude Oil Futures:
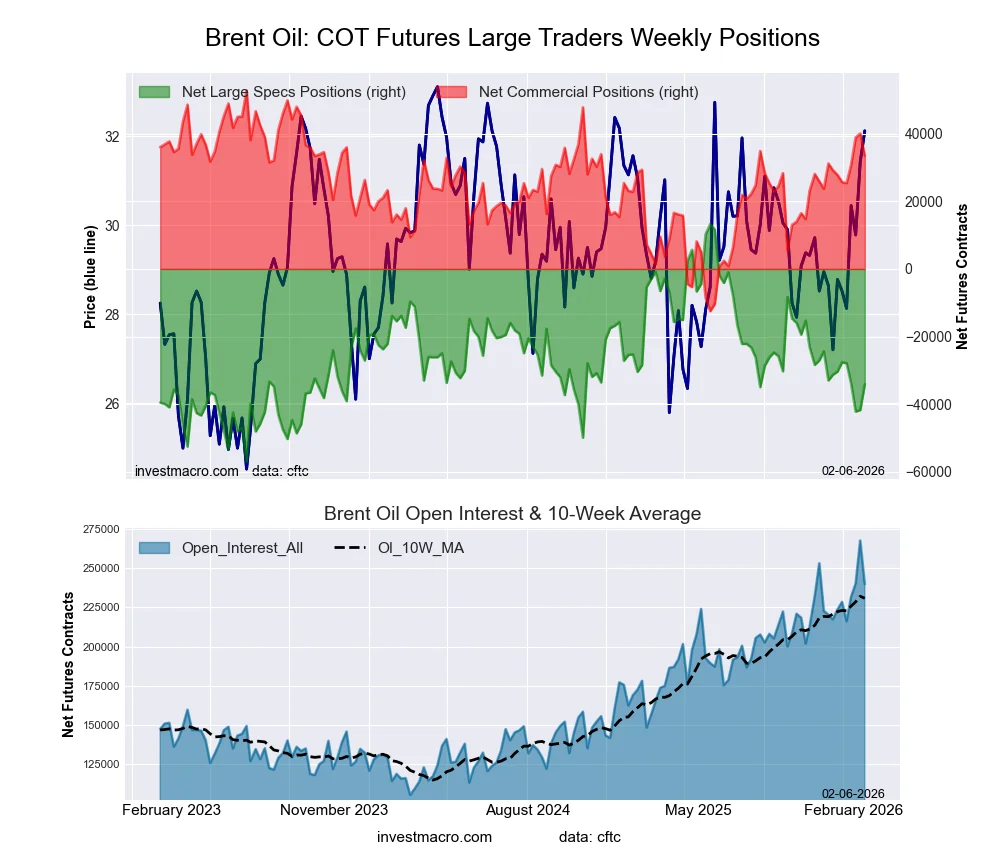 The Brent Crude Oil Futures large speculator standing this week resulted in a net position of -34,110 contracts in the data reported through Tuesday. This was a weekly boost of 7,638 contracts from the previous week which had a total of -41,748 net contracts.
This week’s current strength score (the trader positioning range over the past three years, measured from 0 to 100) shows the speculators are currently Bearish with a score of 32.5 percent. The commercials are Bullish with a score of 70.4 percent and the small traders (not shown in chart) are Bearish with a score of 42.8 percent.
Price Trend-Following Model: Strong Uptrend
Our weekly trend-following model classifies the current market price position as: Strong Uptrend.
| Brent Crude Oil Futures Statistics | SPECULATORS | COMMERCIALS | SMALL TRADERS |
| – Percent of Open Interest Longs: | 24.1 | 37.7 | 2.3 |
| – Percent of Open Interest Shorts: | 38.3 | 23.8 | 2.0 |
| – Net Position: | -34,110 | 33,458 | 652 |
| – Gross Longs: | 57,804 | 90,456 | 5,467 |
| – Gross Shorts: | 91,914 | 56,998 | 4,815 |
| – Long to Short Ratio: | 0.6 to 1 | 1.6 to 1 | 1.1 to 1 |
| NET POSITION TREND: | |||
| – Strength Index Score (3 Year Range Pct): | 32.5 | 70.4 | 42.8 |
| – Strength Index Reading (3 Year Range): | Bearish | Bullish | Bearish |
| NET POSITION MOVEMENT INDEX: | |||
| – 6-Week Change in Strength Index: | -5.4 | 8.7 | -22.1 |
Natural Gas Futures:
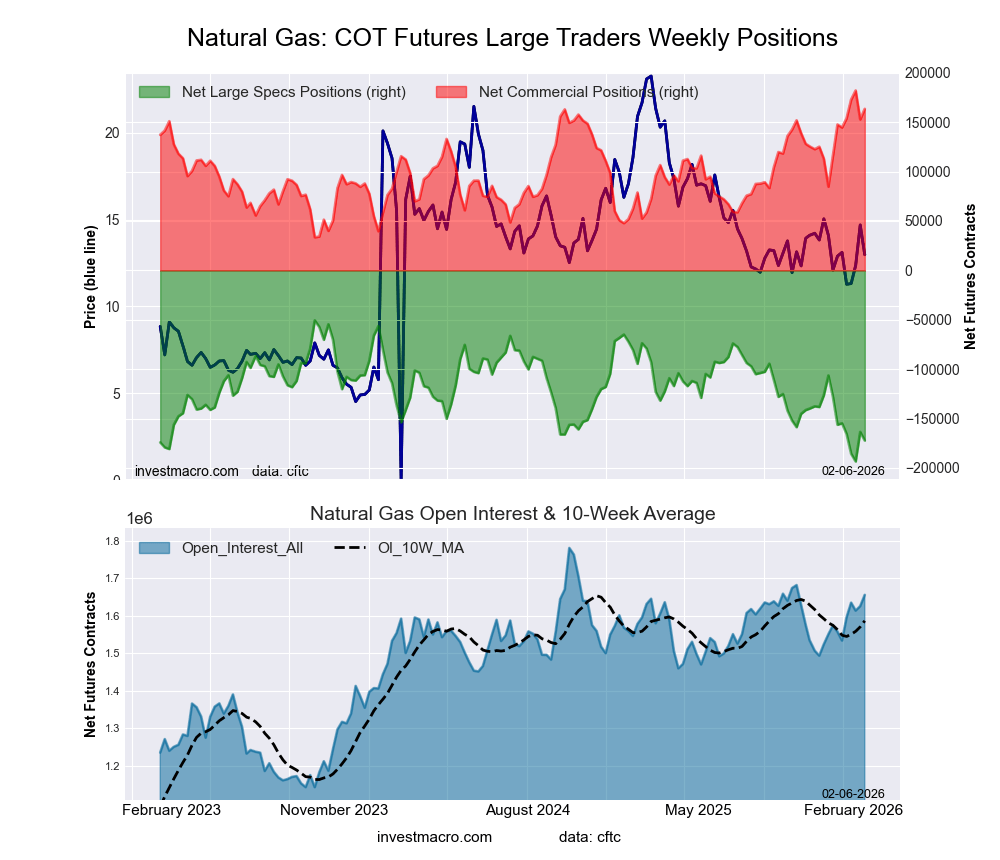 The Natural Gas Futures large speculator standing this week resulted in a net position of -172,310 contracts in the data reported through Tuesday. This was a weekly lowering of -8,704 contracts from the previous week which had a total of -163,606 net contracts.
This week’s current strength score (the trader positioning range over the past three years, measured from 0 to 100) shows the speculators are currently Bearish-Extreme with a score of 14.8 percent. The commercials are Bullish-Extreme with a score of 87.5 percent and the small traders (not shown in chart) are Bearish with a score of 25.5 percent.
Price Trend-Following Model: Uptrend
Our weekly trend-following model classifies the current market price position as: Uptrend.
| Natural Gas Futures Statistics | SPECULATORS | COMMERCIALS | SMALL TRADERS |
| – Percent of Open Interest Longs: | 13.0 | 37.5 | 2.9 |
| – Percent of Open Interest Shorts: | 23.4 | 27.6 | 2.4 |
| – Net Position: | -172,310 | 163,456 | 8,854 |
| – Gross Longs: | 215,099 | 620,513 | 48,080 |
| – Gross Shorts: | 387,409 | 457,057 | 39,226 |
| – Long to Short Ratio: | 0.6 to 1 | 1.4 to 1 | 1.2 to 1 |
| NET POSITION TREND: | |||
| – Strength Index Score (3 Year Range Pct): | 14.8 | 87.5 | 25.5 |
| – Strength Index Reading (3 Year Range): | Bearish-Extreme | Bullish-Extreme | Bearish |
| NET POSITION MOVEMENT INDEX: | |||
| – 6-Week Change in Strength Index: | -11.2 | 10.7 | 0.3 |
Gasoline Blendstock Futures:
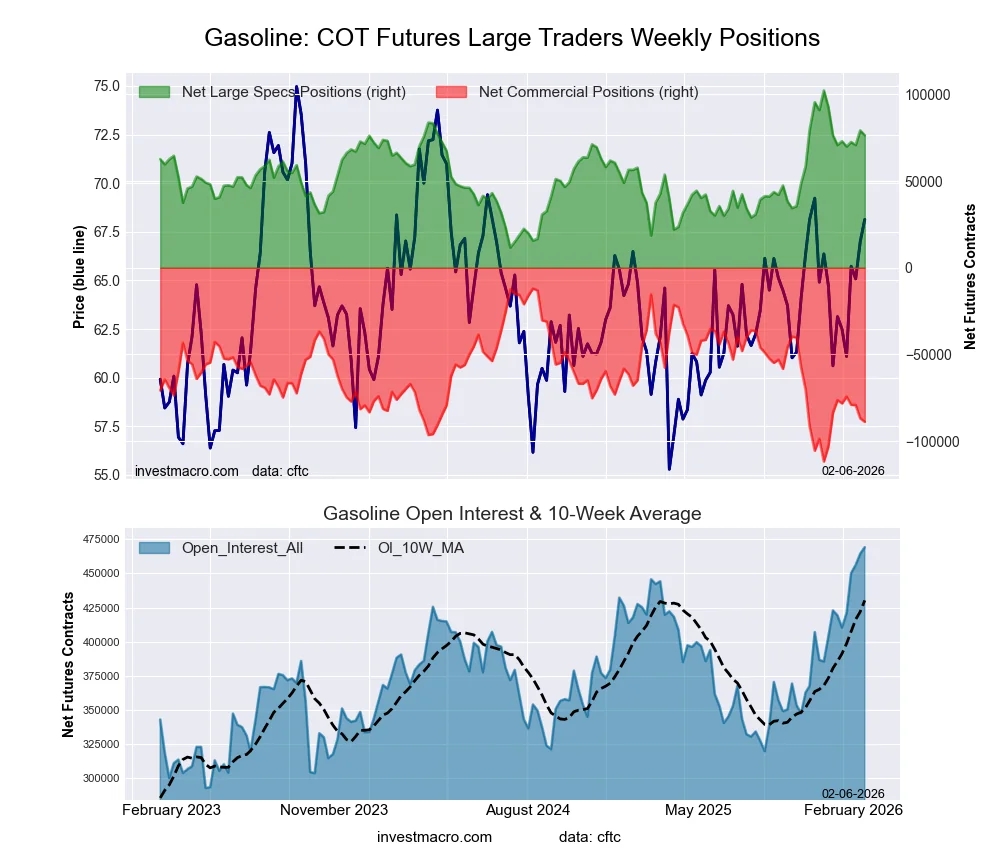 The Gasoline Blendstock Futures large speculator standing this week resulted in a net position of 76,431 contracts in the data reported through Tuesday. This was a weekly decline of -2,782 contracts from the previous week which had a total of 79,213 net contracts.
This week’s current strength score (the trader positioning range over the past three years, measured from 0 to 100) shows the speculators are currently Bullish with a score of 71.5 percent. The commercials are Bearish with a score of 23.0 percent and the small traders (not shown in chart) are Bullish-Extreme with a score of 93.2 percent.
Price Trend-Following Model: Strong Uptrend
Our weekly trend-following model classifies the current market price position as: Strong Uptrend.
| Nasdaq Mini Futures Statistics | SPECULATORS | COMMERCIALS | SMALL TRADERS |
| – Percent of Open Interest Longs: | 24.8 | 46.2 | 5.9 |
| – Percent of Open Interest Shorts: | 8.5 | 65.1 | 3.2 |
| – Net Position: | 76,431 | -88,857 | 12,426 |
| – Gross Longs: | 116,257 | 216,553 | 27,515 |
| – Gross Shorts: | 39,826 | 305,410 | 15,089 |
| – Long to Short Ratio: | 2.9 to 1 | 0.7 to 1 | 1.8 to 1 |
| NET POSITION TREND: | |||
| – Strength Index Score (3 Year Range Pct): | 71.5 | 23.0 | 93.2 |
| – Strength Index Reading (3 Year Range): | Bullish | Bearish | Bullish-Extreme |
| NET POSITION MOVEMENT INDEX: | |||
| – 6-Week Change in Strength Index: | 6.2 | -12.5 | 39.4 |
#2 Heating Oil NY-Harbor Futures:
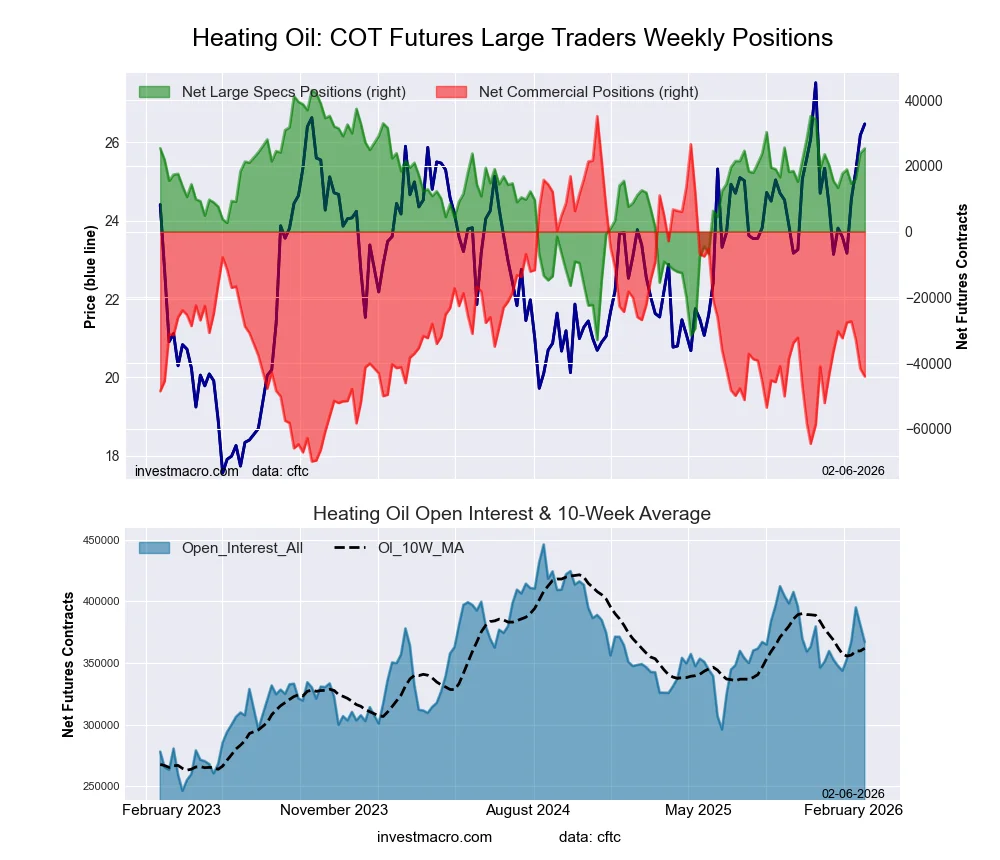 The #2 Heating Oil NY-Harbor Futures large speculator standing this week resulted in a net position of 25,279 contracts in the data reported through Tuesday. This was a weekly boost of 1,444 contracts from the previous week which had a total of 23,835 net contracts.
This week’s current strength score (the trader positioning range over the past three years, measured from 0 to 100) shows the speculators are currently Bullish with a score of 76.8 percent. The commercials are Bearish with a score of 24.6 percent and the small traders (not shown in chart) are Bullish with a score of 69.4 percent.
Price Trend-Following Model: Strong Uptrend
Our weekly trend-following model classifies the current market price position as: Strong Uptrend.
| Heating Oil Futures Statistics | SPECULATORS | COMMERCIALS | SMALL TRADERS |
| – Percent of Open Interest Longs: | 17.1 | 46.5 | 12.9 |
| – Percent of Open Interest Shorts: | 10.2 | 58.6 | 7.8 |
| – Net Position: | 25,279 | -44,051 | 18,772 |
| – Gross Longs: | 62,759 | 170,829 | 47,433 |
| – Gross Shorts: | 37,480 | 214,880 | 28,661 |
| – Long to Short Ratio: | 1.7 to 1 | 0.8 to 1 | 1.7 to 1 |
| NET POSITION TREND: | |||
| – Strength Index Score (3 Year Range Pct): | 76.8 | 24.6 | 69.4 |
| – Strength Index Reading (3 Year Range): | Bullish | Bearish | Bullish |
| NET POSITION MOVEMENT INDEX: | |||
| – 6-Week Change in Strength Index: | 15.8 | -13.1 | 4.9 |
Bloomberg Commodity Index Futures:
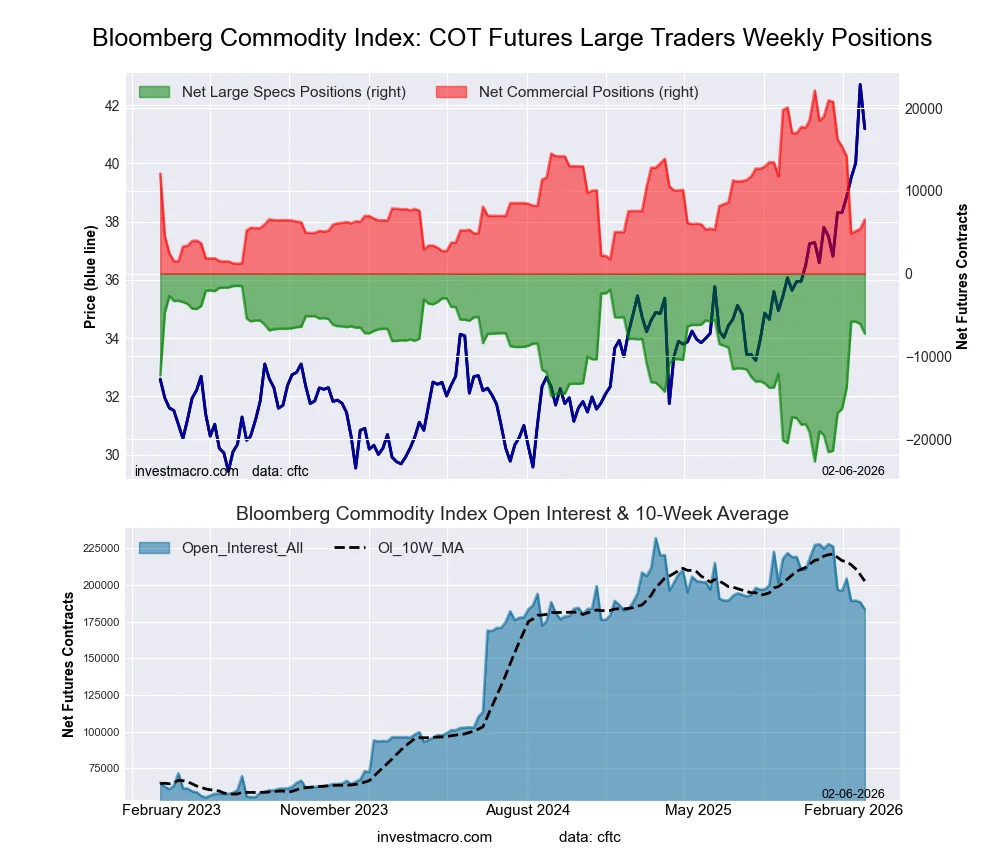 The Bloomberg Commodity Index Futures large speculator standing this week resulted in a net position of -7,246 contracts in the data reported through Tuesday. This was a weekly reduction of -1,171 contracts from the previous week which had a total of -6,075 net contracts.
This week’s current strength score (the trader positioning range over the past three years, measured from 0 to 100) shows the speculators are currently Bullish with a score of 72.8 percent. The commercials are Bearish with a score of 25.5 percent and the small traders (not shown in chart) are Bullish with a score of 50.7 percent.
Price Trend-Following Model: Strong Uptrend
Our weekly trend-following model classifies the current market price position as: Strong Uptrend.
| Bloomberg Index Futures Statistics | SPECULATORS | COMMERCIALS | SMALL TRADERS |
| – Percent of Open Interest Longs: | 24.4 | 72.6 | 0.4 |
| – Percent of Open Interest Shorts: | 28.3 | 69.1 | 0.0 |
| – Net Position: | -7,246 | 6,537 | 709 |
| – Gross Longs: | 44,675 | 133,218 | 732 |
| – Gross Shorts: | 51,921 | 126,681 | 23 |
| – Long to Short Ratio: | 0.9 to 1 | 1.1 to 1 | 31.8 to 1 |
| NET POSITION TREND: | |||
| – Strength Index Score (3 Year Range Pct): | 72.8 | 25.5 | 50.7 |
| – Strength Index Reading (3 Year Range): | Bullish | Bearish | Bullish |
| NET POSITION MOVEMENT INDEX: | |||
| – 6-Week Change in Strength Index: | 45.2 | -46.3 | 4.5 |
Article By InvestMacro – Receive our weekly COT Newsletter
*COT Report: The COT data, released weekly to the public each Friday, is updated through the most recent Tuesday (data is 3 days old) and shows a quick view of how large speculators or non-commercials (for-profit traders) were positioned in the futures markets.
The CFTC categorizes trader positions according to commercial hedgers (traders who use futures contracts for hedging as part of the business), non-commercials (large traders who speculate to realize trading profits) and nonreportable traders (usually small traders/speculators) as well as their open interest (contracts open in the market at time of reporting). See CFTC criteria here.

- RoboForex Brings Full-Scale Trading to Telegram Jul 7, 2026
- Your Bourse Integrates TradingView Charts and Trading Platform Library with Trade Server Jul 7, 2026
- Yen Still Under Pressure: Markets Await Action from Authorities Jul 7, 2026
- Germany’s DAX Index has updated its all‑time high. OPEC+ countries have agreed to increase production Jul 7, 2026
- Oil prices have stabilized. The Canadian dollar continues to trade near yearly lows. Jul 6, 2026
- EUR/USD in a Narrow Range: Focus on Fed Minutes Jul 6, 2026
- Oil prices have fallen to pre‑war levels. AI companies continue to sell off Jul 3, 2026
- Gold Rises Sharply as Markets Reassess Fed Rate Outlook Jul 3, 2026
- The Eurozone has shown a significant slowdown in inflation. Australia has recorded its largest trade deficit since 2015 Jul 2, 2026
- Natural gas prices are rising amid increasing electricity consumption Jul 1, 2026