
By RoboForex Analytical Department
The USD/JPY pair climbed to 148.31 on Monday, extending its gains from the previous week as the US dollar strengthened across the board. The yen faced additional pressure from heightened anticipation around upcoming comments from Federal Reserve officials and the release of critical US inflation data.
Last week, the Federal Reserve delivered a widely expected 25-basis-point cut – its first since December. The central bank’s projections indicated two further reductions before the end of the year.
This contrasts sharply with the Bank of Japan’s (BoJ) stance. Last Friday, the BoJ held its key rate at 0.5% per annum for a fifth consecutive meeting, a decision that was squarely in line with market forecasts. In its accompanying statement, the central bank described a moderate economic recovery but pointed to persistent weak spots and warned of risks stemming from global trade policy.
In a more significant step, the regulator unanimously approved plans to begin selling ETFs and J-REITs from its vast portfolio. This detail is particularly noteworthy and can be interpreted as a cautious signal that the bank is preparing to wind down its long-standing asset purchase program.
This week, investor focus will shift to the latest PMI data and inflation figures for Tokyo, alongside the release of the minutes from the BoJ’s July meeting. These documents may provide crucial insights into the timing and nature of the regulator’s next policy steps.
Free Reports:
 Get our Weekly Commitment of Traders Reports - See where the biggest traders (Hedge Funds and Commercial Hedgers) are positioned in the futures markets on a weekly basis.
 Download Our Metatrader 4 Indicators – Put Our Free MetaTrader 4 Custom Indicators on your charts when you join our Weekly Newsletter
Technical Analysis: USD/JPY
H4 Chart:
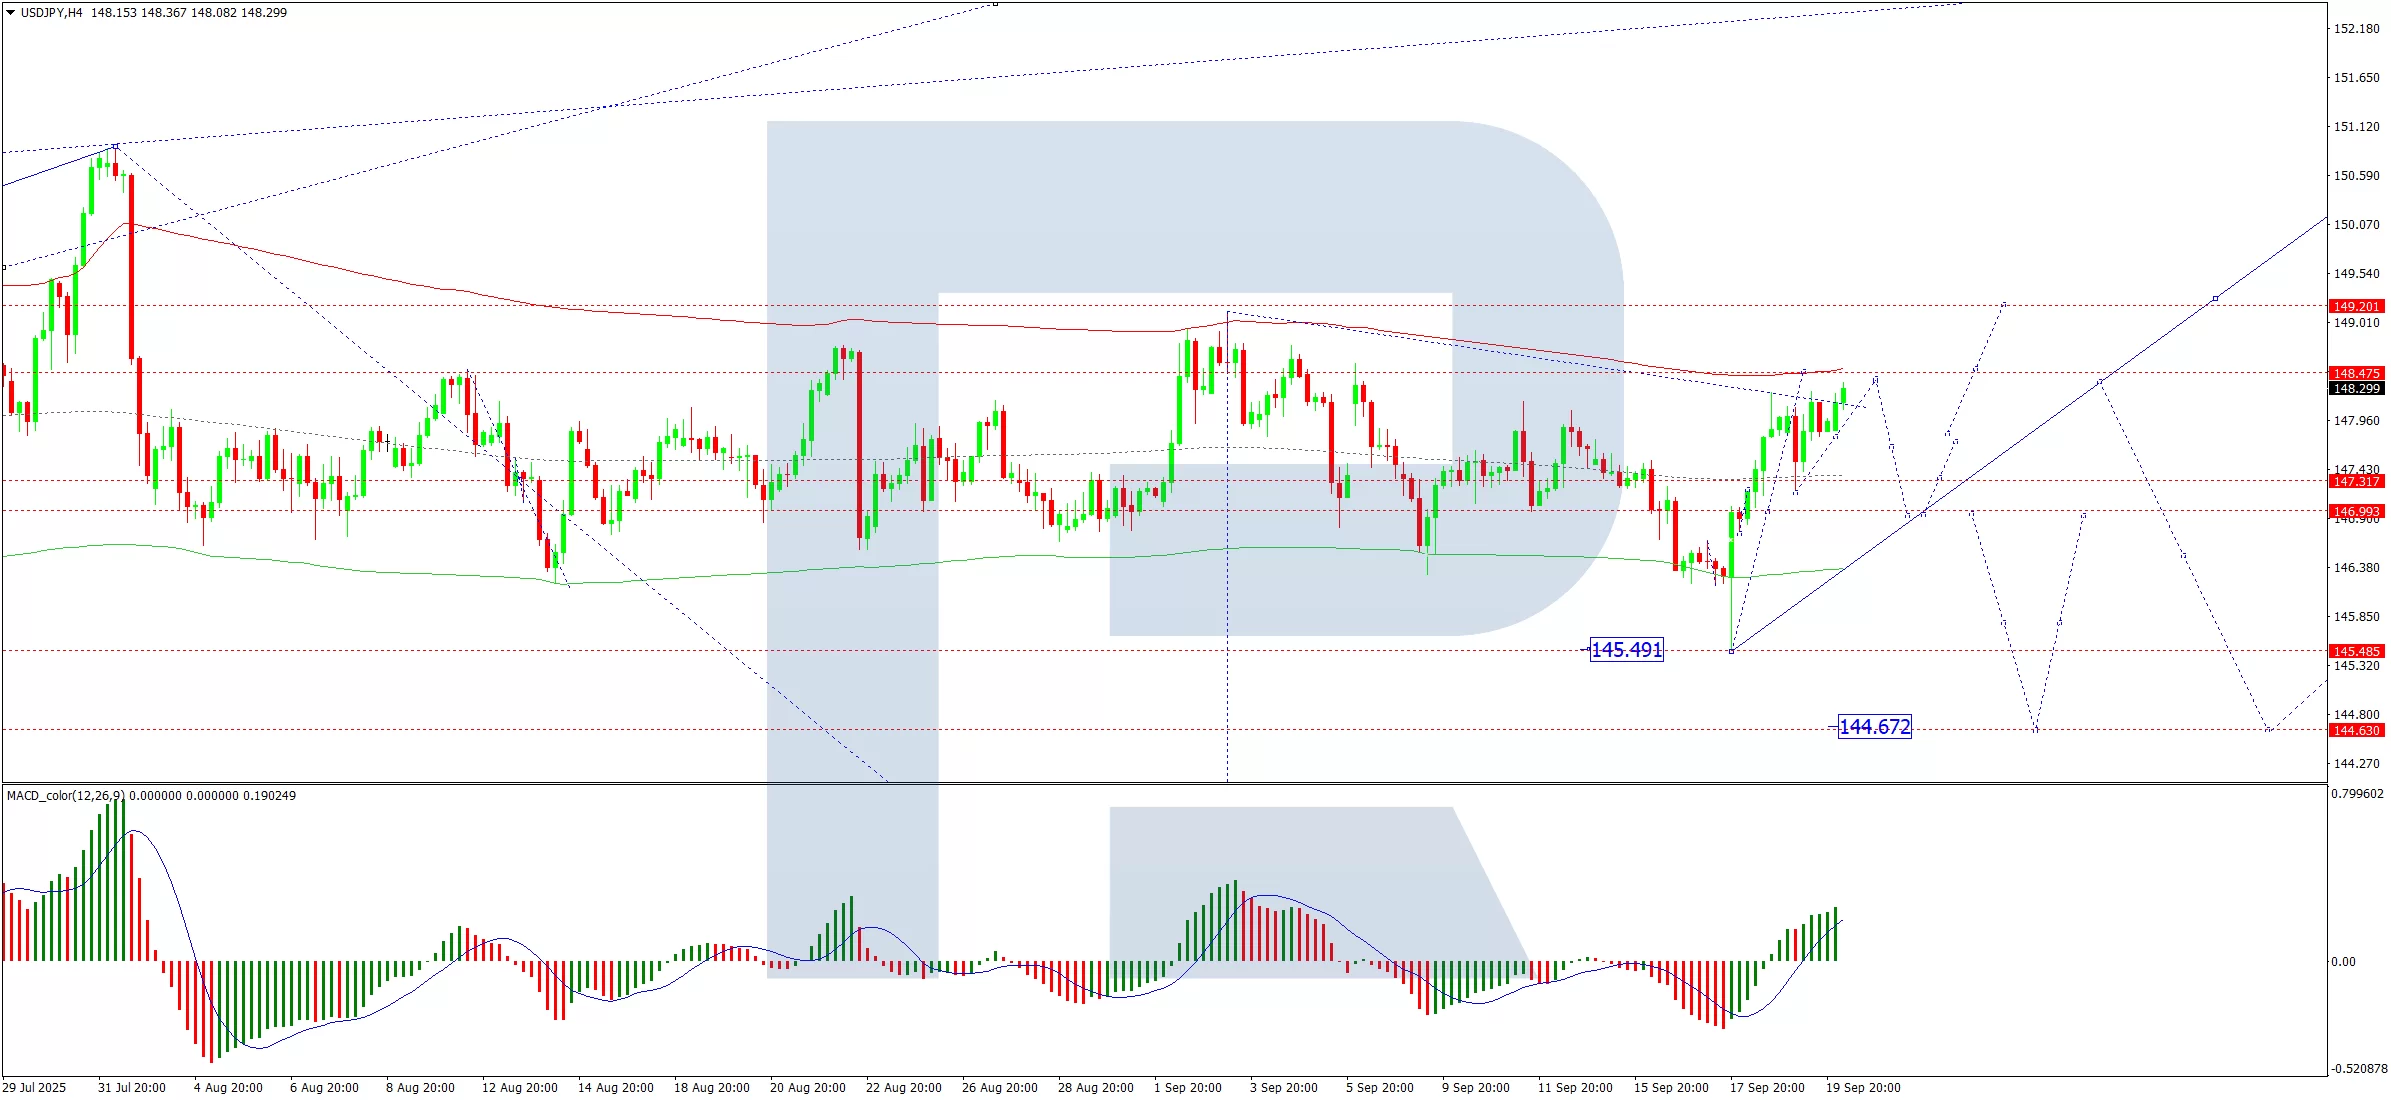
On the H4 chart, USD/JPY found solid support at the 147.20 level and is now developing a fresh upward move targeting 148.88. We expect this target to be tested today. Following this, a corrective pullback towards 147.20 is likely. Following this correction, we anticipate another upward move aiming for the 150.00 psychological level. This outlook is technically confirmed by the MACD indicator, whose signal line is positioned above zero and pointing sharply upwards.
H1 Chart:

The H1 chart shows the pair completed an upward move to 148.23, followed by a correction to 147.20. The current momentum is building for a further advance towards 148.88. Upon reaching this level, a corrective pullback towards 147.20 is possible. The broader upward trajectory is then expected to resume, with a minimum target of 150.00. This scenario is supported by the Stochastic oscillator, with its signal line currently above 50 and rising firmly towards the 80 level.
Conclusion
The yen remains under significant pressure, caught between a resilient US dollar and the Bank of Japan’s cautious, gradual approach to policy normalisation. The path of least resistance for USD/JPY remains higher, contingent on this week’s key data releases reinforcing the current fundamental and technical picture.
Disclaimer:
Any forecasts contained herein are based on the author’s particular opinion. This analysis may not be treated as trading advice. RoboForex bears no responsibility for trading results based on trading recommendations and reviews contained herein.

- GBPUSD Awaits Bank of England Meeting Near April Lows Jun 18, 2026
- Markets disliked the results of the FOMC meeting. HKMA followed the Fed and kept its rate unchanged. Jun 18, 2026
- Gold Surges 2% Since Week Opening Amid Geopolitical Shifts and Fed Expectations Jun 17, 2026
- Your Bourse and FXPRIMUS Bring 24/7 Synthetic Indices to the Global Broker Market Jun 16, 2026
- Institutional investors continue to reduce their presence in metals Jun 16, 2026
- USDJPY Driven by Emotions: Bank of Japan Raises Rate to Highest Level Since 1995 Jun 16, 2026
- The United States and Iran have signed a peace agreement – oil has fallen to 80 dollars per barrel. Jun 15, 2026
- EURUSD Ahead of the New Week: Expecting High Volatility Jun 15, 2026
- COT Metals Charts: Speculator Bets led by Steel Jun 14, 2026
- COT Bonds Charts: Speculator Bets led by 2-Year Bonds & Ultra 10-Year Bonds Jun 14, 2026