
By RoboForex Analytical Department
The AUD/USD pair has fallen rapidly in the final week, reaching 0.6592. This decline is primarily driven by the US dollar’s robust performance, following stronger-than-expected US economic data. Investors now speculate that the Federal Reserve may postpone any interest rate cuts.
The minutes from the Fed’s recent meeting have revealed concerns among policymakers about the possibility of high and persistent inflation. This has led some monetary committee members to express a readiness to tighten policy further if inflation continues to rise.
Similarly, the minutes from the Reserve Bank of Australia’s (RBA) recent meeting revealed doubts among local policymakers. Although the RBA considered raising interest rates in May, it ultimately decided to maintain the current policy stance. Meanwhile, domestic statistics showed that inflation expectations in Australia fell to 4.1% in May, the lowest level since October 2021.
Technical Analysis of AUD/USD
Free Reports:
 Download Our Metatrader 4 Indicators – Put Our Free MetaTrader 4 Custom Indicators on your charts when you join our Weekly Newsletter
 Get our Weekly Commitment of Traders Reports - See where the biggest traders (Hedge Funds and Commercial Hedgers) are positioned in the futures markets on a weekly basis.
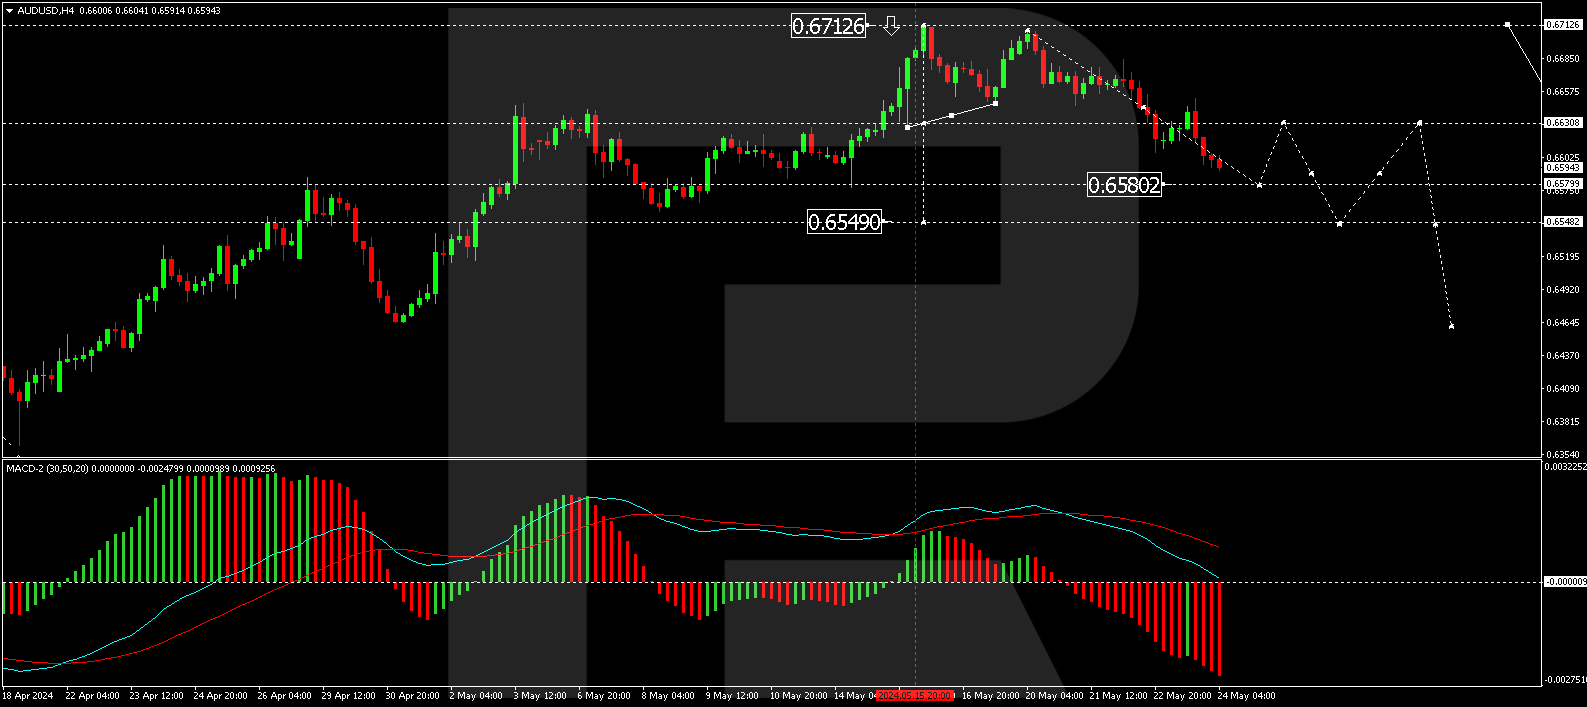
On the H4 chart of AUD/USD, a decline to 0.6663 was followed by a correction to 0.6780. Subsequently, a new wave of decline to 0.6580 has formed, serving as the local target. Upon reaching this target, a correction to 0.6630 (testing from below) is possible, followed by another decline to 0.6548. This target represents the initial objective of the downward trend wave. Technically, this scenario is confirmed by the MACD indicator, with its signal line above zero and pointing strictly downwards.
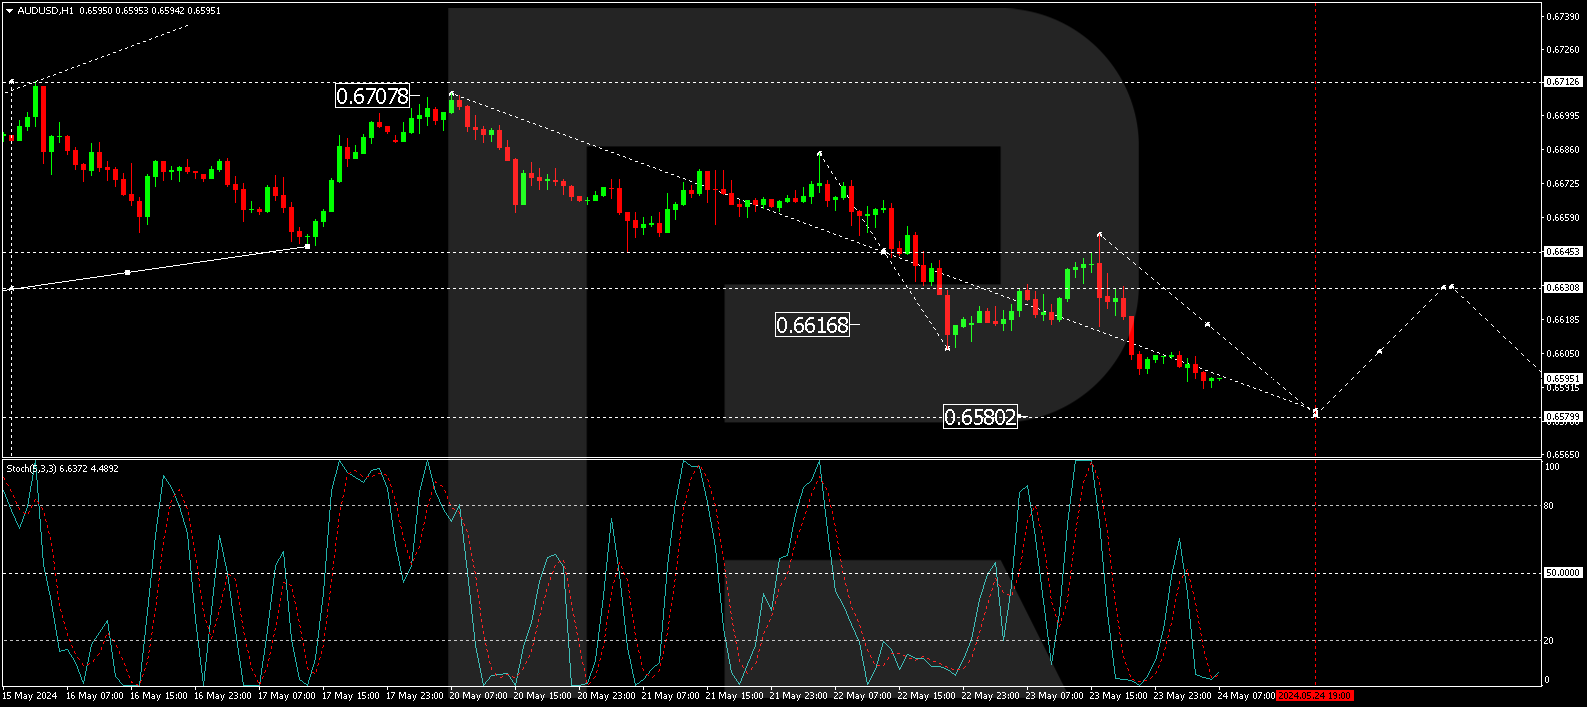
On the H1 chart, a consolidation range has formed around 0.6645. The downward exit from this range achieved the local target of 0.6607. The market has since corrected to 0.6646 (testing from below). Today, the decline wave to 0.6580 continues. After reaching this level, a consolidation range is expected to form around it. An upward exit from this range could lead to a correction to 0.6630. Conversely, a downward exit would open the potential for a further decline to 0.6540. This scenario is technically confirmed by the Stochastic oscillator, with its signal line below 20, indicating a potential beginning of a growth link to 50.
Summary
The Australian dollar’s depreciation is largely influenced by the strong US dollar and the cautious outlook of the Federal Reserve and the Reserve Bank of Australia. Technical indicators suggest further potential declines with possible corrective rebounds. Market participants should closely monitor these levels as economic conditions and policy expectations evolve.
Disclaimer
Any forecasts contained herein are based on the author’s particular opinion. This analysis may not be treated as trading advice. RoboForex bears no responsibility for trading results based on trading recommendations and reviews contained herein.

- Gold Surges 2% Since Week Opening Amid Geopolitical Shifts and Fed Expectations Jun 17, 2026
- Your Bourse and FXPRIMUS Bring 24/7 Synthetic Indices to the Global Broker Market Jun 16, 2026
- Institutional investors continue to reduce their presence in metals Jun 16, 2026
- USDJPY Driven by Emotions: Bank of Japan Raises Rate to Highest Level Since 1995 Jun 16, 2026
- The United States and Iran have signed a peace agreement – oil has fallen to 80 dollars per barrel. Jun 15, 2026
- EURUSD Ahead of the New Week: Expecting High Volatility Jun 15, 2026
- COT Metals Charts: Speculator Bets led by Steel Jun 14, 2026
- COT Bonds Charts: Speculator Bets led by 2-Year Bonds & Ultra 10-Year Bonds Jun 14, 2026
- COT Energy Charts: Speculator Bets led by Brent Oil Jun 14, 2026
- COT Soft Commodities Charts: Weekly Speculator Bets led lower by Corn and Soybean Meal Jun 14, 2026