
By RoboForex Analytical Department
Gold prices have stabilized around $2170.00 per troy ounce after two days of decline. Investors are taking a pause ahead of an important US inflation indicator report due this week, which could provide insights into the future direction of the Federal Reserve’s monetary policy.
The Core PCE index data, an inflation measure closely watched by the Federal Reserve, will be released this Friday. This week, several Federal Reserve officials, including Chair Jerome Powell, will speak at various events, potentially influencing market reactions. Additionally, most markets in Catholic countries will be closed on Good Friday at the week’s end, possibly delaying market reactions.
Strategically, gold has gained solid support after the Federal Reserve’s March meeting outlined three interest rate cuts for the current year. Support also came from the Swiss National Bank, which unexpectedly reduced its lending rate, sparking discussions that other major central banks might ease monetary policy sooner than expected – even before the Fed. For gold, this is a positive signal: lower interest rates reduce the opportunity cost of holding bullion.
The probability of the Fed starting to cut rates in June is estimated at 74%.
COMEX data shows that net long positions in gold have decreased by 2,093 contracts to 157,467 contracts, which is not critical for the precious metal’s trend.
Free Reports:
 Download Our Metatrader 4 Indicators – Put Our Free MetaTrader 4 Custom Indicators on your charts when you join our Weekly Newsletter
 Get our Weekly Commitment of Traders Reports - See where the biggest traders (Hedge Funds and Commercial Hedgers) are positioned in the futures markets on a weekly basis.
Technical analysis of XAU/USD
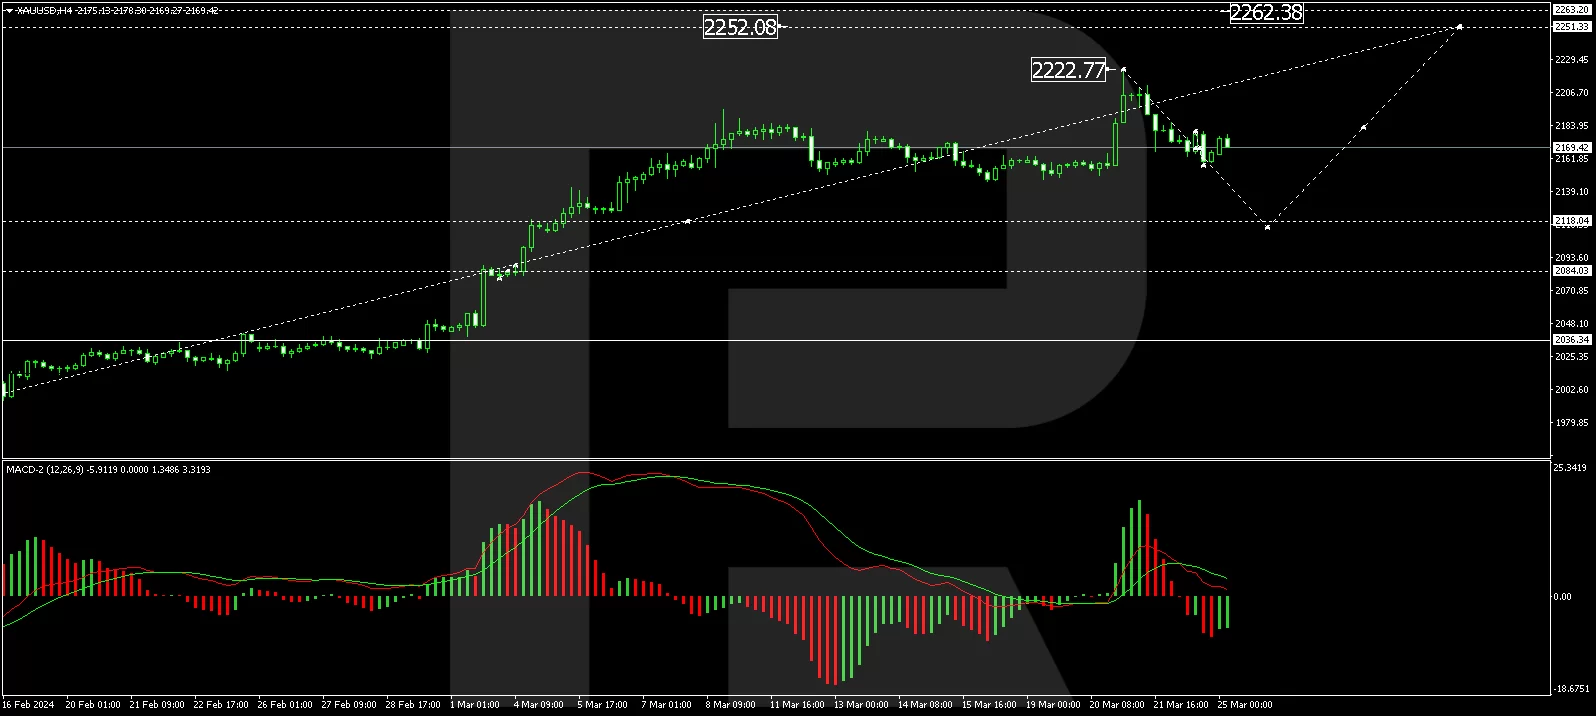
On the H4 chart, XAU/USD reached a local target of 2222.77. A correction to the level of 2157.05 has been executed today. Currently, the market is forming a consolidation range around 2168.40. A downward breakout is expected, followed by a continuation of the correction to 2114.60. After completing this correction, a growth wave to 2251.33 is anticipated. This scenario is supported by the MACD indicator, with its signal line above zero and sharply directed downwards.
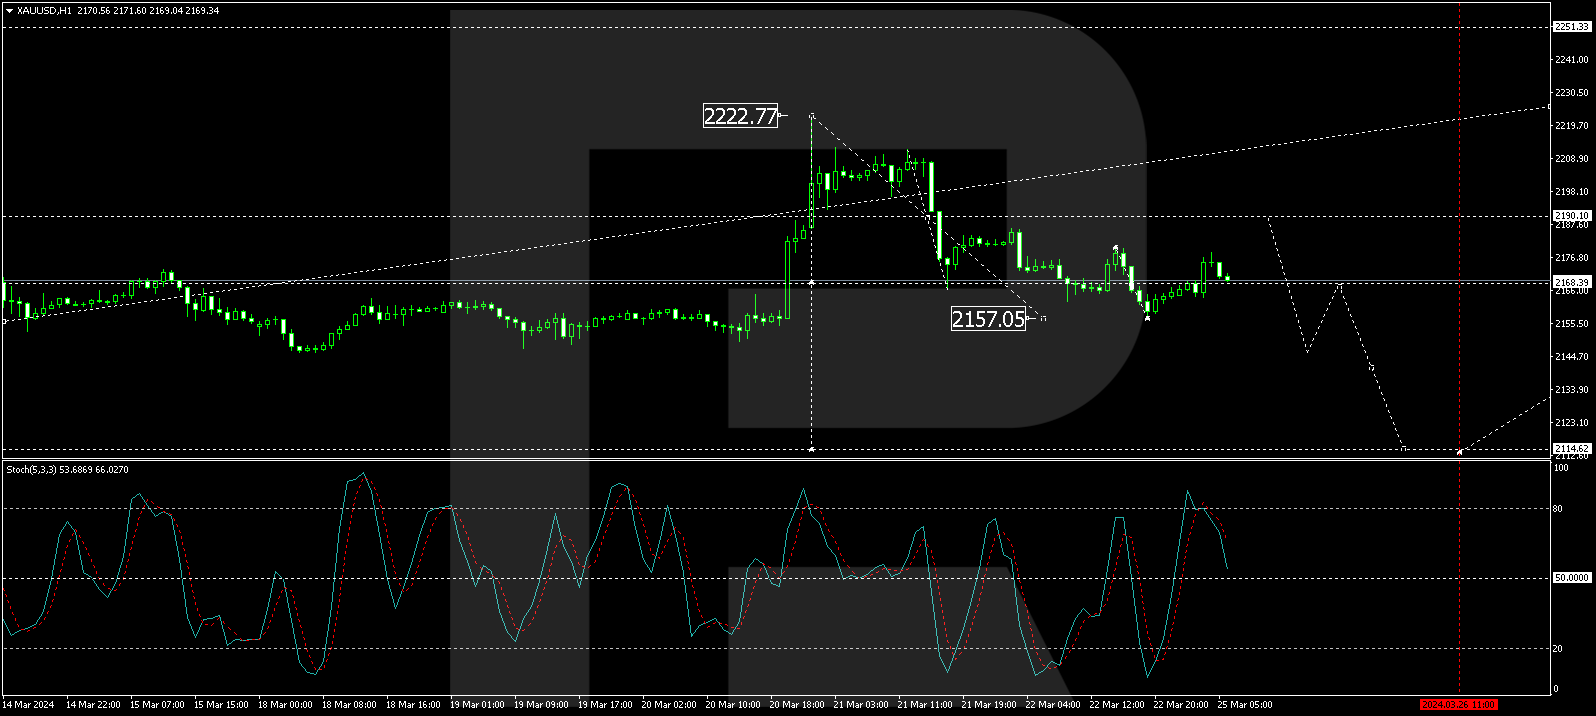
On the H1 chart, XAU/USD has formed a consolidation range around 2168.40. An upward exit from this range could lead to a correction towards 2188.77. After reaching this level, a decline to 2146.66 will be considered, followed by the possibility of rising back to 2168.40 (testing from below) and then a decline to 2114.60. This scenario is confirmed by the Stochastic oscillator, with its signal line below 80 and heading straight down to 20.
Disclaimer
Any forecasts contained herein are based on the author’s particular opinion. This analysis may not be treated as trading advice. RoboForex bears no responsibility for trading results based on trading recommendations and reviews contained herein.

- Gold Falls for the Third Consecutive Week: Is There Still Upside Potential? Jun 22, 2026
- Bank Indonesia raised its interest rate. Norges Bank and the SNB left rates unchanged Jun 19, 2026
- EUR/USD Loses Ground as Market Sentiment Favours the US Dollar Jun 19, 2026
- GBPUSD Awaits Bank of England Meeting Near April Lows Jun 18, 2026
- Markets disliked the results of the FOMC meeting. HKMA followed the Fed and kept its rate unchanged. Jun 18, 2026
- Gold Surges 2% Since Week Opening Amid Geopolitical Shifts and Fed Expectations Jun 17, 2026
- Your Bourse and FXPRIMUS Bring 24/7 Synthetic Indices to the Global Broker Market Jun 16, 2026
- Institutional investors continue to reduce their presence in metals Jun 16, 2026
- USDJPY Driven by Emotions: Bank of Japan Raises Rate to Highest Level Since 1995 Jun 16, 2026
- The United States and Iran have signed a peace agreement – oil has fallen to 80 dollars per barrel. Jun 15, 2026