
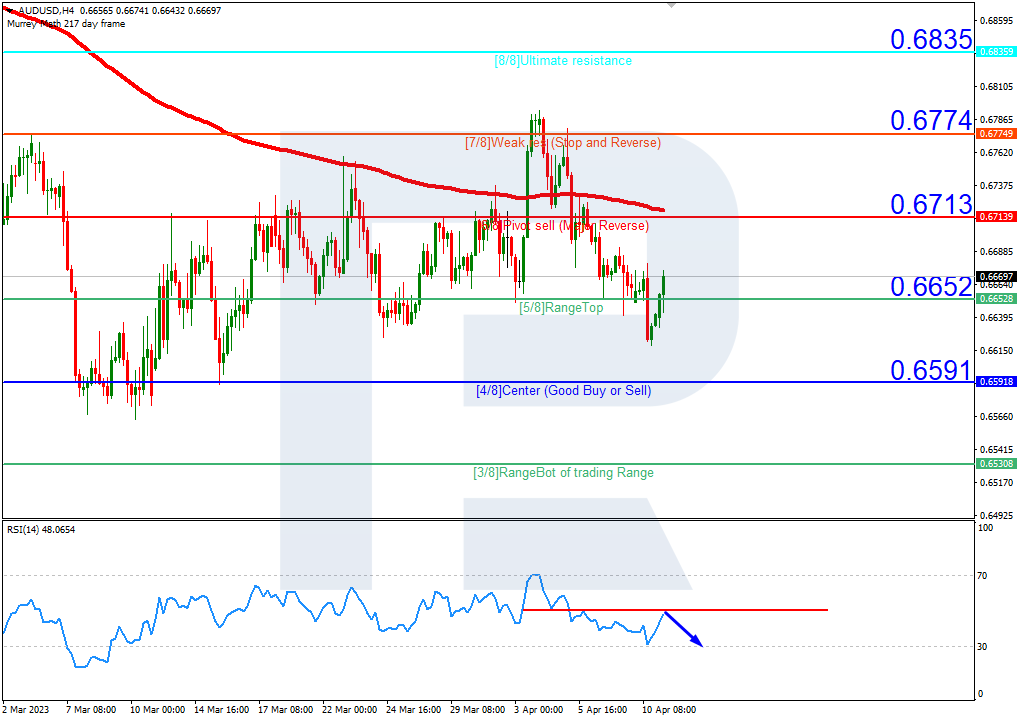
AUDUSD, “Australian Dollar vs US Dollar”
On H4, the quotes are under the 200-day Moving Average, indicating the prevalence of a downtrend. The RSI is testing the resistance line. In this situation, a downward breakout of 5/8 (0.6652) is expected, after which the price could drop to the support at 4/8 (0.6591). The scenario can be canceled if the quotes rise above the resistance at 6/8 (0.6713), which can lead to a trend reversal and growth of the pair to 7/8 (0.6774).

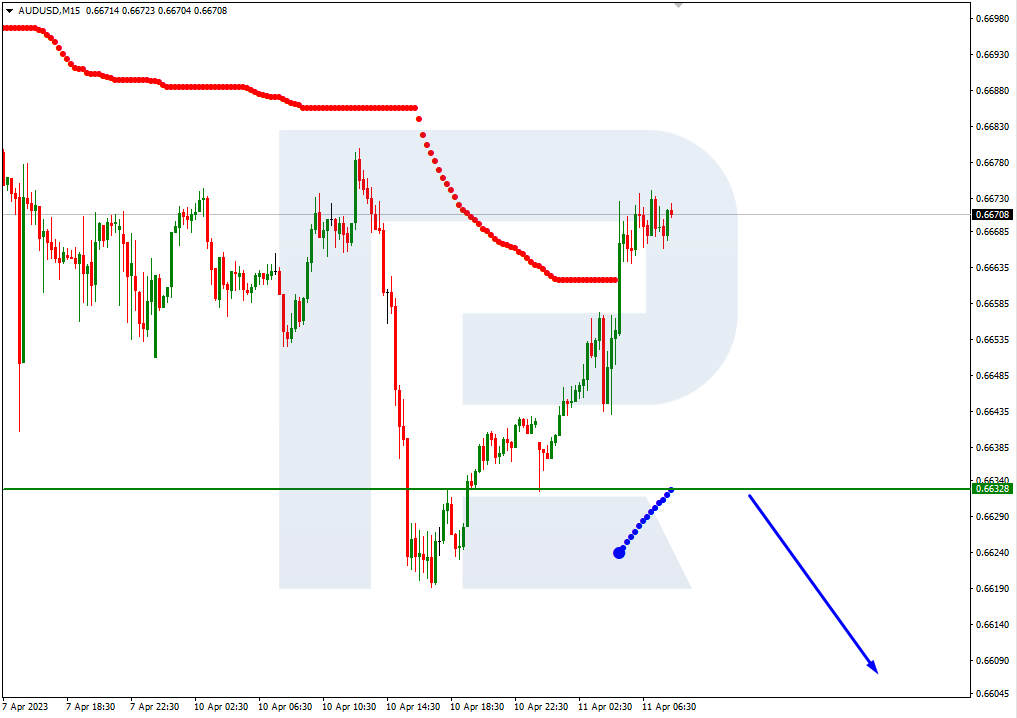
On M15, the decline in the price can be additionally supported by a breakaway of the lower line of the VoltyChannel indicator.
Free Reports:
 Sign Up for Our Stock Market Newsletter – Get updated on News, Charts & Rankings of Public Companies when you join our Stocks Newsletter
 Get our Weekly Commitment of Traders Reports - See where the biggest traders (Hedge Funds and Commercial Hedgers) are positioned in the futures markets on a weekly basis.
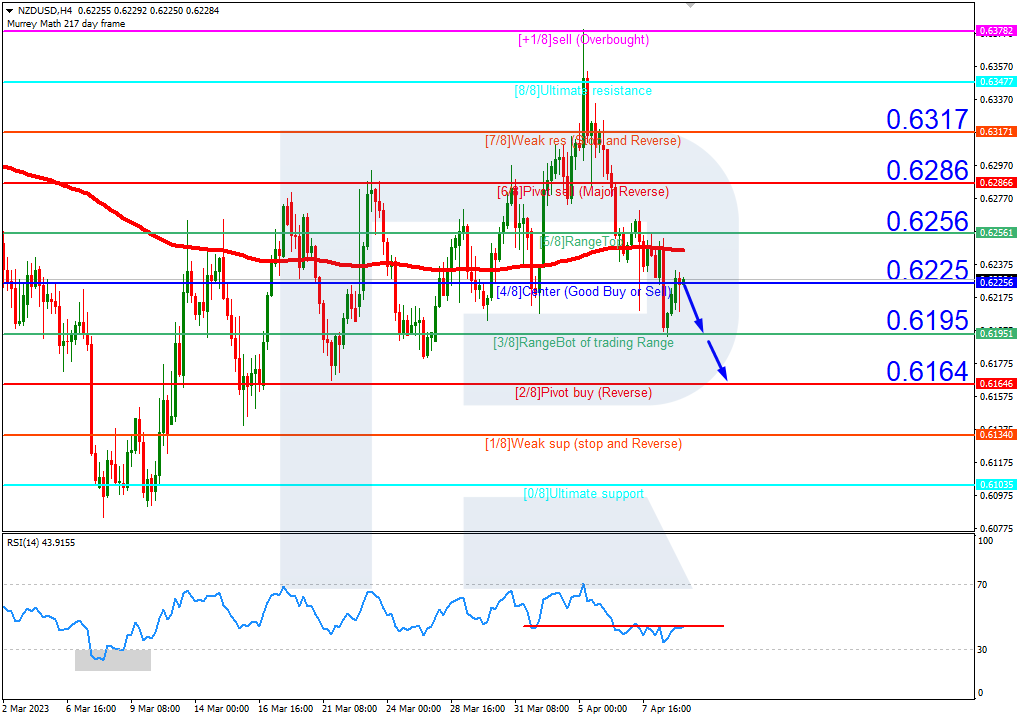
NZDUSD, “New Zealand Dollar vs US Dollar”
On the NZDUSD chart, the situation is similar. On H4, the quotes are under the 200-day Moving Average, revealing the prevalence of a downtrend, and the RSI is testing the resistance line. In these circumstances, a downwards breakout of 4/8 (0.6225) is to be expected, after which the price could fall to the support at 2/8 (0.6164). The scenario can be canceled by the price rising above the resistance at 5/8 (0.6256), which can end up in a trend reversal and growth of the pair to 7/8 (0.6317).
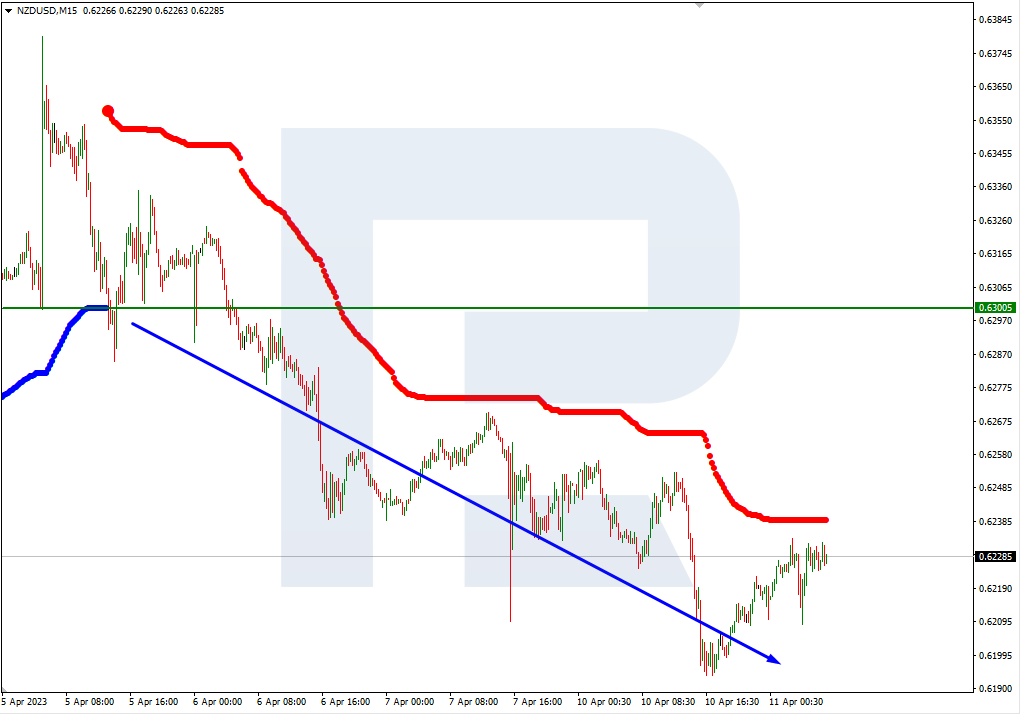
On M15, the lower line of VoltyChannel is broken, which confirms the downtrend and increases the probability of further price falling.
Article By RoboForex.com
Attention!
Forecasts presented in this section only reflect the author’s private opinion and should not be considered as guidance for trading. RoboForex LP bears no responsibility for trading results based on trading recommendations described in these analytical reviews.

- EUR/USD: The Advantage Remains with the Dollar Jun 29, 2026
- Escalation of the US–Iran conflict is once again supporting the rise in oil prices Jun 29, 2026
- Oil prices fall back to pre‑war levels. Silver drops to a 7‑month low Jun 25, 2026
- Gold Falls to an Eight-Month Low: This May Not Be the Bottom Jun 25, 2026
- Stock indices came under heavy selling pressure amid growing skepticism about AI investments Jun 24, 2026
- The Pound Is Pressured Not by Politics, but by a Strong US Dollar Jun 24, 2026
- Global crude oil prices continued to decline. The AUD/USD exchange rate hit an 11‑week low Jun 23, 2026
- EUR/USD Remains Under Sellers’ Control as the Dollar Stays Strong Jun 23, 2026
- Gold Falls for the Third Consecutive Week: Is There Still Upside Potential? Jun 22, 2026
- Bank Indonesia raised its interest rate. Norges Bank and the SNB left rates unchanged Jun 19, 2026