
Article By RoboForex.com
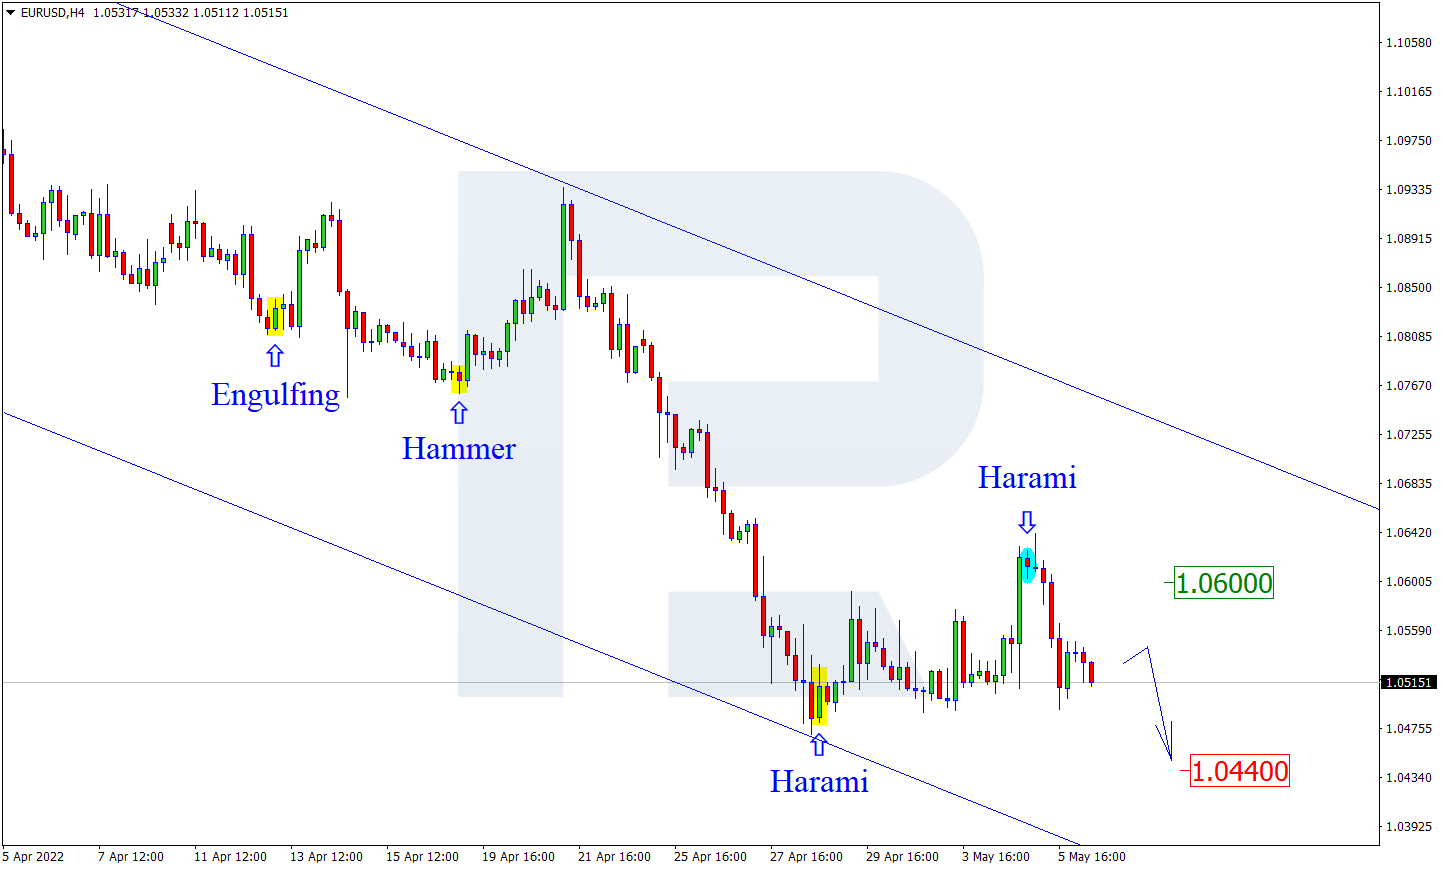
EURUSD, “Euro vs US Dollar”
As we can see in the H4 chart, the asset has formed a Harami reversal pattern close to the resistance area during the pullback. At the moment, EURUSD is reversing in the form of a new descending impulse. In this case, the downside target may be at 1.0440. However, an alternative scenario implies that the price may correct to rebound from the resistance area at 1.0600 and then resume the descending tendency.

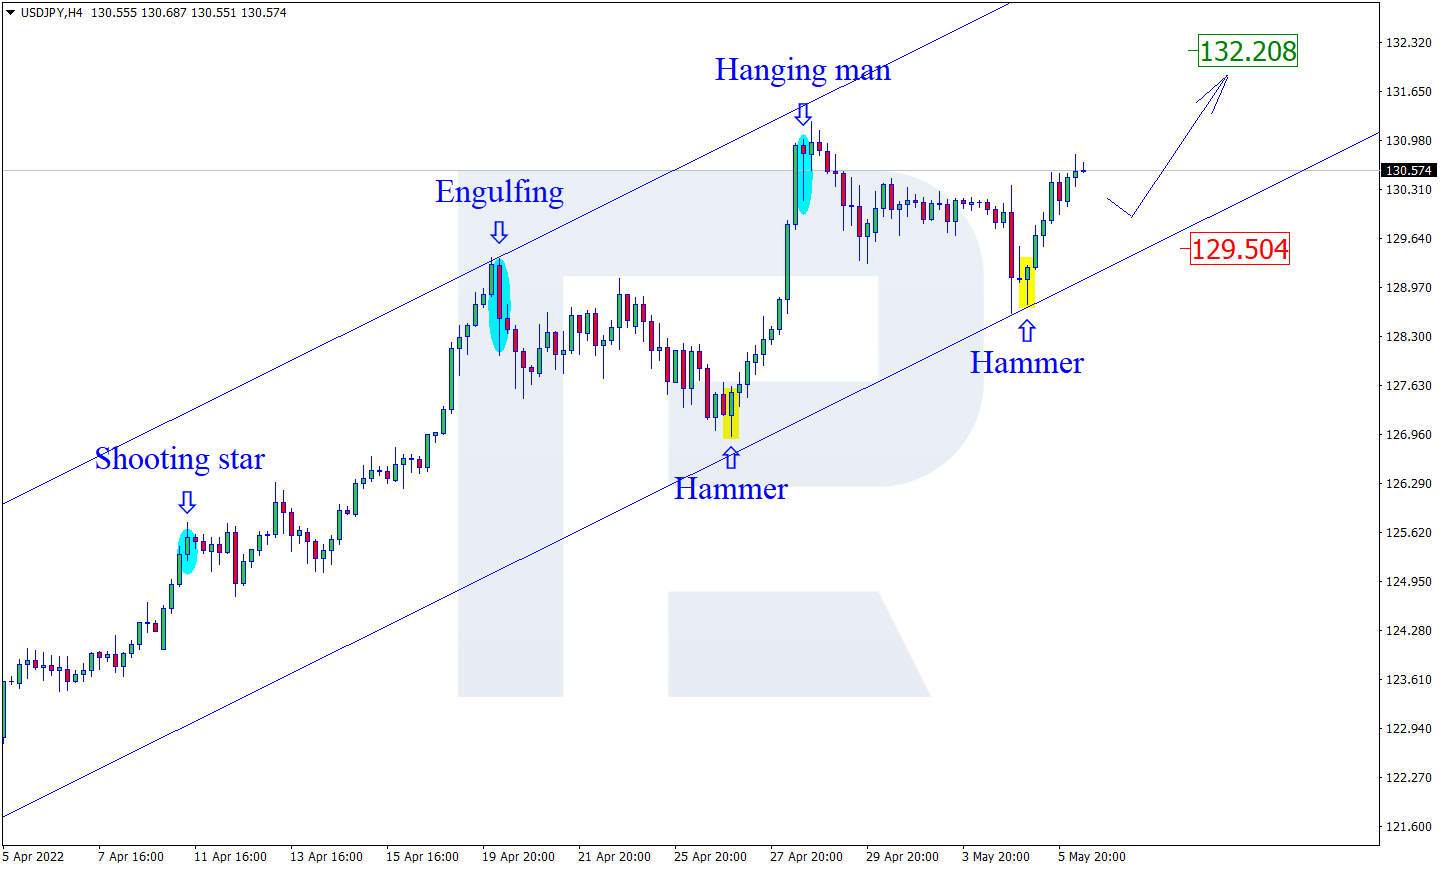
USDJPY, “US Dollar vs Japanese Yen”
As we can see in the H4 chart, USDJPY has formed a Hammer pattern not far from the support level. At the moment, the asset is reversing in the form of a new ascending impulse. In this case, the upside target may be at 132.20. At the same time, an opposite scenario implies that the price may correct to rebound from 129.50 and then resume the uptrend.
Free Reports:
 Get our Weekly Commitment of Traders Reports - See where the biggest traders (Hedge Funds and Commercial Hedgers) are positioned in the futures markets on a weekly basis.
 Sign Up for Our Stock Market Newsletter – Get updated on News, Charts & Rankings of Public Companies when you join our Stocks Newsletter
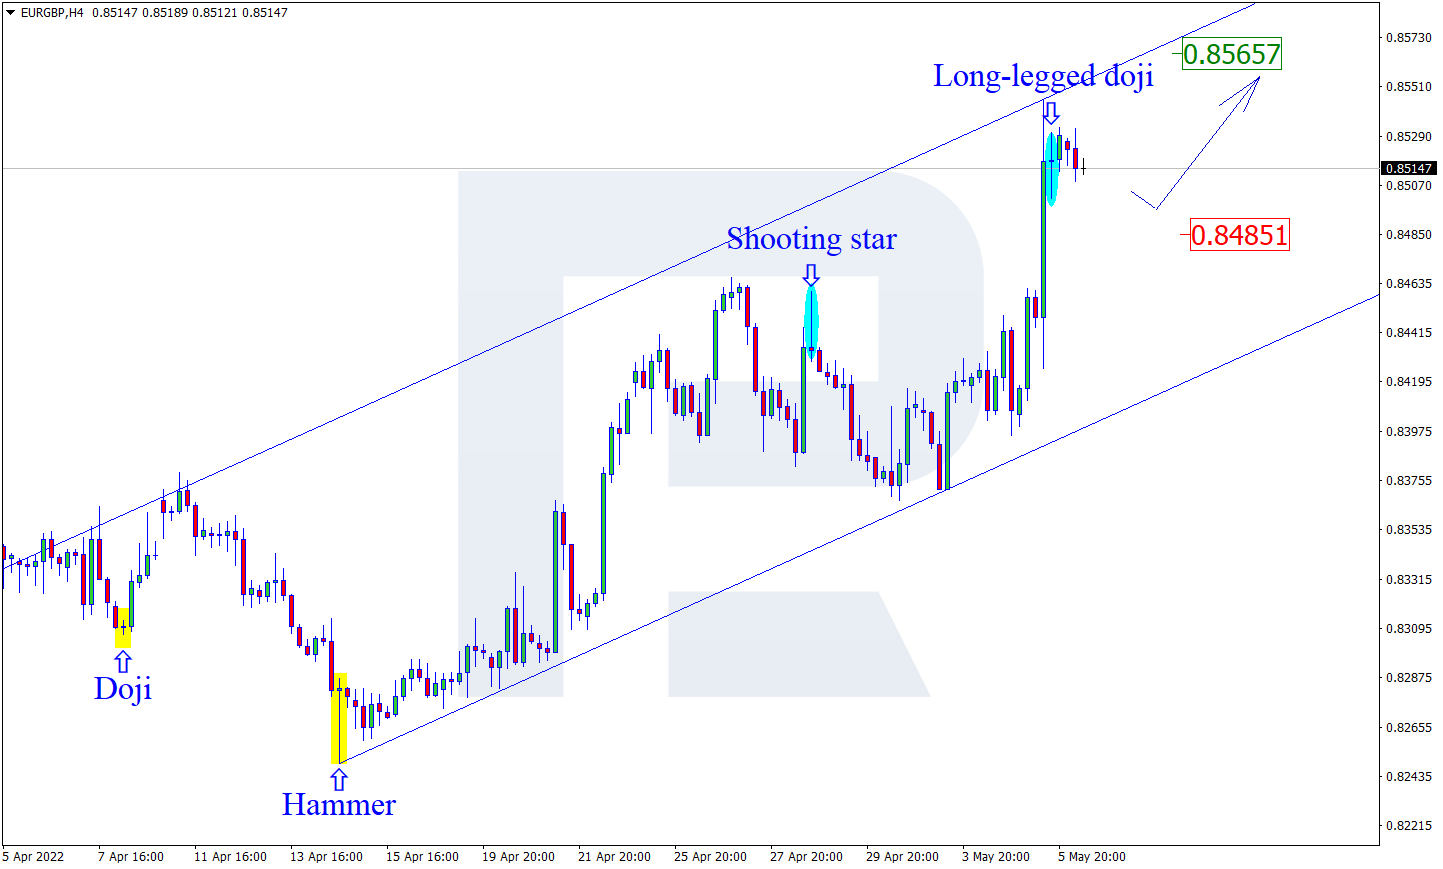
EURGBP, “Euro vs Great Britain Pound”
As we can see in the H4 chart, after forming a Long-Legged Doji pattern near the resistance area, EURGBP is reversing. In this case, the downside target may be the support level at 0.8485. Later, the market may test this level, rebound from it, and resume the ascending impulse. Still, there might be an alternative scenario, according to which the asset may grow to reach 0.8475 and continue the uptrend without testing the support level.
Article By RoboForex.com
Attention!
Forecasts presented in this section only reflect the author’s private opinion and should not be considered as guidance for trading. RoboForex LP bears no responsibility for trading results based on trading recommendations described in these analytical reviews.

- Oil prices fall back to pre‑war levels. Silver drops to a 7‑month low Jun 25, 2026
- Gold Falls to an Eight-Month Low: This May Not Be the Bottom Jun 25, 2026
- Stock indices came under heavy selling pressure amid growing skepticism about AI investments Jun 24, 2026
- The Pound Is Pressured Not by Politics, but by a Strong US Dollar Jun 24, 2026
- Global crude oil prices continued to decline. The AUD/USD exchange rate hit an 11‑week low Jun 23, 2026
- EUR/USD Remains Under Sellers’ Control as the Dollar Stays Strong Jun 23, 2026
- Gold Falls for the Third Consecutive Week: Is There Still Upside Potential? Jun 22, 2026
- Bank Indonesia raised its interest rate. Norges Bank and the SNB left rates unchanged Jun 19, 2026
- EUR/USD Loses Ground as Market Sentiment Favours the US Dollar Jun 19, 2026
- GBPUSD Awaits Bank of England Meeting Near April Lows Jun 18, 2026