
By InvestMacro | COT | Data Tables | COT Leaders | Downloads | COT Newsletter
Here are the latest charts and statistics for the Commitment of Traders (COT) data published by the Commodities Futures Trading Commission (CFTC).
The latest COT data is updated through Tuesday March 8th and shows a quick view of how large traders (for-profit speculators and commercial entities) were positioned in the futures markets.
Highlighting the COT energy data is the Brent Oil (Last Day) futures bets. The speculative net position in the Brent Crude Oil futures last week saw speculator sharply raise their weekly bets and brought the overall net position (-6,707 contracts) to the least bearish level of the previous four hundred and twenty-two weeks, dating all the way back to February 4th of 2014 when spec positions totaled -4,253 contracts. Due to the particular dynamics of this market, there has not been a bullish net speculator position in this market since 2013.
This week saw speculators add to their net bearish standing but not by much (-5,005 contracts) and we could see a possible positive speculator reading in this market soon due to the Russian invasion of Ukraine and the toll it has taken on the oil markets.
Joining Brent Crude Oil (-5,005 contracts) in falling this week were WTI Crude Oil (-6,998 contracts), Natural Gas (-12,004 contracts), Heating Oil (-9,228 contracts), Gasoline (-15,543 contracts) and the Bloomberg Commodity Index (-1,693 contracts).
Free Reports:
 Get our Weekly Commitment of Traders Reports - See where the biggest traders (Hedge Funds and Commercial Hedgers) are positioned in the futures markets on a weekly basis.
 Download Our Metatrader 4 Indicators – Put Our Free MetaTrader 4 Custom Indicators on your charts when you join our Weekly Newsletter
| Mar-08-2022 | OI | OI-Index | Spec-Net | Spec-Index | Com-Net | COM-Index | Smalls-Net | Smalls-Index |
|---|---|---|---|---|---|---|---|---|
| WTI Crude | 1,896,974 | 5 | 361,665 | 11 | -408,809 | 80 | 47,144 | 81 |
| Gold | 638,502 | 57 | 274,388 | 75 | -306,946 | 24 | 32,558 | 57 |
| Silver | 168,283 | 33 | 52,297 | 74 | -69,609 | 31 | 17,312 | 44 |
| Copper | 198,844 | 26 | 31,819 | 65 | -40,070 | 32 | 8,251 | 73 |
| Palladium | 7,631 | 5 | -272 | 20 | -563 | 73 | 835 | 94 |
| Platinum | 72,496 | 43 | 25,833 | 39 | -32,358 | 63 | 6,525 | 53 |
| Natural Gas | 1,085,853 | 0 | -138,413 | 37 | 97,671 | 62 | 40,742 | 82 |
| Brent | 196,832 | 37 | -11,712 | 92 | 10,814 | 11 | 898 | 21 |
| Heating Oil | 349,618 | 31 | 6,455 | 52 | -32,434 | 37 | 25,979 | 88 |
| Soybeans | 743,566 | 32 | 216,577 | 84 | -189,219 | 21 | -27,358 | 25 |
| Corn | 1,487,815 | 19 | 498,033 | 94 | -456,684 | 7 | -41,349 | 19 |
| Coffee | 224,222 | 3 | 52,113 | 86 | -56,074 | 16 | 3,961 | 16 |
| Sugar | 837,413 | 5 | 151,076 | 68 | -190,856 | 32 | 39,780 | 57 |
| Wheat | 342,996 | 4 | 12,625 | 58 | -5,496 | 35 | -7,129 | 72 |
WTI Crude Oil Futures:
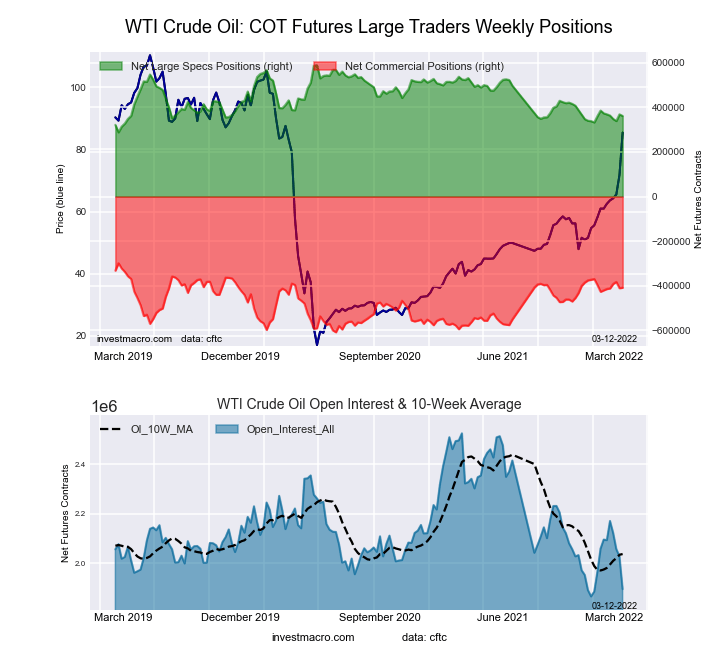 The WTI Crude Oil Futures large speculator standing this week resulted in a net position of 361,665 contracts in the data reported through Tuesday. This was a weekly lowering of -6,998 contracts from the previous week which had a total of 368,663 net contracts.
This week’s current strength score (the trader positioning range over the past three years, measured from 0 to 100) shows the speculators are currently Bearish-Extreme with a score of 11.2 percent. The commercials are Bullish with a score of 79.9 percent and the small traders (not shown in chart) are Bullish-Extreme with a score of 81.5 percent.
| WTI Crude Oil Futures Statistics | SPECULATORS | COMMERCIALS | SMALL TRADERS |
| – Percent of Open Interest Longs: | 24.0 | 36.7 | 5.3 |
| – Percent of Open Interest Shorts: | 4.9 | 58.3 | 2.8 |
| – Net Position: | 361,665 | -408,809 | 47,144 |
| – Gross Longs: | 455,339 | 696,449 | 99,767 |
| – Gross Shorts: | 93,674 | 1,105,258 | 52,623 |
| – Long to Short Ratio: | 4.9 to 1 | 0.6 to 1 | 1.9 to 1 |
| NET POSITION TREND: | |||
| – Strength Index Score (3 Year Range Pct): | 11.2 | 79.9 | 81.5 |
| – Strength Index Reading (3 Year Range): | Bearish-Extreme | Bullish | Bullish-Extreme |
| NET POSITION MOVEMENT INDEX: | |||
| – 6-Week Change in Strength Index: | -4.6 | 4.7 | -0.1 |
Brent Crude Oil Futures:
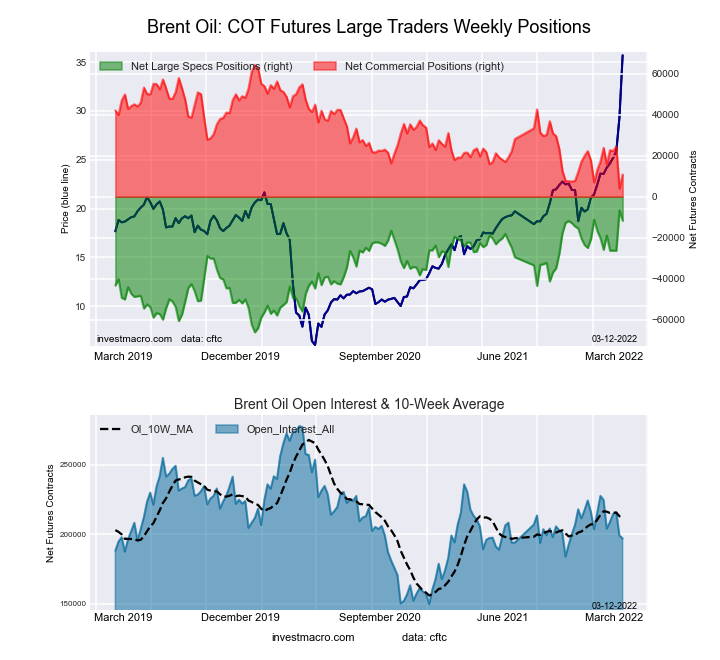 The Brent Crude Oil Futures large speculator standing this week resulted in a net position of -11,712 contracts in the data reported through Tuesday. This was a weekly reduction of -5,005 contracts from the previous week which had a total of -6,707 net contracts.
This week’s current strength score (the trader positioning range over the past three years, measured from 0 to 100) shows the speculators are currently Bullish-Extreme with a score of 91.6 percent. The commercials are Bearish-Extreme with a score of 11.3 percent and the small traders (not shown in chart) are Bearish with a score of 21.4 percent.
| Brent Crude Oil Futures Statistics | SPECULATORS | COMMERCIALS | SMALL TRADERS |
| – Percent of Open Interest Longs: | 25.6 | 37.8 | 4.8 |
| – Percent of Open Interest Shorts: | 31.5 | 32.3 | 4.3 |
| – Net Position: | -11,712 | 10,814 | 898 |
| – Gross Longs: | 50,323 | 74,477 | 9,367 |
| – Gross Shorts: | 62,035 | 63,663 | 8,469 |
| – Long to Short Ratio: | 0.8 to 1 | 1.2 to 1 | 1.1 to 1 |
| NET POSITION TREND: | |||
| – Strength Index Score (3 Year Range Pct): | 91.6 | 11.3 | 21.4 |
| – Strength Index Reading (3 Year Range): | Bullish-Extreme | Bearish-Extreme | Bearish |
| NET POSITION MOVEMENT INDEX: | |||
| – 6-Week Change in Strength Index: | 23.9 | -21.7 | -15.9 |
Natural Gas Futures:
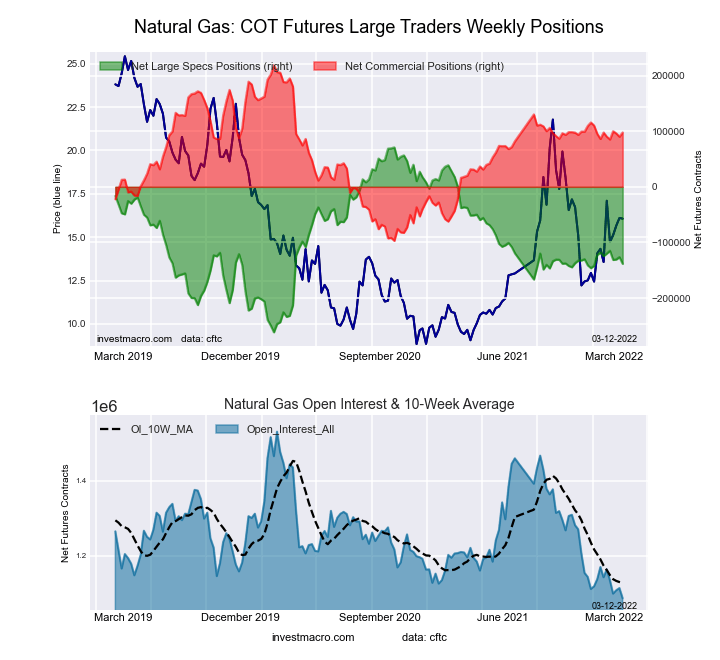 The Natural Gas Futures large speculator standing this week resulted in a net position of -138,413 contracts in the data reported through Tuesday. This was a weekly reduction of -12,004 contracts from the previous week which had a total of -126,409 net contracts.
This week’s current strength score (the trader positioning range over the past three years, measured from 0 to 100) shows the speculators are currently Bearish with a score of 37.0 percent. The commercials are Bullish with a score of 61.7 percent and the small traders (not shown in chart) are Bullish-Extreme with a score of 82.1 percent.
| Natural Gas Futures Statistics | SPECULATORS | COMMERCIALS | SMALL TRADERS |
| – Percent of Open Interest Longs: | 22.6 | 43.6 | 5.6 |
| – Percent of Open Interest Shorts: | 35.3 | 34.6 | 1.9 |
| – Net Position: | -138,413 | 97,671 | 40,742 |
| – Gross Longs: | 245,092 | 473,729 | 60,990 |
| – Gross Shorts: | 383,505 | 376,058 | 20,248 |
| – Long to Short Ratio: | 0.6 to 1 | 1.3 to 1 | 3.0 to 1 |
| NET POSITION TREND: | |||
| – Strength Index Score (3 Year Range Pct): | 37.0 | 61.7 | 82.1 |
| – Strength Index Reading (3 Year Range): | Bearish | Bullish | Bullish-Extreme |
| NET POSITION MOVEMENT INDEX: | |||
| – 6-Week Change in Strength Index: | -4.2 | 0.0 | 34.8 |
Gasoline Blendstock Futures:
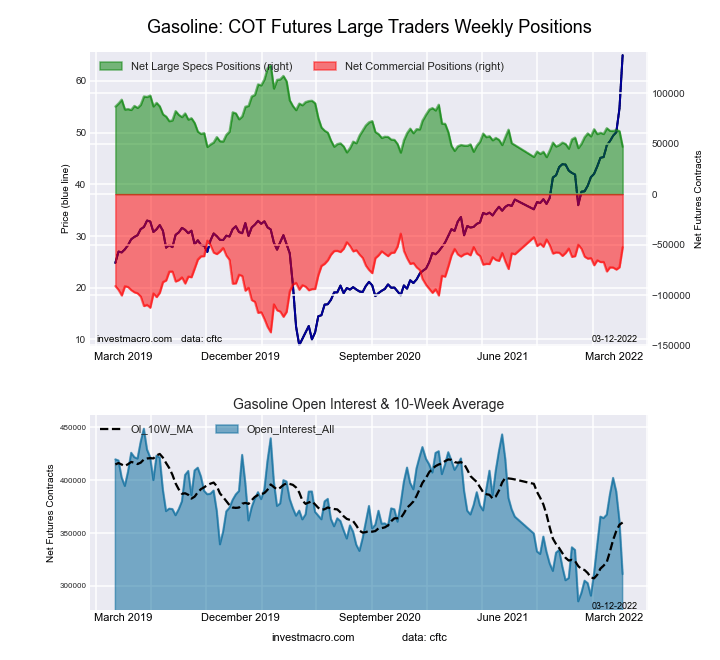 The Gasoline Blendstock Futures large speculator standing this week resulted in a net position of 46,900 contracts in the data reported through Tuesday. This was a weekly lowering of -15,543 contracts from the previous week which had a total of 62,443 net contracts.
This week’s current strength score (the trader positioning range over the past three years, measured from 0 to 100) shows the speculators are currently Bearish-Extreme with a score of 17.8 percent. The commercials are Bullish-Extreme with a score of 84.4 percent and the small traders (not shown in chart) are Bearish with a score of 45.6 percent.
| Nasdaq Mini Futures Statistics | SPECULATORS | COMMERCIALS | SMALL TRADERS |
| – Percent of Open Interest Longs: | 26.6 | 51.0 | 6.6 |
| – Percent of Open Interest Shorts: | 11.6 | 67.9 | 4.8 |
| – Net Position: | 46,900 | -52,610 | 5,710 |
| – Gross Longs: | 82,887 | 158,839 | 20,554 |
| – Gross Shorts: | 35,987 | 211,449 | 14,844 |
| – Long to Short Ratio: | 2.3 to 1 | 0.8 to 1 | 1.4 to 1 |
| NET POSITION TREND: | |||
| – Strength Index Score (3 Year Range Pct): | 17.8 | 84.4 | 45.6 |
| – Strength Index Reading (3 Year Range): | Bearish-Extreme | Bullish-Extreme | Bearish |
| NET POSITION MOVEMENT INDEX: | |||
| – 6-Week Change in Strength Index: | -12.9 | 14.6 | -11.2 |
#2 Heating Oil NY-Harbor Futures:
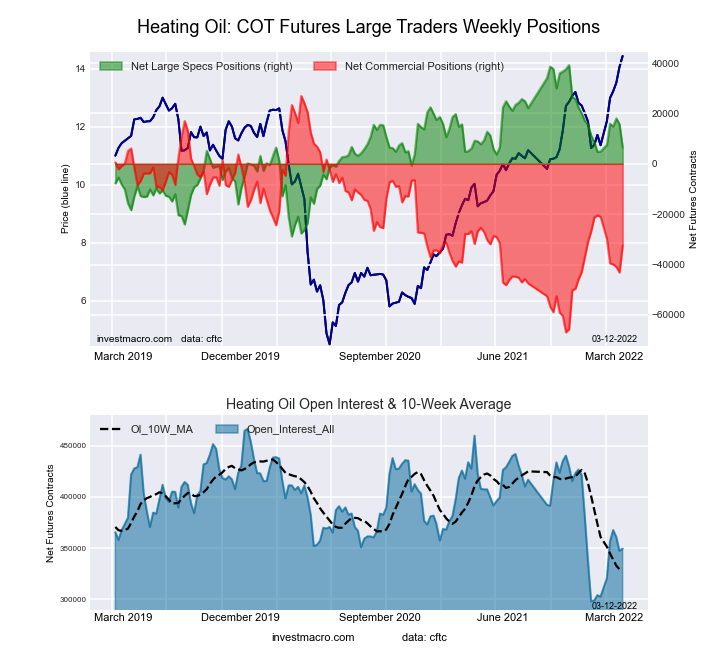 The #2 Heating Oil NY-Harbor Futures large speculator standing this week resulted in a net position of 6,455 contracts in the data reported through Tuesday. This was a weekly lowering of -9,228 contracts from the previous week which had a total of 15,683 net contracts.
This week’s current strength score (the trader positioning range over the past three years, measured from 0 to 100) shows the speculators are currently Bullish with a score of 51.9 percent. The commercials are Bearish with a score of 36.7 percent and the small traders (not shown in chart) are Bullish-Extreme with a score of 88.4 percent.
| Heating Oil Futures Statistics | SPECULATORS | COMMERCIALS | SMALL TRADERS |
| – Percent of Open Interest Longs: | 17.0 | 50.8 | 14.4 |
| – Percent of Open Interest Shorts: | 15.1 | 60.1 | 6.9 |
| – Net Position: | 6,455 | -32,434 | 25,979 |
| – Gross Longs: | 59,340 | 177,626 | 50,210 |
| – Gross Shorts: | 52,885 | 210,060 | 24,231 |
| – Long to Short Ratio: | 1.1 to 1 | 0.8 to 1 | 2.1 to 1 |
| NET POSITION TREND: | |||
| – Strength Index Score (3 Year Range Pct): | 51.9 | 36.7 | 88.4 |
| – Strength Index Reading (3 Year Range): | Bullish | Bearish | Bullish-Extreme |
| NET POSITION MOVEMENT INDEX: | |||
| – 6-Week Change in Strength Index: | 4.2 | -10.3 | 23.6 |
Bloomberg Commodity Index Futures:
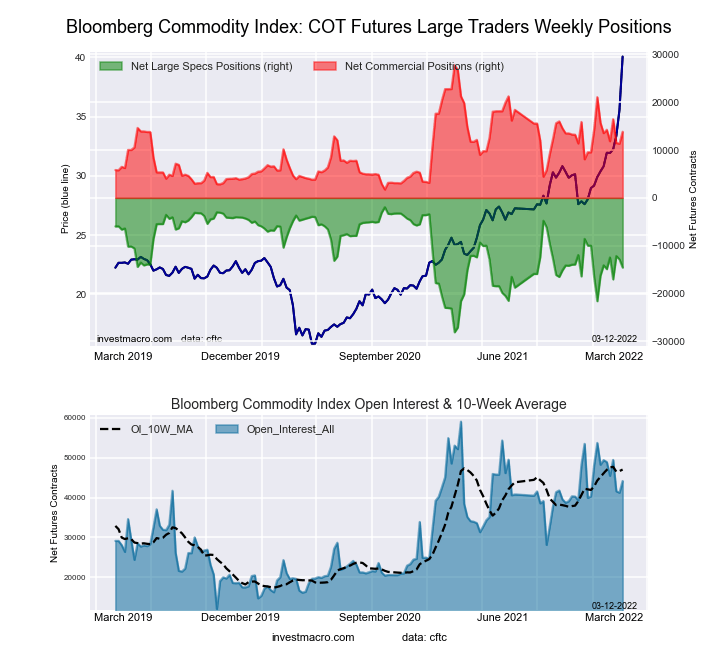 The Bloomberg Commodity Index Futures large speculator standing this week resulted in a net position of -14,569 contracts in the data reported through Tuesday. This was a weekly decline of -1,693 contracts from the previous week which had a total of -12,876 net contracts.
This week’s current strength score (the trader positioning range over the past three years, measured from 0 to 100) shows the speculators are currently Bullish with a score of 51.8 percent. The commercials are Bearish with a score of 46.5 percent and the small traders (not shown in chart) are Bearish with a score of 45.9 percent.
| Bloomberg Index Futures Statistics | SPECULATORS | COMMERCIALS | SMALL TRADERS |
| – Percent of Open Interest Longs: | 62.5 | 32.8 | 1.9 |
| – Percent of Open Interest Shorts: | 95.4 | 1.5 | 0.2 |
| – Net Position: | -14,569 | 13,825 | 744 |
| – Gross Longs: | 27,594 | 14,481 | 828 |
| – Gross Shorts: | 42,163 | 656 | 84 |
| – Long to Short Ratio: | 0.7 to 1 | 22.1 to 1 | 9.9 to 1 |
| NET POSITION TREND: | |||
| – Strength Index Score (3 Year Range Pct): | 51.8 | 46.5 | 45.9 |
| – Strength Index Reading (3 Year Range): | Bullish | Bearish | Bearish |
| NET POSITION MOVEMENT INDEX: | |||
| – 6-Week Change in Strength Index: | -1.8 | 1.1 | 6.4 |
Article By InvestMacro – Receive our weekly COT Reports by Email
*COT Report: The COT data, released weekly to the public each Friday, is updated through the most recent Tuesday (data is 3 days old) and shows a quick view of how large speculators or non-commercials (for-profit traders) were positioned in the futures markets.
The CFTC categorizes trader positions according to commercial hedgers (traders who use futures contracts for hedging as part of the business), non-commercials (large traders who speculate to realize trading profits) and nonreportable traders (usually small traders/speculators) as well as their open interest (contracts open in the market at time of reporting).See CFTC criteria here.

- The ceasefire between Israel and Lebanon has reduced the geopolitical premium Jun 5, 2026
- EUR/USD: All Eyes on Non-Farm Payrolls Jun 5, 2026
- The escalation of the conflict in the Middle East put pressure on US and European stock indices Jun 4, 2026
- Gold Remains Under Pressure, but a Rebound Is Still Possible Jun 4, 2026
- Bitcoin drops below the psychological $70,000 level. The US stock indices hit new record highs Jun 3, 2026
- EUR/USD on Edge as Markets Await Key Employment Data Jun 3, 2026
- Oil prices surged again amid rumors of a freeze in diplomacy between the United States and Iran Jun 2, 2026
- GBP/USD in a State of Uncertainty: Risks Remain, but Market Reactions Are Muted Jun 2, 2026
- The US stock indices once again finished the trading session at new all‑time highs Jun 1, 2026
- USD/JPY Approaches 160.00: Is Another Intervention Coming? Jun 1, 2026