
By InvestMacro.com COT Home | Data Tables | Data Downloads | Newsletter
Here are the latest charts and statistics for the Commitment of Traders (COT) data published by the Commodities Futures Trading Commission (CFTC).
The latest COT data is updated through Tuesday October 19th 2021 and shows a quick view of how large traders (for-profit speculators and commercial entities) were positioned in the futures markets.
Highlighting this week’s COT Energy data is the speculator’s WTI Crude Oil bullish bets which have now gained for six straight weeks. WTI crude speculator wagers have risen by a total of +80,436 contracts over that time-frame and has pushed the current bullish standing to an eleven week high-point. The WTI futures price has surged recently to the highest level since 2014 due to many factors including fears over supply combined with more demand.
| Oct-19-2021 | OI | OI-Index | Spec-Net | Spec-Index | Com-Net | COM-Index | Smalls-Net | Smalls-Index |
|---|---|---|---|---|---|---|---|---|
| WTI Crude | 2,205,089 | 44 | 429,594 | 49 | -473,181 | 41 | 43,587 | 76 |
| Gold | 485,974 | 22 | 193,349 | 56 | -219,190 | 43 | 25,841 | 43 |
| Silver | 143,664 | 10 | 30,356 | 53 | -44,580 | 55 | 14,224 | 23 |
| Copper | 225,225 | 44 | 40,584 | 72 | -46,208 | 28 | 5,624 | 58 |
| Palladium | 9,061 | 12 | -2,416 | 5 | 2,355 | 93 | 61 | 48 |
| Platinum | 58,570 | 19 | 14,844 | 24 | -21,176 | 79 | 6,332 | 50 |
| Natural Gas | 1,318,498 | 48 | -131,070 | 39 | 86,574 | 58 | 44,496 | 92 |
| Brent | 202,714 | 41 | -28,018 | 73 | 23,413 | 23 | 4,605 | 76 |
| Heating Oil | 415,556 | 56 | 26,441 | 81 | -50,250 | 18 | 23,809 | 81 |
| Soybeans | 750,939 | 33 | 43,541 | 41 | -9,575 | 64 | -33,966 | 15 |
| Corn | 1,404,126 | 5 | 277,029 | 65 | -218,172 | 41 | -58,857 | 9 |
| Coffee | 304,874 | 62 | 68,889 | 99 | -73,100 | 3 | 4,211 | 17 |
| Sugar | 871,316 | 21 | 211,550 | 80 | -243,564 | 22 | 32,014 | 47 |
| Wheat | 394,949 | 27 | -8,566 | 40 | 18,180 | 59 | -9,614 | 56 |
WTI Crude Oil Futures:
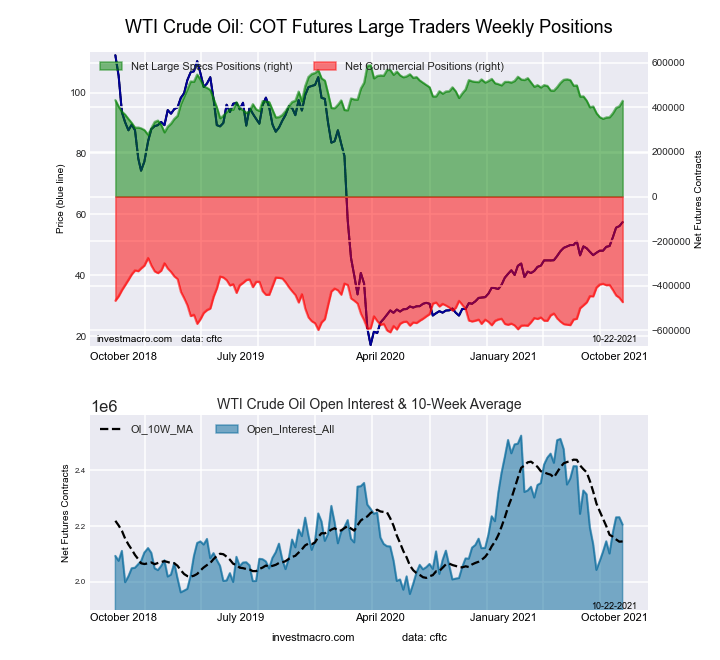 The WTI Crude Oil Futures large speculator standing this week resulted in a net position of 429,594 contracts in the data reported through Tuesday. This was a weekly boost of 24,818 contracts from the previous week which had a total of 404,776 net contracts.
Free Reports:
 Get our Weekly Commitment of Traders Reports - See where the biggest traders (Hedge Funds and Commercial Hedgers) are positioned in the futures markets on a weekly basis.
 Download Our Metatrader 4 Indicators – Put Our Free MetaTrader 4 Custom Indicators on your charts when you join our Weekly Newsletter
This week’s current strength score (the trader positioning range over the past three years, measured from 0 to 100) shows the speculators are currently Bearish with a score of 48.8 percent. The commercials are Bearish with a score of 40.6 percent and the small traders (not shown in chart) are Bullish with a score of 76.4 percent.
| WTI Crude Oil Futures Statistics | SPECULATORS | COMMERCIALS | SMALL TRADERS |
| – Percent of Open Interest Longs: | 25.7 | 31.7 | 4.4 |
| – Percent of Open Interest Shorts: | 6.2 | 53.2 | 2.5 |
| – Net Position: | 429,594 | -473,181 | 43,587 |
| – Gross Longs: | 565,720 | 698,992 | 97,623 |
| – Gross Shorts: | 136,126 | 1,172,173 | 54,036 |
| – Long to Short Ratio: | 4.2 to 1 | 0.6 to 1 | 1.8 to 1 |
| NET POSITION TREND: | |||
| – COT Index Score (3 Year Range Pct): | 48.8 | 40.6 | 76.4 |
| – COT Index Reading (3 Year Range): | Bearish | Bearish | Bullish |
| NET POSITION MOVEMENT INDEX: | |||
| – 6-Week Change in Strength Index: | 25.8 | -24.6 | 2.1 |
Brent Crude Oil Futures:
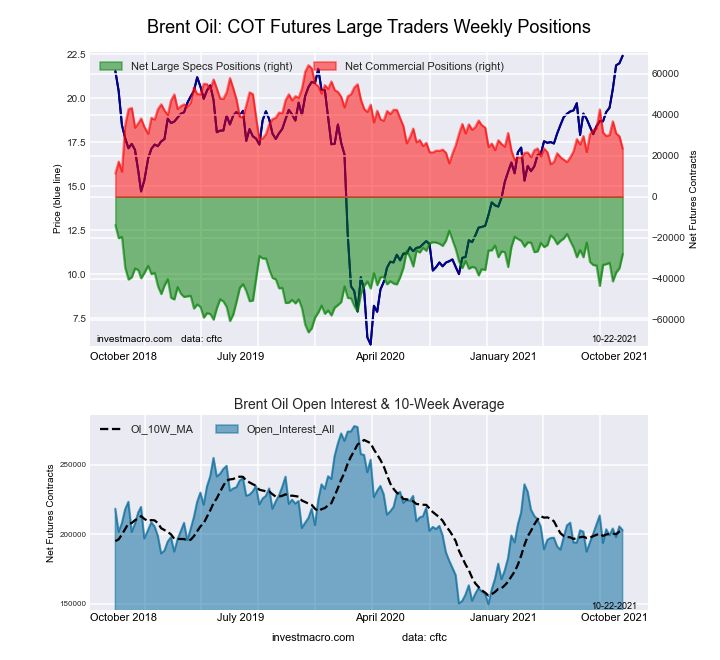 The Brent Crude Oil Futures large speculator standing this week resulted in a net position of -28,018 contracts in the data reported through Tuesday. This was a weekly advance of 6,906 contracts from the previous week which had a total of -34,924 net contracts.
This week’s current strength score (the trader positioning range over the past three years, measured from 0 to 100) shows the speculators are currently Bullish with a score of 73.0 percent. The commercials are Bearish with a score of 22.9 percent and the small traders (not shown in chart) are Bullish with a score of 75.8 percent.
| Brent Crude Oil Futures Statistics | SPECULATORS | COMMERCIALS | SMALL TRADERS |
| – Percent of Open Interest Longs: | 16.9 | 46.5 | 5.0 |
| – Percent of Open Interest Shorts: | 30.7 | 35.0 | 2.7 |
| – Net Position: | -28,018 | 23,413 | 4,605 |
| – Gross Longs: | 34,303 | 94,287 | 10,045 |
| – Gross Shorts: | 62,321 | 70,874 | 5,440 |
| – Long to Short Ratio: | 0.6 to 1 | 1.3 to 1 | 1.8 to 1 |
| NET POSITION TREND: | |||
| – COT Index Score (3 Year Range Pct): | 73.0 | 22.9 | 75.8 |
| – COT Index Reading (3 Year Range): | Bullish | Bearish | Bullish |
| NET POSITION MOVEMENT INDEX: | |||
| – 6-Week Change in Strength Index: | 10.0 | -14.9 | 23.2 |
Natural Gas Futures:
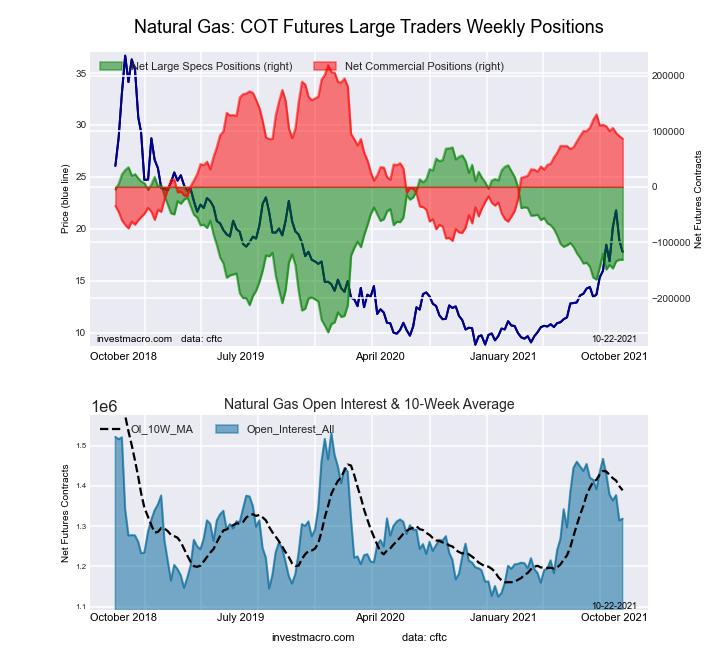 The Natural Gas Futures large speculator standing this week resulted in a net position of -131,070 contracts in the data reported through Tuesday. This was a weekly lowering of -168 contracts from the previous week which had a total of -130,902 net contracts.
This week’s current strength score (the trader positioning range over the past three years, measured from 0 to 100) shows the speculators are currently Bearish with a score of 39.2 percent. The commercials are Bullish with a score of 58.2 percent and the small traders (not shown in chart) are Bullish-Extreme with a score of 91.6 percent.
| Natural Gas Futures Statistics | SPECULATORS | COMMERCIALS | SMALL TRADERS |
| – Percent of Open Interest Longs: | 20.3 | 43.6 | 5.2 |
| – Percent of Open Interest Shorts: | 30.3 | 37.1 | 1.8 |
| – Net Position: | -131,070 | 86,574 | 44,496 |
| – Gross Longs: | 268,031 | 575,425 | 68,020 |
| – Gross Shorts: | 399,101 | 488,851 | 23,524 |
| – Long to Short Ratio: | 0.7 to 1 | 1.2 to 1 | 2.9 to 1 |
| NET POSITION TREND: | |||
| – COT Index Score (3 Year Range Pct): | 39.2 | 58.2 | 91.6 |
| – COT Index Reading (3 Year Range): | Bearish | Bullish | Bullish-Extreme |
| NET POSITION MOVEMENT INDEX: | |||
| – 6-Week Change in Strength Index: | -3.3 | -8.0 | 91.6 |
Gasoline Blendstock Futures:
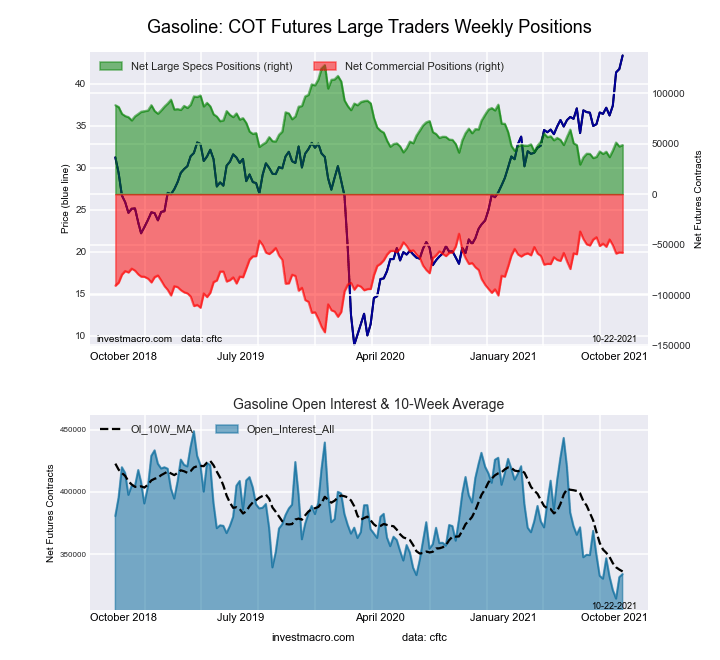 The Gasoline Blendstock Futures large speculator standing this week resulted in a net position of 48,642 contracts in the data reported through Tuesday. This was a weekly rise of 1,449 contracts from the previous week which had a total of 47,193 net contracts.
This week’s current strength score (the trader positioning range over the past three years, measured from 0 to 100) shows the speculators are currently Bearish-Extreme with a score of 19.6 percent. The commercials are Bullish with a score of 79.0 percent and the small traders (not shown in chart) are Bullish with a score of 67.6 percent.
| Nasdaq Mini Futures Statistics | SPECULATORS | COMMERCIALS | SMALL TRADERS |
| – Percent of Open Interest Longs: | 30.7 | 46.0 | 7.1 |
| – Percent of Open Interest Shorts: | 16.2 | 63.4 | 4.3 |
| – Net Position: | 48,642 | -58,021 | 9,379 |
| – Gross Longs: | 102,687 | 153,554 | 23,616 |
| – Gross Shorts: | 54,045 | 211,575 | 14,237 |
| – Long to Short Ratio: | 1.9 to 1 | 0.7 to 1 | 1.7 to 1 |
| NET POSITION TREND: | |||
| – COT Index Score (3 Year Range Pct): | 19.6 | 79.0 | 67.6 |
| – COT Index Reading (3 Year Range): | Bearish-Extreme | Bullish | Bullish |
| NET POSITION MOVEMENT INDEX: | |||
| – 6-Week Change in Strength Index: | 8.9 | -9.0 | 1.2 |
#2 Heating Oil NY-Harbor Futures:
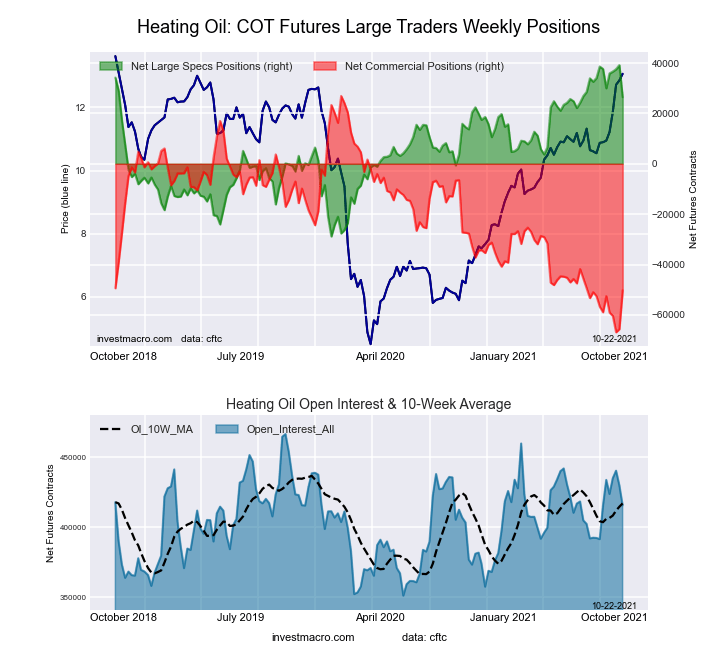 The #2 Heating Oil NY-Harbor Futures large speculator standing this week resulted in a net position of 26,441 contracts in the data reported through Tuesday. This was a weekly lowering of -12,696 contracts from the previous week which had a total of 39,137 net contracts.
This week’s current strength score (the trader positioning range over the past three years, measured from 0 to 100) shows the speculators are currently Bullish-Extreme with a score of 81.3 percent. The commercials are Bearish-Extreme with a score of 17.7 percent and the small traders (not shown in chart) are Bullish-Extreme with a score of 80.8 percent.
| Heating Oil Futures Statistics | SPECULATORS | COMMERCIALS | SMALL TRADERS |
| – Percent of Open Interest Longs: | 16.5 | 49.7 | 11.3 |
| – Percent of Open Interest Shorts: | 10.1 | 61.8 | 5.6 |
| – Net Position: | 26,441 | -50,250 | 23,809 |
| – Gross Longs: | 68,516 | 206,628 | 46,898 |
| – Gross Shorts: | 42,075 | 256,878 | 23,089 |
| – Long to Short Ratio: | 1.6 to 1 | 0.8 to 1 | 2.0 to 1 |
| NET POSITION TREND: | |||
| – COT Index Score (3 Year Range Pct): | 81.3 | 17.7 | 80.8 |
| – COT Index Reading (3 Year Range): | Bullish-Extreme | Bearish-Extreme | Bullish-Extreme |
| NET POSITION MOVEMENT INDEX: | |||
| – 6-Week Change in Strength Index: | -16.5 | 9.2 | 8.8 |
Bloomberg Commodity Index Futures:
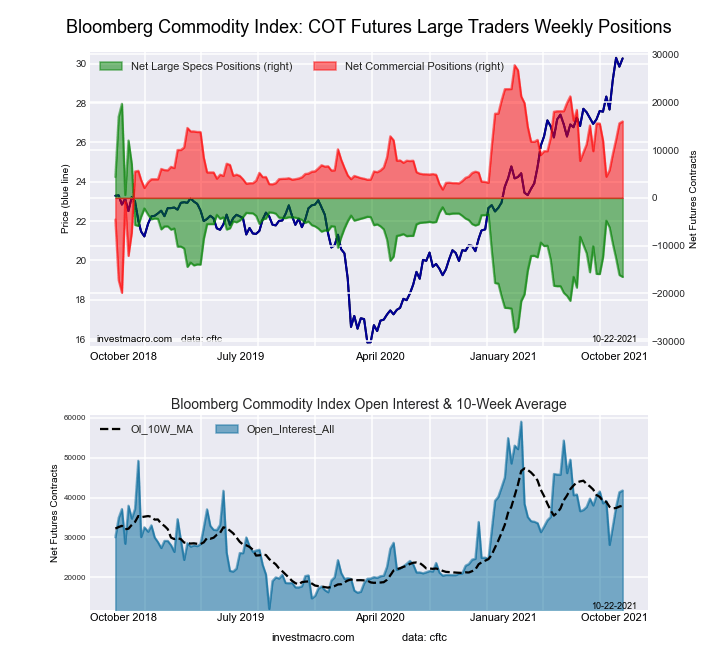 The Bloomberg Commodity Index Futures large speculator standing this week resulted in a net position of -16,527 contracts in the data reported through Tuesday. This was a weekly reduction of -410 contracts from the previous week which had a total of -16,117 net contracts.
This week’s current strength score (the trader positioning range over the past three years, measured from 0 to 100) shows the speculators are currently Bearish with a score of 24.2 percent. The commercials are Bullish with a score of 75.3 percent and the small traders (not shown in chart) are Bearish with a score of 47.8 percent.
| Bloomberg Index Futures Statistics | SPECULATORS | COMMERCIALS | SMALL TRADERS |
| – Percent of Open Interest Longs: | 51.5 | 43.1 | 1.4 |
| – Percent of Open Interest Shorts: | 91.0 | 4.8 | 0.1 |
| – Net Position: | -16,527 | 15,992 | 535 |
| – Gross Longs: | 21,506 | 18,008 | 593 |
| – Gross Shorts: | 38,033 | 2,016 | 58 |
| – Long to Short Ratio: | 0.6 to 1 | 8.9 to 1 | 10.2 to 1 |
| NET POSITION TREND: | |||
| – COT Index Score (3 Year Range Pct): | 24.2 | 75.3 | 47.8 |
| – COT Index Reading (3 Year Range): | Bearish | Bullish | Bearish |
| NET POSITION MOVEMENT INDEX: | |||
| – 6-Week Change in Strength Index: | -8.7 | 8.5 | 5.2 |
Article By InvestMacro.com – Receive our weekly COT Reports by Email
*COT Report: The COT data, released weekly to the public each Friday, is updated through the most recent Tuesday (data is 3 days old) and shows a quick view of how large speculators or non-commercials (for-profit traders) were positioned in the futures markets.
The CFTC categorizes trader positions according to commercial hedgers (traders who use futures contracts for hedging as part of the business), non-commercials (large traders who speculate to realize trading profits) and nonreportable traders (usually small traders/speculators).
Find CFTC criteria here: (http://www.cftc.gov/MarketReports/CommitmentsofTraders/ExplanatoryNotes/index.htm).

- Oil prices fall back to pre‑war levels. Silver drops to a 7‑month low Jun 25, 2026
- Gold Falls to an Eight-Month Low: This May Not Be the Bottom Jun 25, 2026
- Stock indices came under heavy selling pressure amid growing skepticism about AI investments Jun 24, 2026
- The Pound Is Pressured Not by Politics, but by a Strong US Dollar Jun 24, 2026
- Global crude oil prices continued to decline. The AUD/USD exchange rate hit an 11‑week low Jun 23, 2026
- EUR/USD Remains Under Sellers’ Control as the Dollar Stays Strong Jun 23, 2026
- Gold Falls for the Third Consecutive Week: Is There Still Upside Potential? Jun 22, 2026
- Bank Indonesia raised its interest rate. Norges Bank and the SNB left rates unchanged Jun 19, 2026
- EUR/USD Loses Ground as Market Sentiment Favours the US Dollar Jun 19, 2026
- GBPUSD Awaits Bank of England Meeting Near April Lows Jun 18, 2026