
Article By RoboForex.com
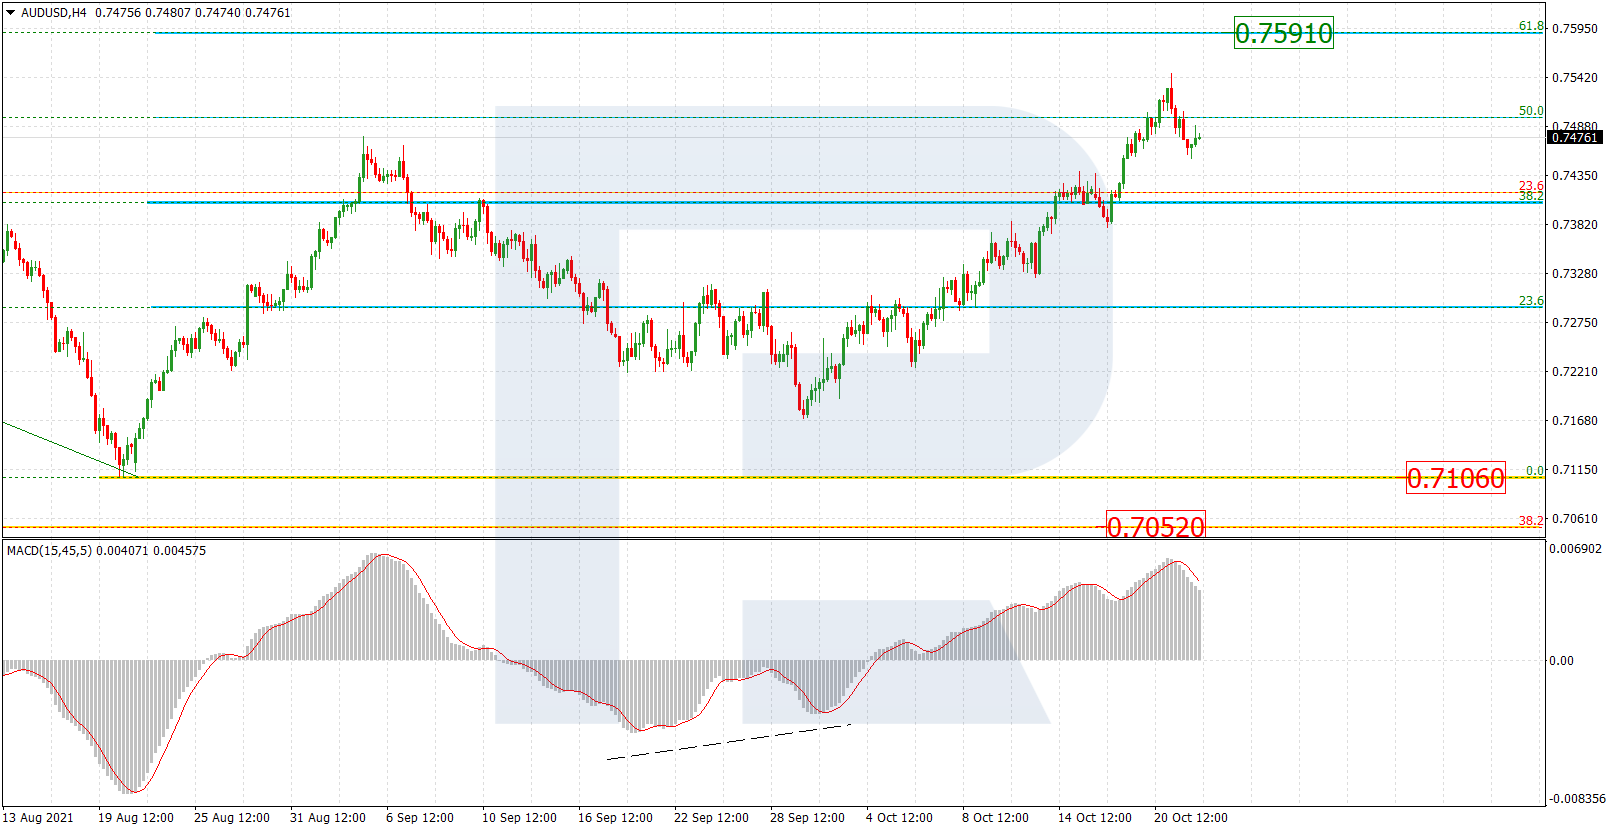
AUDUSD, “Australian Dollar vs US Dollar”
As we can see in the H4 chart, convergence on MACD made the pair start a new rising wave, which, after reaching 50.0% fibo, was followed by another pullback. After the pullback is over, the asset may resume growing to complete the correctional phase at 61.8% fibo (0.7591). Later, the market may reverse and start another decline towards the low and the mid-term 38.2% fibo at 0.7106 and 0.7052 respectively.

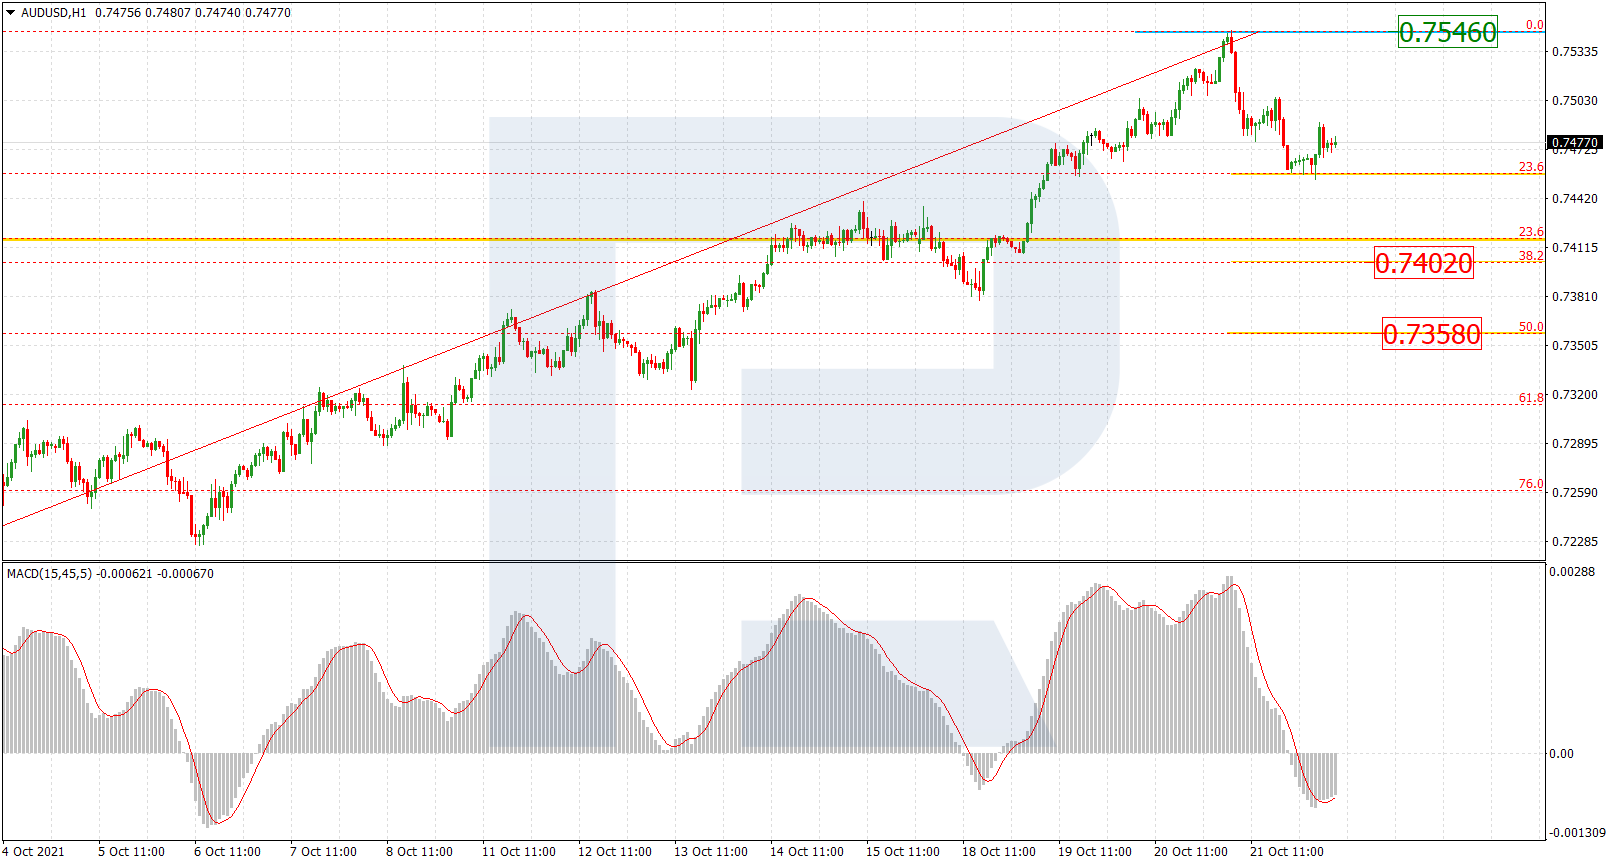
The H1 chart of AUDUSD shows that the start of a new correctional decline, which has already reached 23.6% fibo and may later continue towards 38.2% and 50.0% fibo at 0.7402 and 0.7358 respectively. A breakout of the local resistance at 0.7546 will complete the correction and lead to a further uptrend.
Free Reports:
 Get our Weekly Commitment of Traders Reports - See where the biggest traders (Hedge Funds and Commercial Hedgers) are positioned in the futures markets on a weekly basis.
 Sign Up for Our Stock Market Newsletter – Get updated on News, Charts & Rankings of Public Companies when you join our Stocks Newsletter
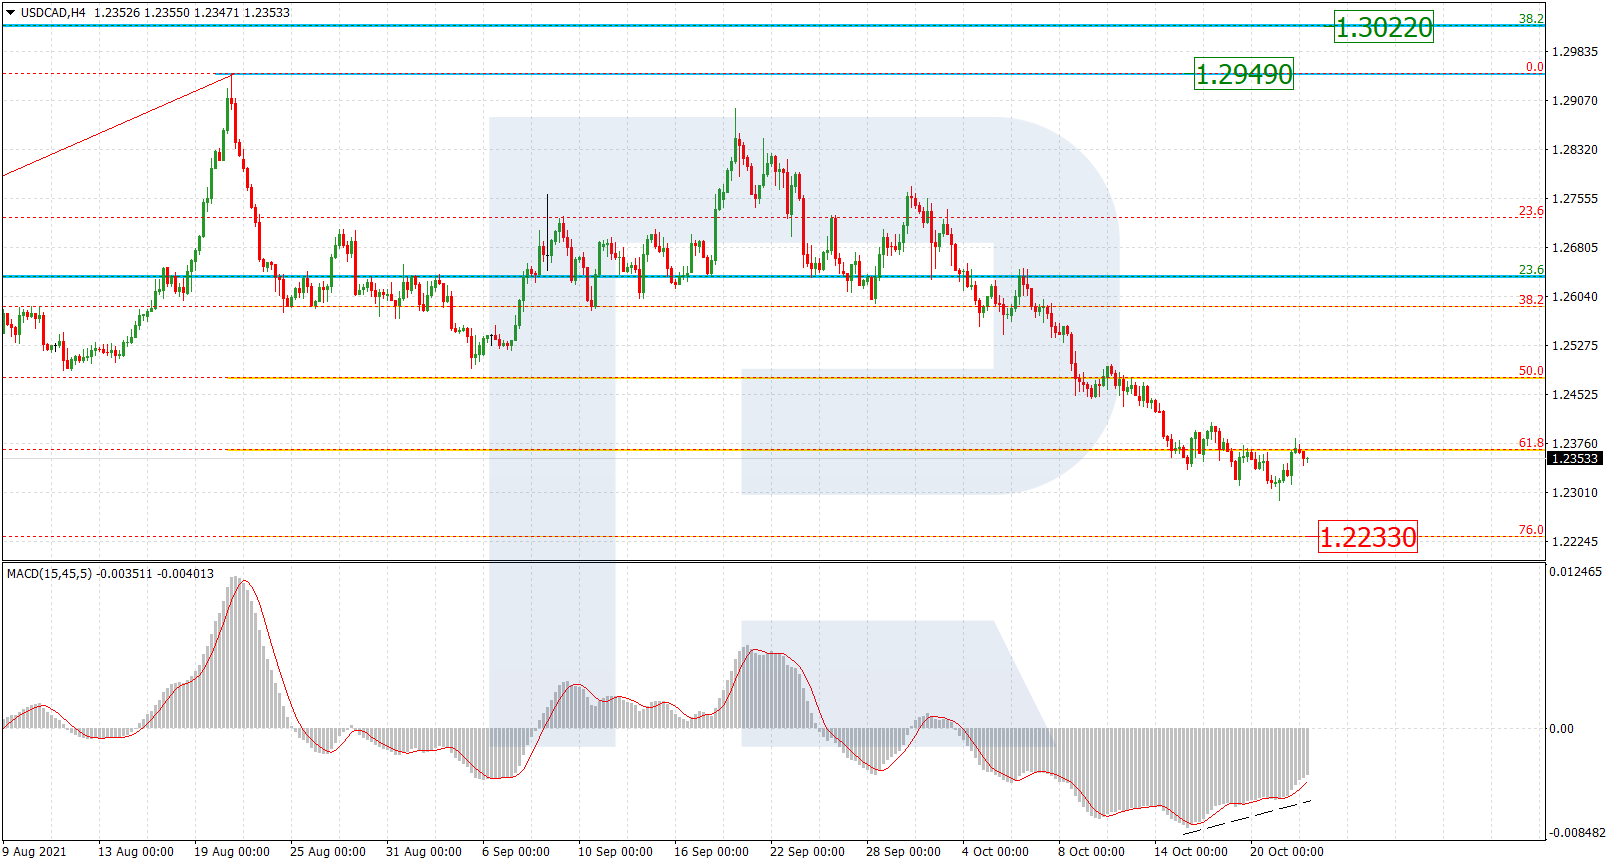
USDCAD, “US Dollar vs Canadian Dollar”
As we can see in the H4 chart, convergence on MACD made the pair stop falling at 61.8% fibo and start a new movement to the upside, which may be the start of another long-term rising wave to break the high at 1.2949 and reach 38.2% fibo at 1.3022. At the same time, an alternative scenario implies one more descending impulse towards 76.0% fibo at 1.2233.
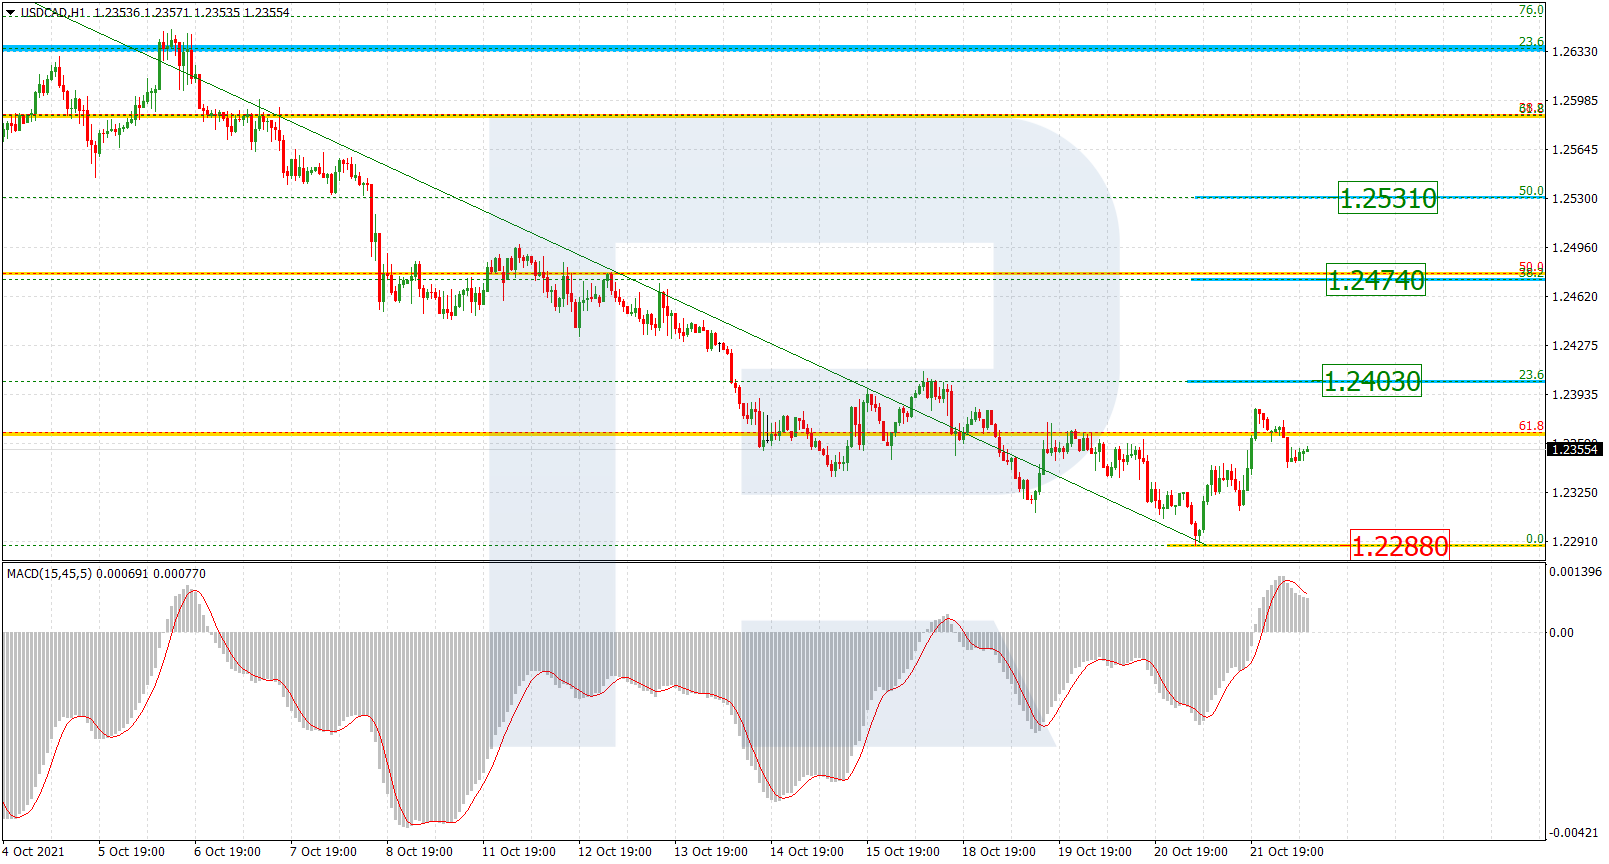
The H1 chart shows a more detailed structure of the current ascending movement after convergence on MACD. The closest upside targets are 23.6%, 38.2%, and 50.0% fibo at 1.2403, 1.2474, and 1.2531 respectively. The support is the low.
Article By RoboForex.com
Attention!
Forecasts presented in this section only reflect the author’s private opinion and should not be considered as guidance for trading. RoboForex LP bears no responsibility for trading results based on trading recommendations described in these analytical reviews.

- Oil prices fall back to pre‑war levels. Silver drops to a 7‑month low Jun 25, 2026
- Gold Falls to an Eight-Month Low: This May Not Be the Bottom Jun 25, 2026
- Stock indices came under heavy selling pressure amid growing skepticism about AI investments Jun 24, 2026
- The Pound Is Pressured Not by Politics, but by a Strong US Dollar Jun 24, 2026
- Global crude oil prices continued to decline. The AUD/USD exchange rate hit an 11‑week low Jun 23, 2026
- EUR/USD Remains Under Sellers’ Control as the Dollar Stays Strong Jun 23, 2026
- Gold Falls for the Third Consecutive Week: Is There Still Upside Potential? Jun 22, 2026
- Bank Indonesia raised its interest rate. Norges Bank and the SNB left rates unchanged Jun 19, 2026
- EUR/USD Loses Ground as Market Sentiment Favours the US Dollar Jun 19, 2026
- GBPUSD Awaits Bank of England Meeting Near April Lows Jun 18, 2026