
By CountingPips.com COT Home | Data Tables | Data Downloads | Newsletter
Here are the latest charts and statistics for the Commitment of Traders (COT) data published by the Commodities Futures Trading Commission (CFTC).
The latest COT data is updated through Tuesday June 29 2021 and shows a quick view of how large traders (for-profit speculators and commercial entities) were positioned in the futures markets.
Gold Comex Futures:
 The Gold Comex Futures large speculator standing this week resulted in a net position of 162,226 contracts in the data reported through Tuesday. This was a weekly decline of -3,988 contracts from the previous week which had a total of 166,214 net contracts.
This week’s current strength score (the trader positioning range over the past three years, measured from 0 to 100) shows the speculators are currently Bullish with a score of 51.1 percent. The commercials are Bearish with a score of 46.3 percent and the small traders (not shown in chart) are Bullish with a score of 63.4 percent.
| Gold Futures Statistics | SPECULATORS | COMMERCIALS | SMALL TRADERS |
| – Percent of Open Interest Longs: | 56.1 | 23.7 | 11.3 |
| – Percent of Open Interest Shorts: | 20.3 | 66.7 | 4.0 |
| – Net Position: | 162,226 | -195,120 | 32,894 |
| – Gross Longs: | 254,206 | 107,398 | 51,048 |
| – Gross Shorts: | 91,980 | 302,518 | 18,154 |
| – Long to Short Ratio: | 2.8 to 1 | 0.4 to 1 | 2.8 to 1 |
| NET POSITION TREND: | |||
| – COT Index Score (3 Year Range Pct): | 51.1 | 46.3 | 63.4 |
| – COT Index Reading (3 Year Range): | Bullish | Bearish | Bullish |
| NET POSITION MOVEMENT INDEX: | |||
| – 6-Week Change in Strength Index: | -9.4 | 9.2 | -2.7 |
Free Reports:
 Get our Weekly Commitment of Traders Reports - See where the biggest traders (Hedge Funds and Commercial Hedgers) are positioned in the futures markets on a weekly basis.
 Sign Up for Our Stock Market Newsletter – Get updated on News, Charts & Rankings of Public Companies when you join our Stocks Newsletter
Silver Comex Futures:
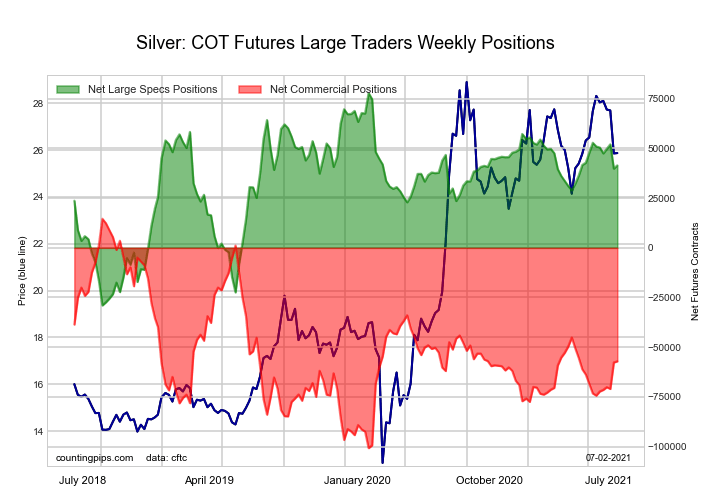 The Silver Comex Futures large speculator standing this week resulted in a net position of 41,477 contracts in the data reported through Tuesday. This was a weekly advance of 1,606 contracts from the previous week which had a total of 39,871 net contracts.
This week’s current strength score (the trader positioning range over the past three years, measured from 0 to 100) shows the speculators are currently Bullish with a score of 65.9 percent. The commercials are Bearish with a score of 37.8 percent and the small traders (not shown in chart) are Bearish with a score of 31.4 percent.
| Silver Futures Statistics | SPECULATORS | COMMERCIALS | SMALL TRADERS |
| – Percent of Open Interest Longs: | 45.7 | 30.7 | 16.6 |
| – Percent of Open Interest Shorts: | 19.3 | 67.1 | 6.7 |
| – Net Position: | 41,477 | -57,108 | 15,631 |
| – Gross Longs: | 71,855 | 48,274 | 26,084 |
| – Gross Shorts: | 30,378 | 105,382 | 10,453 |
| – Long to Short Ratio: | 2.4 to 1 | 0.5 to 1 | 2.5 to 1 |
| NET POSITION TREND: | |||
| – COT Index Score (3 Year Range Pct): | 65.9 | 37.8 | 31.4 |
| – COT Index Reading (3 Year Range): | Bullish | Bearish | Bearish |
| NET POSITION MOVEMENT INDEX: | |||
| – 6-Week Change in Strength Index: | -8.9 | 15.0 | -46.8 |
Copper Grade #1 Futures:
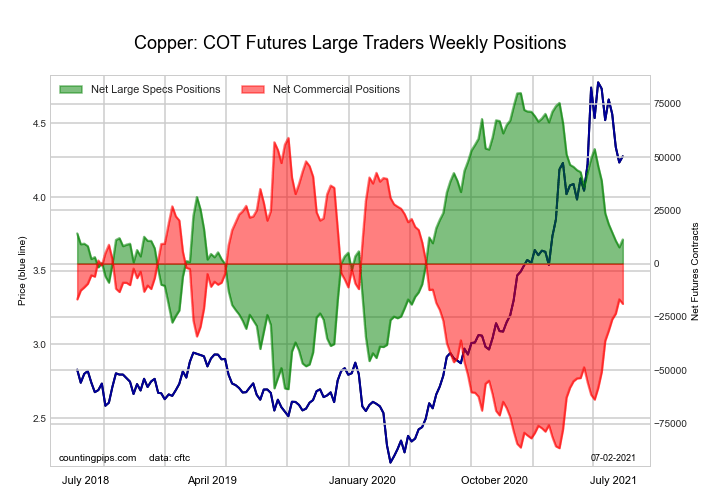 The Copper Grade #1 Futures large speculator standing this week resulted in a net position of 11,361 contracts in the data reported through Tuesday. This was a weekly rise of 3,675 contracts from the previous week which had a total of 7,686 net contracts.
This week’s current strength score (the trader positioning range over the past three years, measured from 0 to 100) shows the speculators are currently Bullish with a score of 50.5 percent. The commercials are Bearish with a score of 46.5 percent and the small traders (not shown in chart) are Bullish with a score of 68.5 percent.
| Copper Futures Statistics | SPECULATORS | COMMERCIALS | SMALL TRADERS |
| – Percent of Open Interest Longs: | 42.2 | 38.8 | 9.9 |
| – Percent of Open Interest Shorts: | 36.5 | 48.3 | 6.2 |
| – Net Position: | 11,361 | -18,841 | 7,480 |
| – Gross Longs: | 83,473 | 76,695 | 19,663 |
| – Gross Shorts: | 72,112 | 95,536 | 12,183 |
| – Long to Short Ratio: | 1.2 to 1 | 0.8 to 1 | 1.6 to 1 |
| NET POSITION TREND: | |||
| – COT Index Score (3 Year Range Pct): | 50.5 | 46.5 | 68.5 |
| – COT Index Reading (3 Year Range): | Bullish | Bearish | Bullish |
| NET POSITION MOVEMENT INDEX: | |||
| – 6-Week Change in Strength Index: | -19.9 | 22.0 | -25.3 |
Platinum Futures:
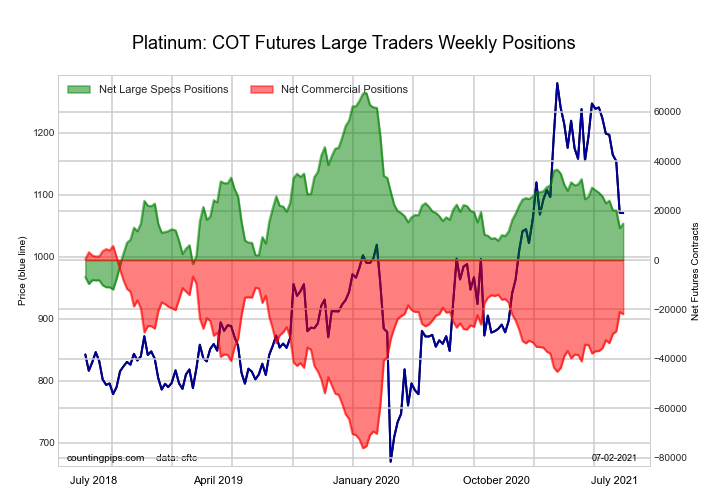 The Platinum Futures large speculator standing this week resulted in a net position of 14,744 contracts in the data reported through Tuesday. This was a weekly gain of 1,804 contracts from the previous week which had a total of 12,940 net contracts.
This week’s current strength score (the trader positioning range over the past three years, measured from 0 to 100) shows the speculators are currently Bearish with a score of 33.5 percent. The commercials are Bullish with a score of 66.3 percent and the small traders (not shown in chart) are Bullish with a score of 61.7 percent.
| Platinum Futures Statistics | SPECULATORS | COMMERCIALS | SMALL TRADERS |
| – Percent of Open Interest Longs: | 51.7 | 28.0 | 16.6 |
| – Percent of Open Interest Shorts: | 26.4 | 65.6 | 4.3 |
| – Net Position: | 14,744 | -21,889 | 7,145 |
| – Gross Longs: | 30,141 | 16,318 | 9,646 |
| – Gross Shorts: | 15,397 | 38,207 | 2,501 |
| – Long to Short Ratio: | 2.0 to 1 | 0.4 to 1 | 3.9 to 1 |
| NET POSITION TREND: | |||
| – COT Index Score (3 Year Range Pct): | 33.5 | 66.3 | 61.7 |
| – COT Index Reading (3 Year Range): | Bearish | Bullish | Bullish |
| NET POSITION MOVEMENT INDEX: | |||
| – 6-Week Change in Strength Index: | -13.9 | 16.9 | -38.3 |
Palladium Futures:
 The Palladium Futures large speculator standing this week resulted in a net position of 1,408 contracts in the data reported through Tuesday. This was a weekly increase of 336 contracts from the previous week which had a total of 1,072 net contracts.
This week’s current strength score (the trader positioning range over the past three years, measured from 0 to 100) shows the speculators are currently Bearish-Extreme with a score of 7.6 percent. The commercials are Bullish-Extreme with a score of 88.3 percent and the small traders (not shown in chart) are Bullish with a score of 77.9 percent.
| Palladium Futures Statistics | SPECULATORS | COMMERCIALS | SMALL TRADERS |
| – Percent of Open Interest Longs: | 48.7 | 33.4 | 15.5 |
| – Percent of Open Interest Shorts: | 33.4 | 54.8 | 9.4 |
| – Net Position: | 1,408 | -1,969 | 561 |
| – Gross Longs: | 4,474 | 3,073 | 1,422 |
| – Gross Shorts: | 3,066 | 5,042 | 861 |
| – Long to Short Ratio: | 1.5 to 1 | 0.6 to 1 | 1.7 to 1 |
| NET POSITION TREND: | |||
| – COT Index Score (3 Year Range Pct): | 7.6 | 88.3 | 77.9 |
| – COT Index Reading (3 Year Range): | Bearish-Extreme | Bullish-Extreme | Bullish |
| NET POSITION MOVEMENT INDEX: | |||
| – 6-Week Change in Strength Index: | -7.7 | 8.1 | -5.1 |
Article By CountingPips.com – Receive our weekly COT Reports by Email
*COT Report: The COT data, released weekly to the public each Friday, is updated through the most recent Tuesday (data is 3 days old) and shows a quick view of how large speculators or non-commercials (for-profit traders) were positioned in the futures markets.
The CFTC categorizes trader positions according to commercial hedgers (traders who use futures contracts for hedging as part of the business), non-commercials (large traders who speculate to realize trading profits) and nonreportable traders (usually small traders/speculators).
Find CFTC criteria here: (http://www.cftc.gov/MarketReports/CommitmentsofTraders/ExplanatoryNotes/index.htm).

- The United States and Iran have signed a peace agreement – oil has fallen to 80 dollars per barrel. Jun 15, 2026
- COT Metals Charts: Speculator Bets led by Steel Jun 14, 2026
- COT Bonds Charts: Speculator Bets led by 2-Year Bonds & Ultra 10-Year Bonds Jun 14, 2026
- COT Energy Charts: Speculator Bets led by Brent Oil Jun 14, 2026
- COT Soft Commodities Charts: Weekly Speculator Bets led lower by Corn and Soybean Meal Jun 14, 2026
- Today investors’ focus is directed at the historic IPO of SpaceX Jun 12, 2026
- USD/JPY Continues Its Climb: Is There a Limit? Jun 11, 2026
- Investors launched broad profit‑taking in the technology sector. The Bank of Canada kept its rate at 2.25% Jun 11, 2026
- Gold (XAU/USD) Faces Persistent Selling Pressure Jun 10, 2026
- The US technology sector once again came under a wave of selling Jun 10, 2026