
By CountingPips.com COT Home | Data Tables | Data Downloads | Newsletter
Here are the latest charts and statistics for the Commitment of Traders (COT) data published by the Commodities Futures Trading Commission (CFTC).
The latest COT data is updated through Tuesday June 29 2021 and shows a quick view of how large traders (for-profit speculators and commercial entities) were positioned in the futures markets.
3-Month Eurodollars Futures:
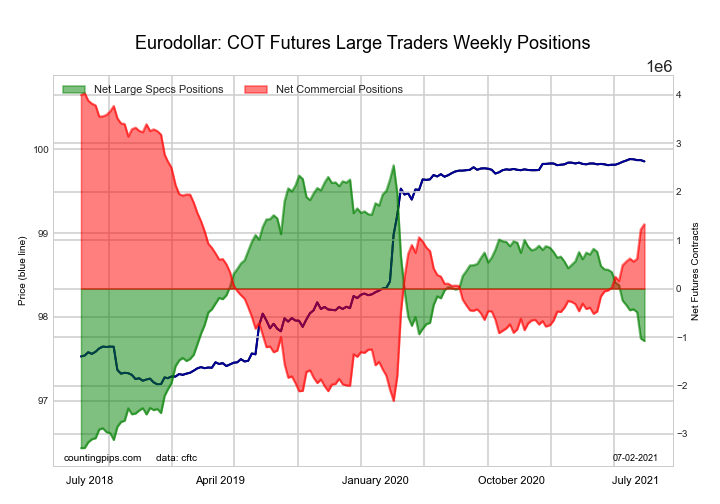 The 3-Month Eurodollars large speculator standing this week reached a net position of -1,080,594 contracts in the data reported through Tuesday. This was a weekly lowering of -52,897 contracts from the previous week which had a total of -1,027,697 net contracts.
This week’s current strength score (the trader positioning range over the past three years, measured from 0 to 100) shows the speculators are currently Bearish with a score of 37.9 percent. The commercials are Bullish with a score of 57.4 percent and the small traders (not shown in chart) are Bullish with a score of 70.8 percent.
| 3-Month Eurodollars Statistics | SPECULATORS | COMMERCIALS | SMALL TRADERS |
| – Percent of Open Interest Longs: | 13.8 | 60.2 | 4.8 |
| – Percent of Open Interest Shorts: | 22.6 | 49.3 | 6.9 |
| – Net Position: | -1,080,594 | 1,326,857 | -246,263 |
| – Gross Longs: | 1,682,162 | 7,338,321 | 591,597 |
| – Gross Shorts: | 2,762,756 | 6,011,464 | 837,860 |
| – Long to Short Ratio: | 0.6 to 1 | 1.2 to 1 | 0.7 to 1 |
| NET POSITION TREND: | |||
| – COT Index Score (3 Year Range Pct): | 37.9 | 57.4 | 70.8 |
| – COT Index Reading (3 Year Range): | Bearish | Bullish | Bullish |
| NET POSITION MOVEMENT INDEX: | |||
| – 6-Week Change in Strength Index: | -14.3 | 13.3 | -1.4 |
Free Reports:
 Get our Weekly Commitment of Traders Reports - See where the biggest traders (Hedge Funds and Commercial Hedgers) are positioned in the futures markets on a weekly basis.
 Download Our Metatrader 4 Indicators – Put Our Free MetaTrader 4 Custom Indicators on your charts when you join our Weekly Newsletter
30-Day Federal Funds Futures:
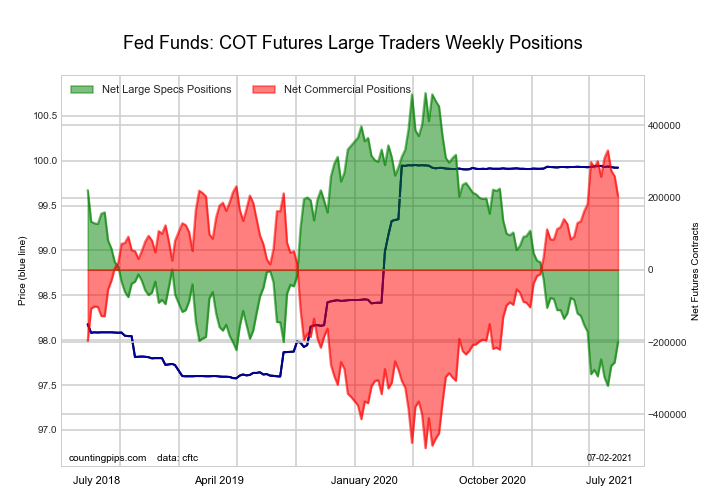 The 30-Day Federal Funds large speculator standing this week reached a net position of -200,030 contracts in the data reported through Tuesday. This was a weekly gain of 56,278 contracts from the previous week which had a total of -256,308 net contracts.
This week’s current strength score (the trader positioning range over the past three years, measured from 0 to 100) shows the speculators are currently Bearish-Extreme with a score of 14.9 percent. The commercials are Bullish-Extreme with a score of 84.7 percent and the small traders (not shown in chart) are Bullish with a score of 63.7 percent.
| 30-Day Federal Funds Statistics | SPECULATORS | COMMERCIALS | SMALL TRADERS |
| – Percent of Open Interest Longs: | 3.3 | 77.8 | 2.4 |
| – Percent of Open Interest Shorts: | 21.8 | 58.9 | 2.8 |
| – Net Position: | -200,030 | 204,108 | -4,078 |
| – Gross Longs: | 35,137 | 841,077 | 25,885 |
| – Gross Shorts: | 235,167 | 636,969 | 29,963 |
| – Long to Short Ratio: | 0.1 to 1 | 1.3 to 1 | 0.9 to 1 |
| NET POSITION TREND: | |||
| – COT Index Score (3 Year Range Pct): | 14.9 | 84.7 | 63.7 |
| – COT Index Reading (3 Year Range): | Bearish-Extreme | Bullish-Extreme | Bullish |
| NET POSITION MOVEMENT INDEX: | |||
| – 6-Week Change in Strength Index: | 11.7 | -11.7 | 3.1 |
2-Year Treasury Note Futures:
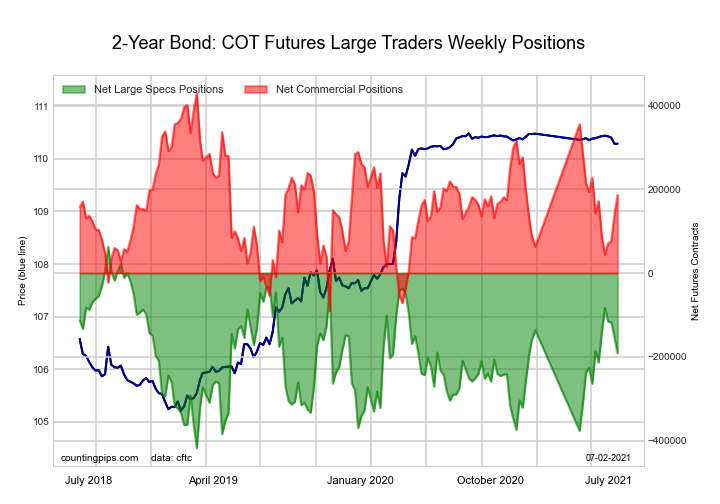 The 2-Year Treasury Note large speculator standing this week reached a net position of -191,256 contracts in the data reported through Tuesday. This was a weekly decline of -38,349 contracts from the previous week which had a total of -152,907 net contracts.
This week’s current strength score (the trader positioning range over the past three years, measured from 0 to 100) shows the speculators are currently Bullish with a score of 54.2 percent. The commercials are Bullish with a score of 53.3 percent and the small traders (not shown in chart) are Bearish with a score of 37.4 percent.
| 2-Year Treasury Note Statistics | SPECULATORS | COMMERCIALS | SMALL TRADERS |
| – Percent of Open Interest Longs: | 16.3 | 73.6 | 6.8 |
| – Percent of Open Interest Shorts: | 25.6 | 64.6 | 6.5 |
| – Net Position: | -191,256 | 186,384 | 4,872 |
| – Gross Longs: | 333,549 | 1,509,829 | 139,126 |
| – Gross Shorts: | 524,805 | 1,323,445 | 134,254 |
| – Long to Short Ratio: | 0.6 to 1 | 1.1 to 1 | 1.0 to 1 |
| NET POSITION TREND: | |||
| – COT Index Score (3 Year Range Pct): | 54.2 | 53.3 | 37.4 |
| – COT Index Reading (3 Year Range): | Bullish | Bullish | Bearish |
| NET POSITION MOVEMENT INDEX: | |||
| – 6-Week Change in Strength Index: | 5.2 | 2.8 | -19.2 |
5-Year Treasury Note Futures:
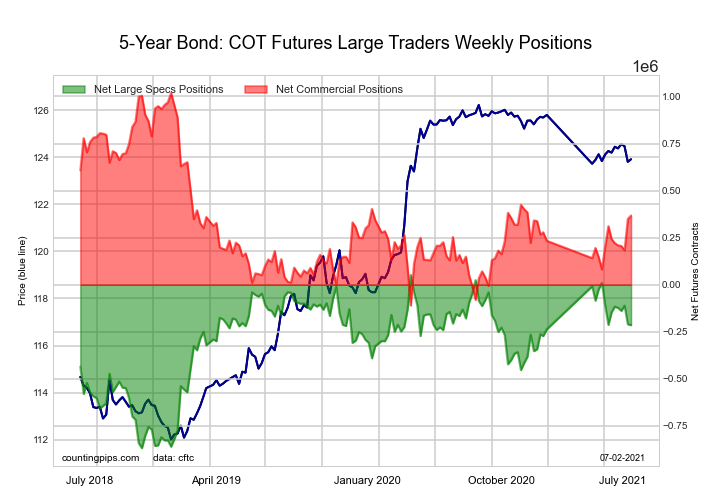 The 5-Year Treasury Note large speculator standing this week reached a net position of -214,355 contracts in the data reported through Tuesday. This was a weekly decrease of -4,829 contracts from the previous week which had a total of -209,526 net contracts.
This week’s current strength score (the trader positioning range over the past three years, measured from 0 to 100) shows the speculators are currently Bullish with a score of 67.8 percent. The commercials are Bearish with a score of 42.4 percent and the small traders (not shown in chart) are Bearish-Extreme with a score of 2.1 percent.
| 5-Year Treasury Note Statistics | SPECULATORS | COMMERCIALS | SMALL TRADERS |
| – Percent of Open Interest Longs: | 10.8 | 79.9 | 8.0 |
| – Percent of Open Interest Shorts: | 16.8 | 69.5 | 12.3 |
| – Net Position: | -214,355 | 367,839 | -153,484 |
| – Gross Longs: | 381,895 | 2,830,899 | 282,501 |
| – Gross Shorts: | 596,250 | 2,463,060 | 435,985 |
| – Long to Short Ratio: | 0.6 to 1 | 1.1 to 1 | 0.6 to 1 |
| NET POSITION TREND: | |||
| – COT Index Score (3 Year Range Pct): | 67.8 | 42.4 | 2.1 |
| – COT Index Reading (3 Year Range): | Bullish | Bearish | Bearish-Extreme |
| NET POSITION MOVEMENT INDEX: | |||
| – 6-Week Change in Strength Index: | -7.2 | 11.2 | -25.0 |
10-Year Treasury Note Futures:
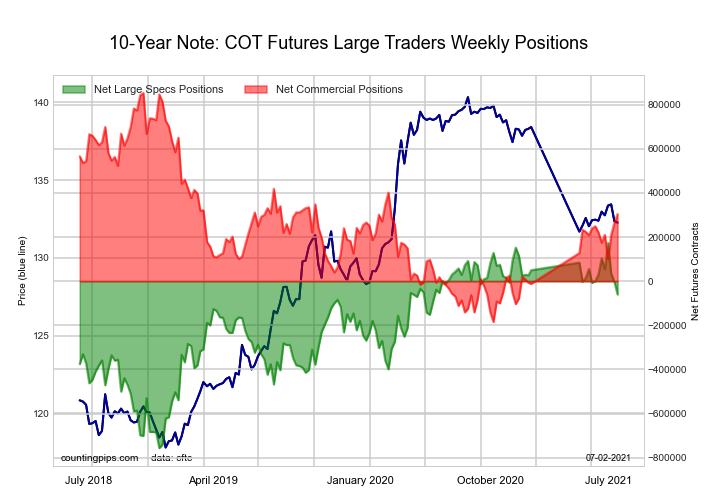 The 10-Year Treasury Note large speculator standing this week reached a net position of -59,960 contracts in the data reported through Tuesday. This was a weekly fall of -57,648 contracts from the previous week which had a total of -2,312 net contracts.
This week’s current strength score (the trader positioning range over the past three years, measured from 0 to 100) shows the speculators are currently Bullish with a score of 74.9 percent. The commercials are Bearish with a score of 47.1 percent and the small traders (not shown in chart) are Bearish-Extreme with a score of 9.4 percent.
| 10-Year Treasury Note Statistics | SPECULATORS | COMMERCIALS | SMALL TRADERS |
| – Percent of Open Interest Longs: | 20.8 | 69.7 | 7.4 |
| – Percent of Open Interest Shorts: | 22.2 | 62.6 | 13.1 |
| – Net Position: | -59,960 | 304,490 | -244,530 |
| – Gross Longs: | 894,366 | 2,995,077 | 317,867 |
| – Gross Shorts: | 954,326 | 2,690,587 | 562,397 |
| – Long to Short Ratio: | 0.9 to 1 | 1.1 to 1 | 0.6 to 1 |
| NET POSITION TREND: | |||
| – COT Index Score (3 Year Range Pct): | 74.9 | 47.1 | 9.4 |
| – COT Index Reading (3 Year Range): | Bullish | Bearish | Bearish-Extreme |
| NET POSITION MOVEMENT INDEX: | |||
| – 6-Week Change in Strength Index: | -9.9 | 8.1 | 2.1 |
Ultra 10-Year Notes Futures:
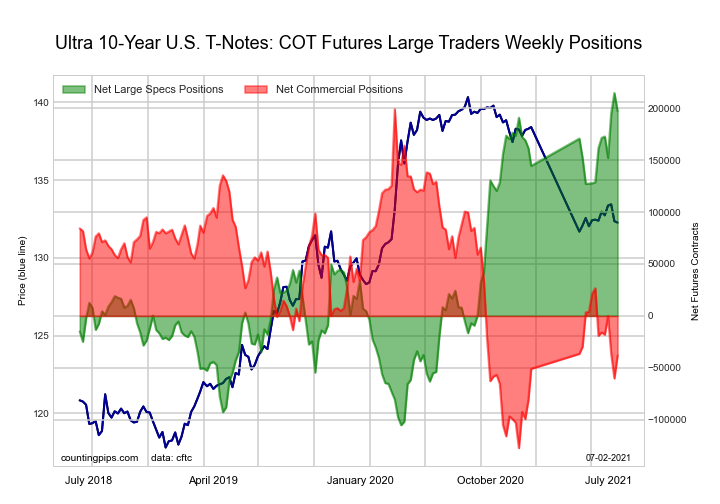 The Ultra 10-Year Notes large speculator standing this week reached a net position of 196,983 contracts in the data reported through Tuesday. This was a weekly reduction of -17,478 contracts from the previous week which had a total of 214,461 net contracts.
This week’s current strength score (the trader positioning range over the past three years, measured from 0 to 100) shows the speculators are currently Bullish with a score of 79.8 percent. The commercials are Bearish with a score of 33.6 percent and the small traders (not shown in chart) are Bearish-Extreme with a score of 0.0 percent.
| Ultra 10-Year Notes Statistics | SPECULATORS | COMMERCIALS | SMALL TRADERS |
| – Percent of Open Interest Longs: | 18.6 | 73.8 | 7.3 |
| – Percent of Open Interest Shorts: | 5.8 | 76.2 | 17.6 |
| – Net Position: | 196,983 | -38,027 | -158,956 |
| – Gross Longs: | 287,070 | 1,137,481 | 112,476 |
| – Gross Shorts: | 90,087 | 1,175,508 | 271,432 |
| – Long to Short Ratio: | 3.2 to 1 | 1.0 to 1 | 0.4 to 1 |
| NET POSITION TREND: | |||
| – COT Index Score (3 Year Range Pct): | 79.8 | 33.6 | 0.0 |
| – COT Index Reading (3 Year Range): | Bullish | Bearish | Bearish-Extreme |
| NET POSITION MOVEMENT INDEX: | |||
| – 6-Week Change in Strength Index: | 9.4 | -5.3 | -12.4 |
US Treasury Bonds Futures:
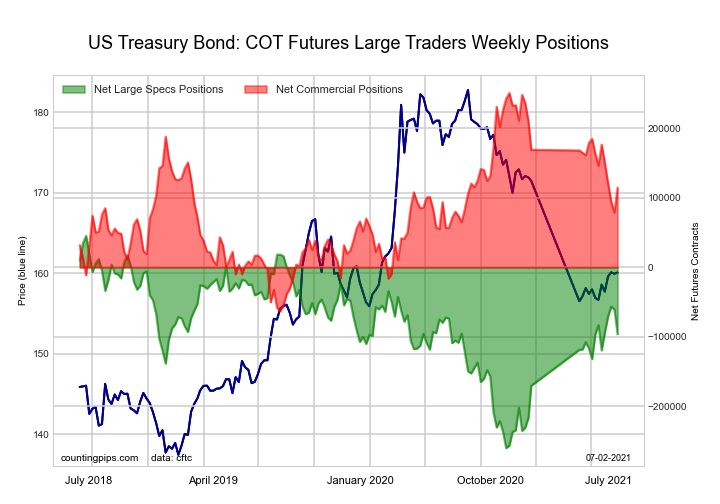 The US Treasury Bonds large speculator standing this week reached a net position of -95,979 contracts in the data reported through Tuesday. This was a weekly lowering of -35,625 contracts from the previous week which had a total of -60,354 net contracts.
This week’s current strength score (the trader positioning range over the past three years, measured from 0 to 100) shows the speculators are currently Bullish with a score of 58.9 percent. The commercials are Bullish with a score of 56.7 percent and the small traders (not shown in chart) are Bearish with a score of 37.7 percent.
| US Treasury Bonds Statistics | SPECULATORS | COMMERCIALS | SMALL TRADERS |
| – Percent of Open Interest Longs: | 8.3 | 75.3 | 14.2 |
| – Percent of Open Interest Shorts: | 16.5 | 65.5 | 15.8 |
| – Net Position: | -95,979 | 114,721 | -18,742 |
| – Gross Longs: | 97,575 | 882,839 | 166,055 |
| – Gross Shorts: | 193,554 | 768,118 | 184,797 |
| – Long to Short Ratio: | 0.5 to 1 | 1.1 to 1 | 0.9 to 1 |
| NET POSITION TREND: | |||
| – COT Index Score (3 Year Range Pct): | 58.9 | 56.7 | 37.7 |
| – COT Index Reading (3 Year Range): | Bullish | Bullish | Bearish |
| NET POSITION MOVEMENT INDEX: | |||
| – 6-Week Change in Strength Index: | -4.7 | -10.1 | 35.4 |
Ultra US Treasury Bonds Futures:
 The Ultra US Treasury Bonds large speculator standing this week reached a net position of -216,389 contracts in the data reported through Tuesday. This was a weekly rise of 12,560 contracts from the previous week which had a total of -228,949 net contracts.
This week’s current strength score (the trader positioning range over the past three years, measured from 0 to 100) shows the speculators are currently Bullish-Extreme with a score of 90.3 percent. The commercials are Bearish with a score of 30.5 percent and the small traders (not shown in chart) are Bearish with a score of 26.1 percent.
| Ultra US Treasury Bonds Statistics | SPECULATORS | COMMERCIALS | SMALL TRADERS |
| – Percent of Open Interest Longs: | 9.7 | 78.1 | 11.9 |
| – Percent of Open Interest Shorts: | 27.8 | 59.7 | 12.1 |
| – Net Position: | -216,389 | 219,440 | -3,051 |
| – Gross Longs: | 115,318 | 930,737 | 141,306 |
| – Gross Shorts: | 331,707 | 711,297 | 144,357 |
| – Long to Short Ratio: | 0.3 to 1 | 1.3 to 1 | 1.0 to 1 |
| NET POSITION TREND: | |||
| – COT Index Score (3 Year Range Pct): | 90.3 | 30.5 | 26.1 |
| – COT Index Reading (3 Year Range): | Bullish-Extreme | Bearish | Bearish |
| NET POSITION MOVEMENT INDEX: | |||
| – 6-Week Change in Strength Index: | 8.9 | -23.4 | 21.4 |
Article By CountingPips.com – Receive our weekly COT Reports by Email
*COT Report: The COT data, released weekly to the public each Friday, is updated through the most recent Tuesday (data is 3 days old) and shows a quick view of how large speculators or non-commercials (for-profit traders) were positioned in the futures markets.
The CFTC categorizes trader positions according to commercial hedgers (traders who use futures contracts for hedging as part of the business), non-commercials (large traders who speculate to realize trading profits) and nonreportable traders (usually small traders/speculators).
Find CFTC criteria here: (http://www.cftc.gov/MarketReports/CommitmentsofTraders/ExplanatoryNotes/index.htm).

- The US Tech sector hit by sell‑off. Oil prices decline on renewed negotiations Jul 28, 2026
- Gold Declines, Focus on Fed and Falling Oil Prices Jul 28, 2026
- This week will be one of the most crowded for central‑bank meetings Jul 27, 2026
- EUR/USD Ahead of a Key Week: Holding Near Lows Jul 27, 2026
- COT Metals Charts: Weekly Speculator Changes led by Copper Jul 26, 2026
- COT Bonds Charts: Speculator Bets led by SOFR 3-Months & 5-Year Bonds Jul 26, 2026
- COT Energy Charts: Weekly Speculator Bets led by WTI Crude & Natural Gas Jul 26, 2026
- COT Soft Commodities Charts: Weekly Speculator Bets led by Corn & Soybeans Jul 26, 2026
- The US introduces new import tariffs for 60 countries. Brent crude surpasses $100 per barrel Jul 24, 2026
- USD/JPY Breaks Records: Nothing Slows the Yen’s Decline Jul 24, 2026