
Article By RoboForex.com
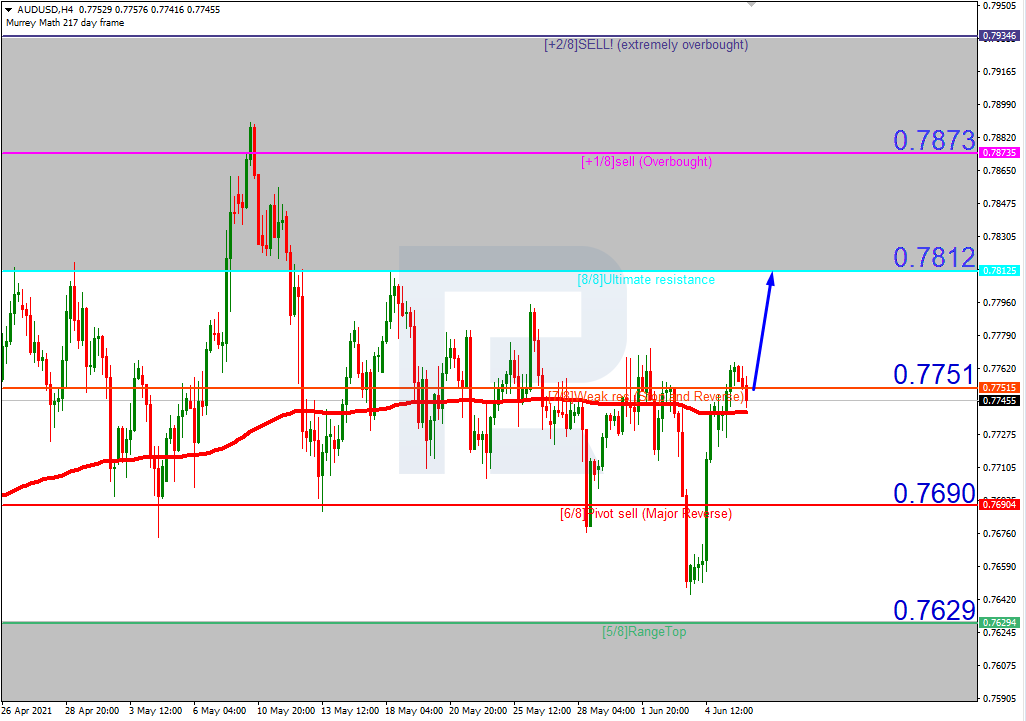
AUDUSD, “Australian Dollar vs US Dollar”
In the H4 chart, after breaking the 200-day Moving Average, AUDUSD is trading above it to indicate a possible ascending tendency. In this case, the price is expected to break 7/8 and then continue moving upwards to reach the resistance at 8/8. However, this scenario may be canceled if the price breaks 6/8 to the downside. After that, the instrument may continue falling towards the support at 5/8.

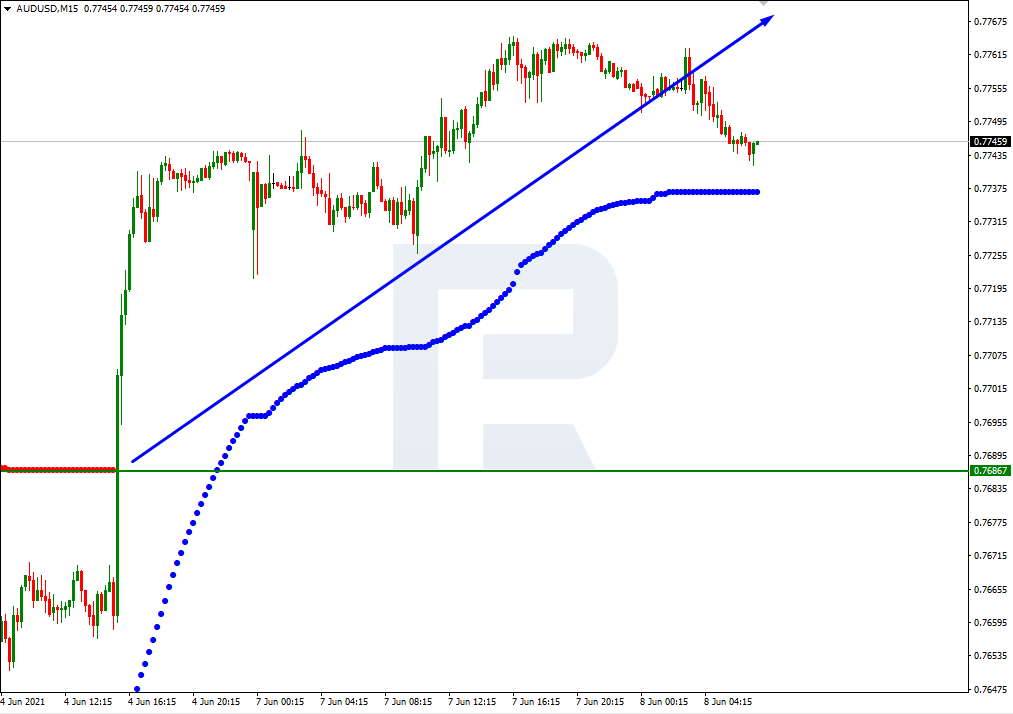
As we can see in the M15 chart, the pair has broken the upside line of the VoltyChannel indicator and, as a result, may continue trading upwards.
Free Reports:
 Get our Weekly Commitment of Traders Reports - See where the biggest traders (Hedge Funds and Commercial Hedgers) are positioned in the futures markets on a weekly basis.
 Download Our Metatrader 4 Indicators – Put Our Free MetaTrader 4 Custom Indicators on your charts when you join our Weekly Newsletter
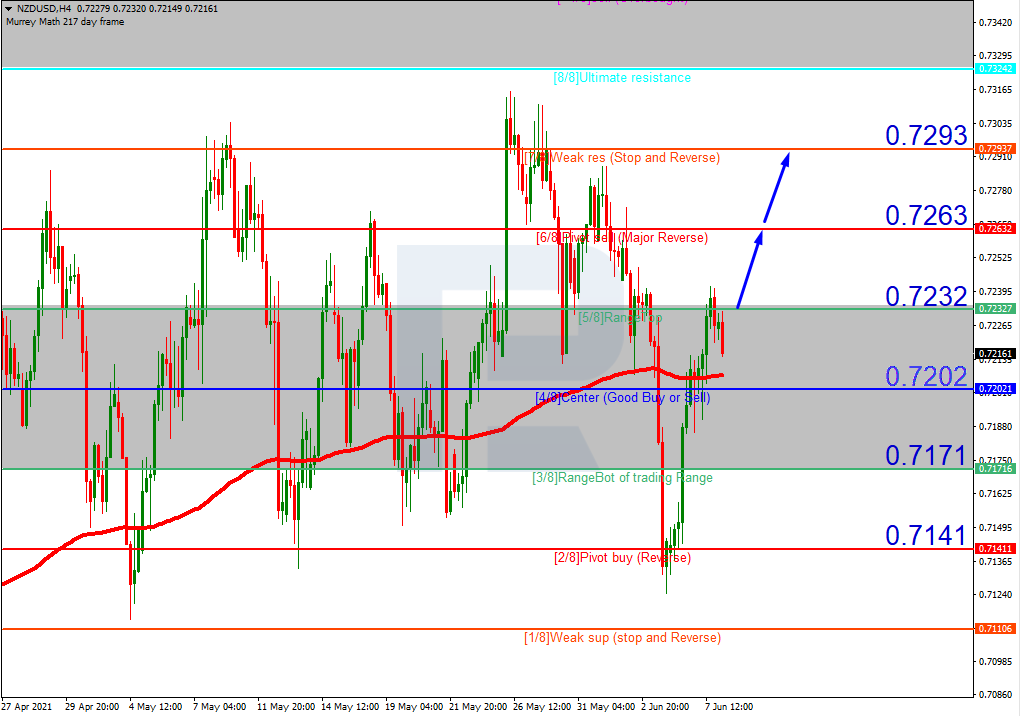
NZDUSD, “New Zealand Dollar vs US Dollar”
In the H4 chart, NZDUSD is trading above the 200-day Moving Average to indicate an ascending tendency. In this case, the price is expected to test 5/8, break it, and then continue growing to reach the resistance at 7/8. However, this scenario may no longer be valid if the price breaks 4/8 to the downside. In this case, the instrument may reverse and fall towards the support at 2/8.
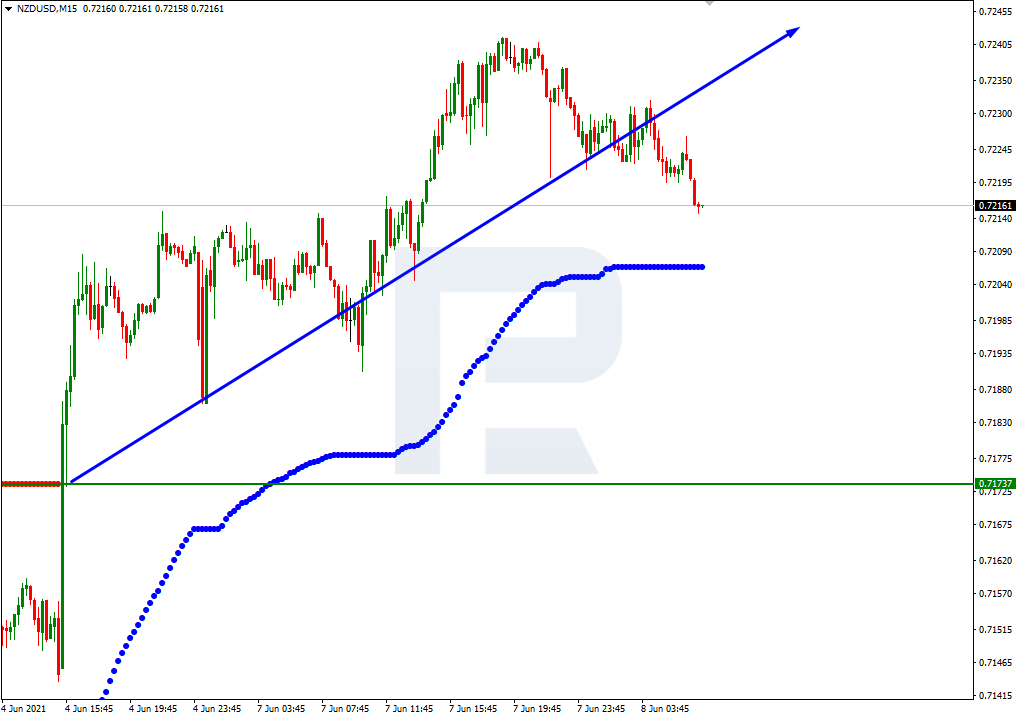
As we can see in the M15 chart, the pair has broken the upside line of the VoltyChannel indicator and, as a result, may continue its growth to reach 7/8 from the H4 chart.
Article By RoboForex.com
Attention!
Forecasts presented in this section only reflect the author’s private opinion and should not be considered as guidance for trading. RoboForex LP bears no responsibility for trading results based on trading recommendations described in these analytical reviews.

- GBPUSD Awaits Bank of England Meeting Near April Lows Jun 18, 2026
- Markets disliked the results of the FOMC meeting. HKMA followed the Fed and kept its rate unchanged. Jun 18, 2026
- Gold Surges 2% Since Week Opening Amid Geopolitical Shifts and Fed Expectations Jun 17, 2026
- Your Bourse and FXPRIMUS Bring 24/7 Synthetic Indices to the Global Broker Market Jun 16, 2026
- Institutional investors continue to reduce their presence in metals Jun 16, 2026
- USDJPY Driven by Emotions: Bank of Japan Raises Rate to Highest Level Since 1995 Jun 16, 2026
- The United States and Iran have signed a peace agreement – oil has fallen to 80 dollars per barrel. Jun 15, 2026
- EURUSD Ahead of the New Week: Expecting High Volatility Jun 15, 2026
- COT Metals Charts: Speculator Bets led by Steel Jun 14, 2026
- COT Bonds Charts: Speculator Bets led by 2-Year Bonds & Ultra 10-Year Bonds Jun 14, 2026