
By Dmitriy Gurkovskiy, Chief Analyst at RoboForex
On Monday, May 17th, the major currency pair reached stability after skyrocketing earlier and is currently trading at 1.2130.
The American statistics published last Friday were mostly disappointing and couldn’t help the “greenback”. For example, the Retail Sales in the USA showed a zero change in April after adding 10.7% m/m (a revised data) in the previous month and against the expected reading of 1.0% m/m. however, it’s quite logical because in March consumers received stimulus checks from the government, which immediately went right back into the country’s economy – it was an excellent although one-off tool to support the economic system.
In May or June, the Retail Sales may show another revival after the USA starts opening its borders and remove social restrictions. It will help Americans to spend more money.
The Industrial Production added 0.7% m/m in April after expanding by 2.4% m/m the month before. The Capacity Utilization Rate also improved. Both these reports managed to “smooth” the retail sales number a little bit.
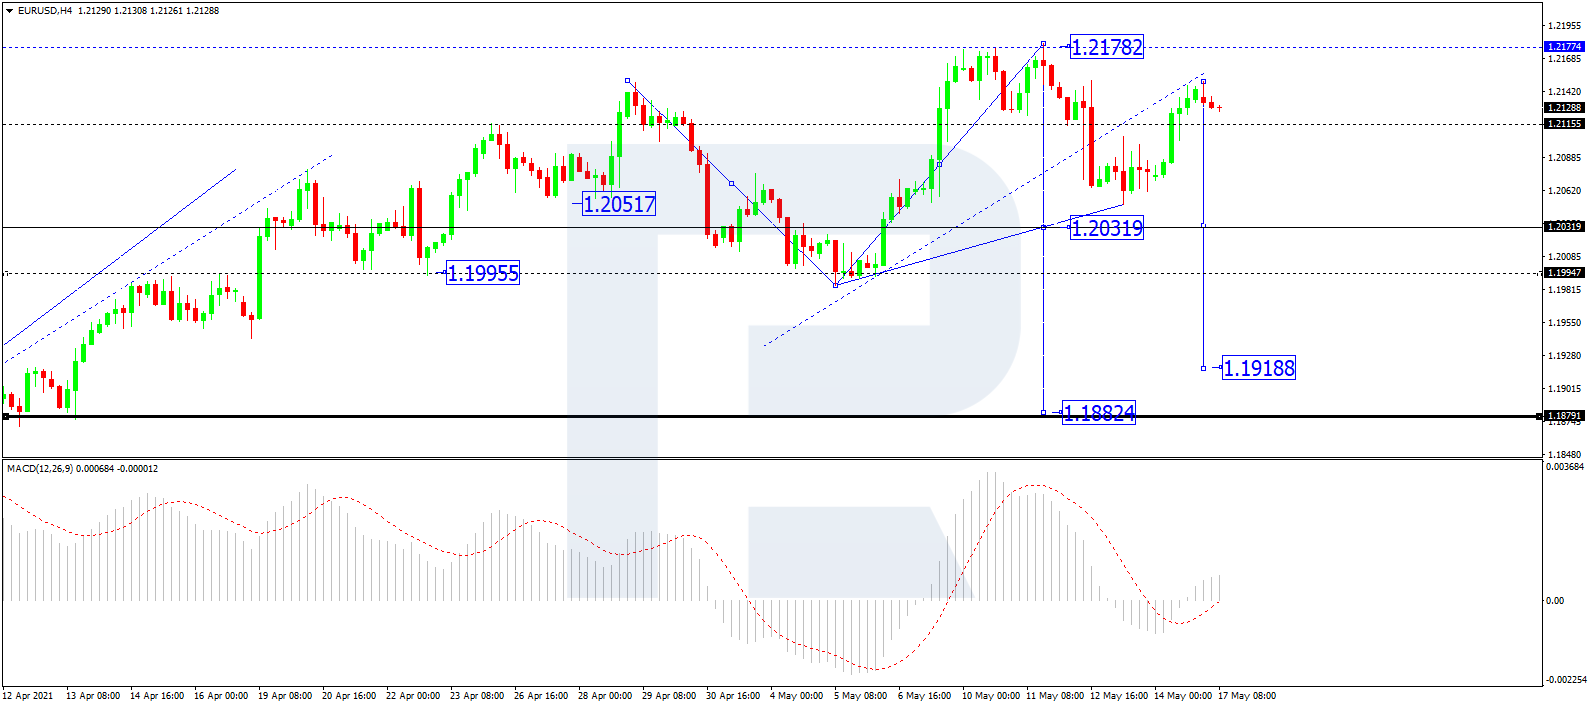
In the H4 chart, after completing the ascending wave at 1.2150, EUR/USD is consolidating at its top. If the price breaks this range to the downside, the market may resume trading downwards to break 1.2030 and then continue falling with the short-term target at 1.1919. From the technical point of view, this scenario is confirmed by MACD Oscillator: its signal line is moving below and may later continue falling.
Free Reports:
 Get our Weekly Commitment of Traders Reports - See where the biggest traders (Hedge Funds and Commercial Hedgers) are positioned in the futures markets on a weekly basis.
 Download Our Metatrader 4 Indicators – Put Our Free MetaTrader 4 Custom Indicators on your charts when you join our Weekly Newsletter
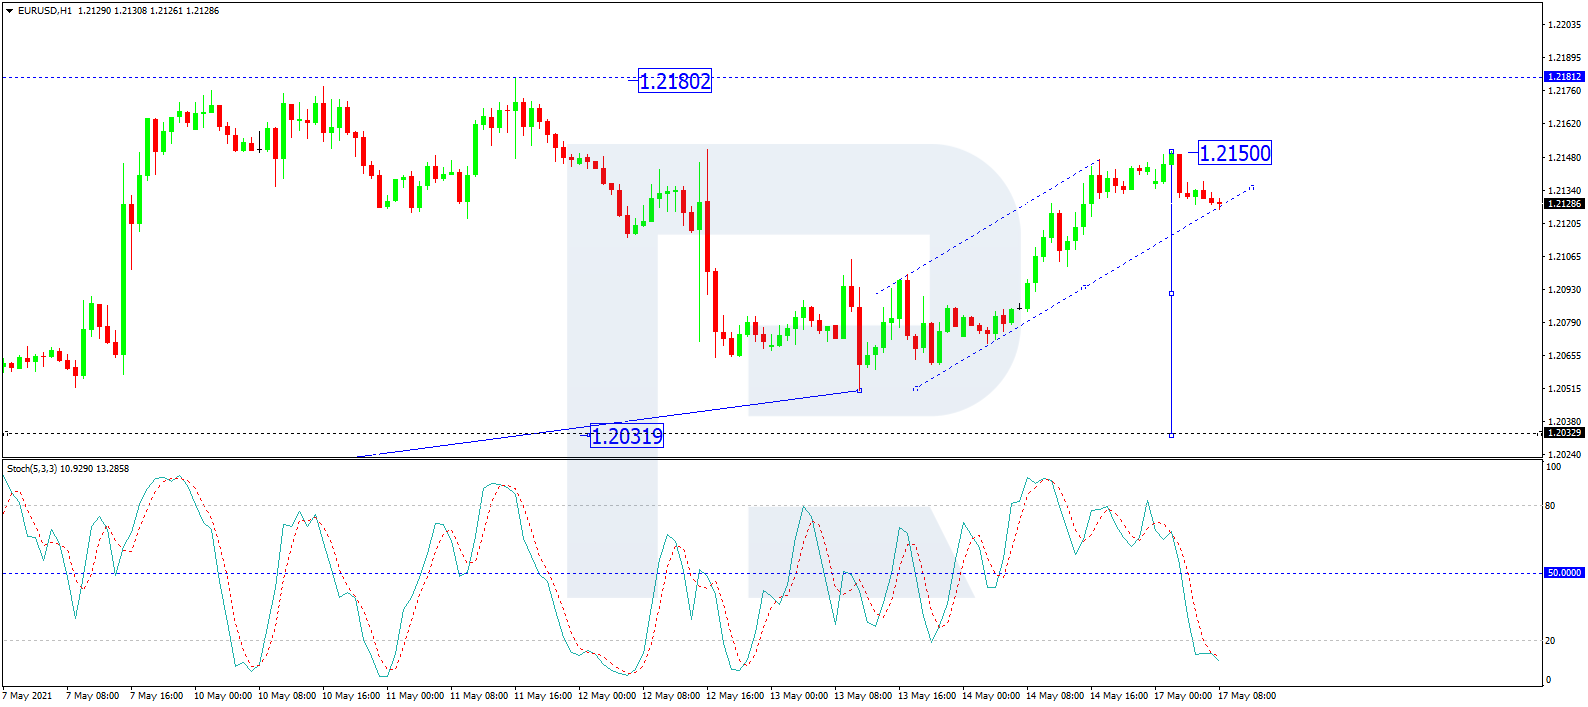
As we can see in the H1 chart, EUR/USD has reached the correctional target at 1.2150; right now, it is forming a new consolidation range below this level. Possibly, the pair may break the range to the downside and resume falling with the target at 1.2030. From the technical point of view, this scenario is confirmed by the Stochastic Oscillator: after reaching 20, its signal line is steadily growing towards 50. Later, the line may rebound and resume falling to return to 20.
Disclaimer
Any predictions contained herein are based on the authors’ particular opinion. This analysis shall not be treated as trading advice. RoboForex shall not be held liable for the results of the trades arising from relying upon trading recommendations and reviews contained herein.

- EUR/USD: The Advantage Remains with the Dollar Jun 29, 2026
- Escalation of the US–Iran conflict is once again supporting the rise in oil prices Jun 29, 2026
- Oil prices fall back to pre‑war levels. Silver drops to a 7‑month low Jun 25, 2026
- Gold Falls to an Eight-Month Low: This May Not Be the Bottom Jun 25, 2026
- Stock indices came under heavy selling pressure amid growing skepticism about AI investments Jun 24, 2026
- The Pound Is Pressured Not by Politics, but by a Strong US Dollar Jun 24, 2026
- Global crude oil prices continued to decline. The AUD/USD exchange rate hit an 11‑week low Jun 23, 2026
- EUR/USD Remains Under Sellers’ Control as the Dollar Stays Strong Jun 23, 2026
- Gold Falls for the Third Consecutive Week: Is There Still Upside Potential? Jun 22, 2026
- Bank Indonesia raised its interest rate. Norges Bank and the SNB left rates unchanged Jun 19, 2026