
By Dmitriy Gurkovskiy, Chief Analyst at RoboForex
On Monday, May 17th, the major currency pair reached stability after skyrocketing earlier and is currently trading at 1.2130.
The American statistics published last Friday were mostly disappointing and couldn’t help the “greenback”. For example, the Retail Sales in the USA showed a zero change in April after adding 10.7% m/m (a revised data) in the previous month and against the expected reading of 1.0% m/m. however, it’s quite logical because in March consumers received stimulus checks from the government, which immediately went right back into the country’s economy – it was an excellent although one-off tool to support the economic system.
In May or June, the Retail Sales may show another revival after the USA starts opening its borders and remove social restrictions. It will help Americans to spend more money.
The Industrial Production added 0.7% m/m in April after expanding by 2.4% m/m the month before. The Capacity Utilization Rate also improved. Both these reports managed to “smooth” the retail sales number a little bit.
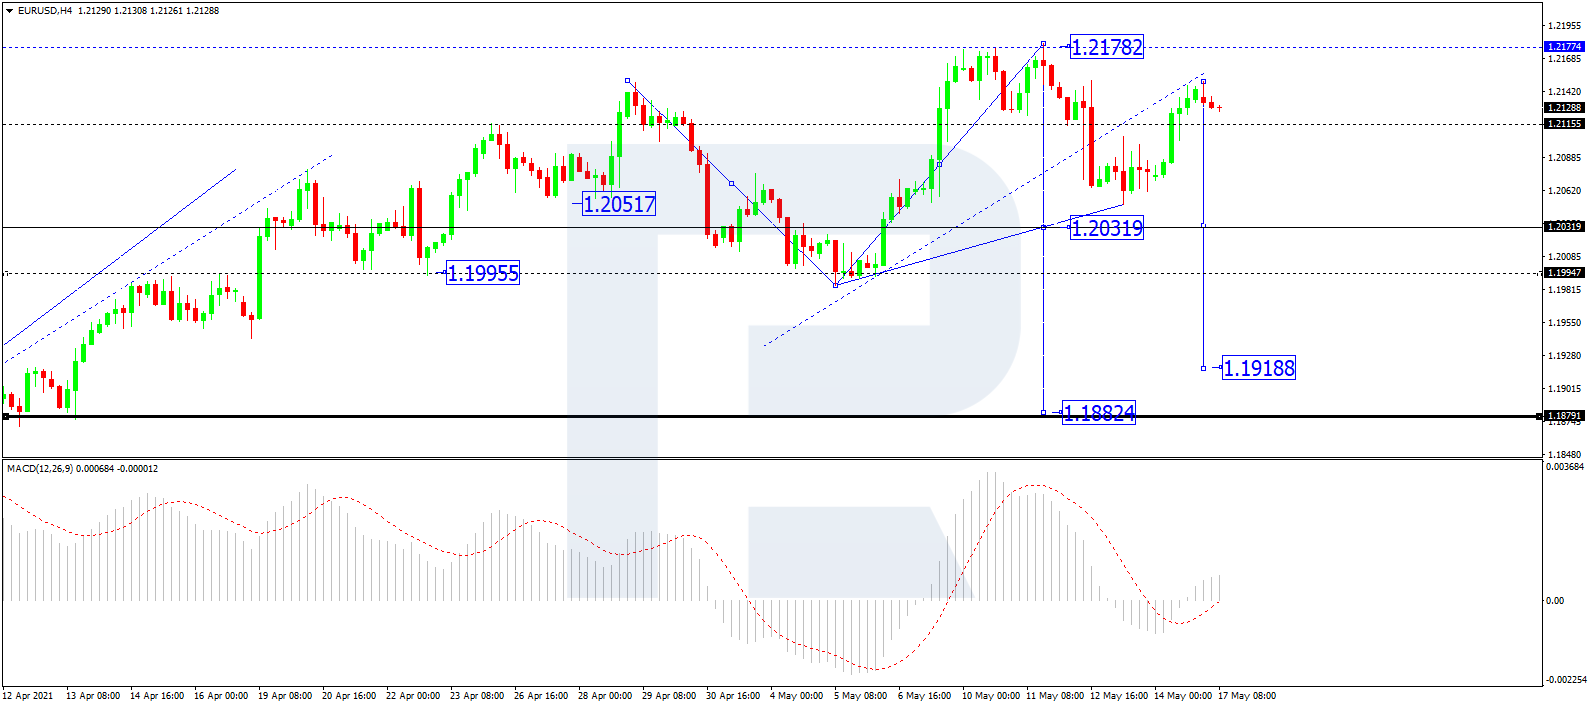
In the H4 chart, after completing the ascending wave at 1.2150, EUR/USD is consolidating at its top. If the price breaks this range to the downside, the market may resume trading downwards to break 1.2030 and then continue falling with the short-term target at 1.1919. From the technical point of view, this scenario is confirmed by MACD Oscillator: its signal line is moving below and may later continue falling.
Free Reports:
 Sign Up for Our Stock Market Newsletter – Get updated on News, Charts & Rankings of Public Companies when you join our Stocks Newsletter
 Get our Weekly Commitment of Traders Reports - See where the biggest traders (Hedge Funds and Commercial Hedgers) are positioned in the futures markets on a weekly basis.
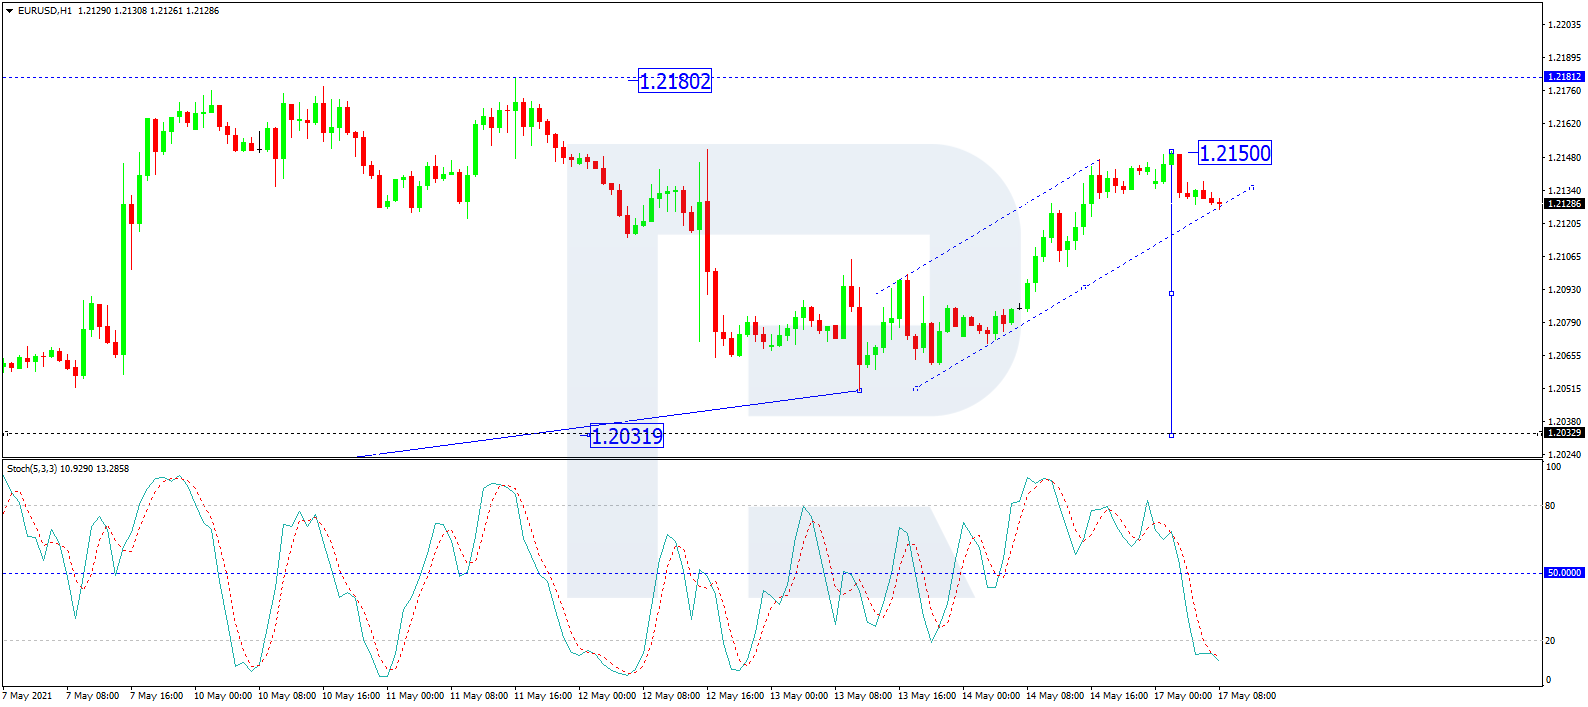
As we can see in the H1 chart, EUR/USD has reached the correctional target at 1.2150; right now, it is forming a new consolidation range below this level. Possibly, the pair may break the range to the downside and resume falling with the target at 1.2030. From the technical point of view, this scenario is confirmed by the Stochastic Oscillator: after reaching 20, its signal line is steadily growing towards 50. Later, the line may rebound and resume falling to return to 20.
Disclaimer
Any predictions contained herein are based on the authors’ particular opinion. This analysis shall not be treated as trading advice. RoboForex shall not be held liable for the results of the trades arising from relying upon trading recommendations and reviews contained herein.

- COT Metals Charts: Weekly Speculator Bets led by Copper & Steel Jul 18, 2026
- COT Bonds Charts: Weekly Speculator Bets led by 2-Year, SOFR 3M & 5-Year Bonds Jul 18, 2026
- COT Energy Charts: Weekly Speculator Bets led by Brent Oil & Heating Oil Jul 18, 2026
- COT Soft Commodities Charts: Weekly Speculator Bets led by Wheat, Corn & Soybean Meal Jul 18, 2026
- The Bank of Canada kept its interest rate unchanged. Platinum prices reached a three‑week high Jul 16, 2026
- Stock indices rose after the release of US inflation data. China’s GDP slowed sharply Jul 15, 2026
- GBP/USD Awaits Political News: What Will Happen Next Jul 15, 2026
- USD/JPY Holds at Highs: Pressure Lingers on Yen Jul 14, 2026
- Oil prices jumped 4% amid a new wave of escalation between the US and Iran Jul 13, 2026
- EUR/USD: US Inflation Will Determine Everything Jul 13, 2026