
Article By RoboForex.com
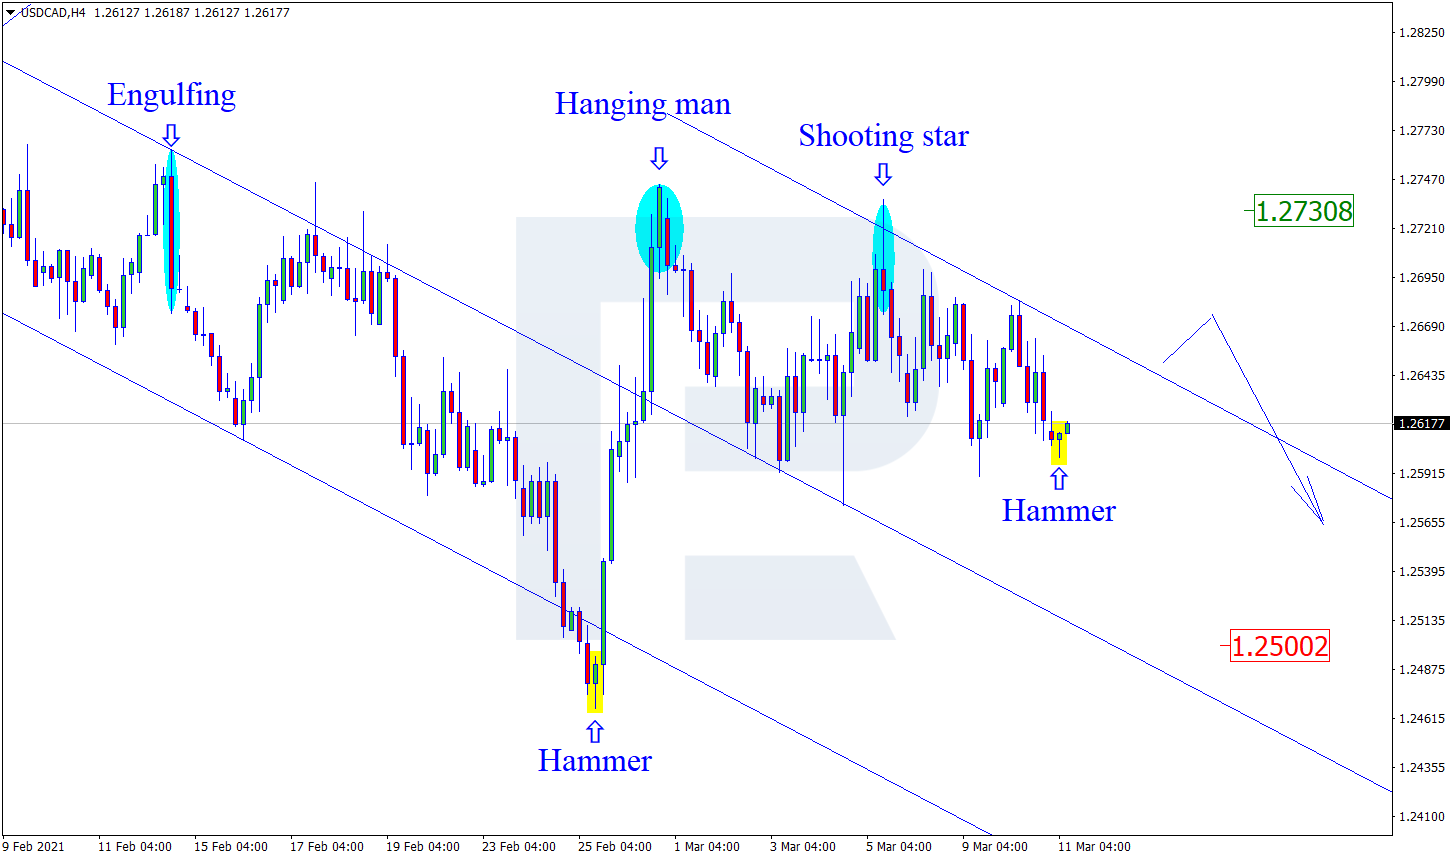
USDCAD, “US Dollar vs Canadian Dollar”
As we can see in the H4 chart, the asset is still moving sideways. After forming a Hammer reversal pattern not far from the support level, USDCAD may reverse and correct towards the resistance area at 1.2730. After the correction, the price may resume falling to reach the next downside target at 1.2500. After that, the asset may continue forming the descending impulse.

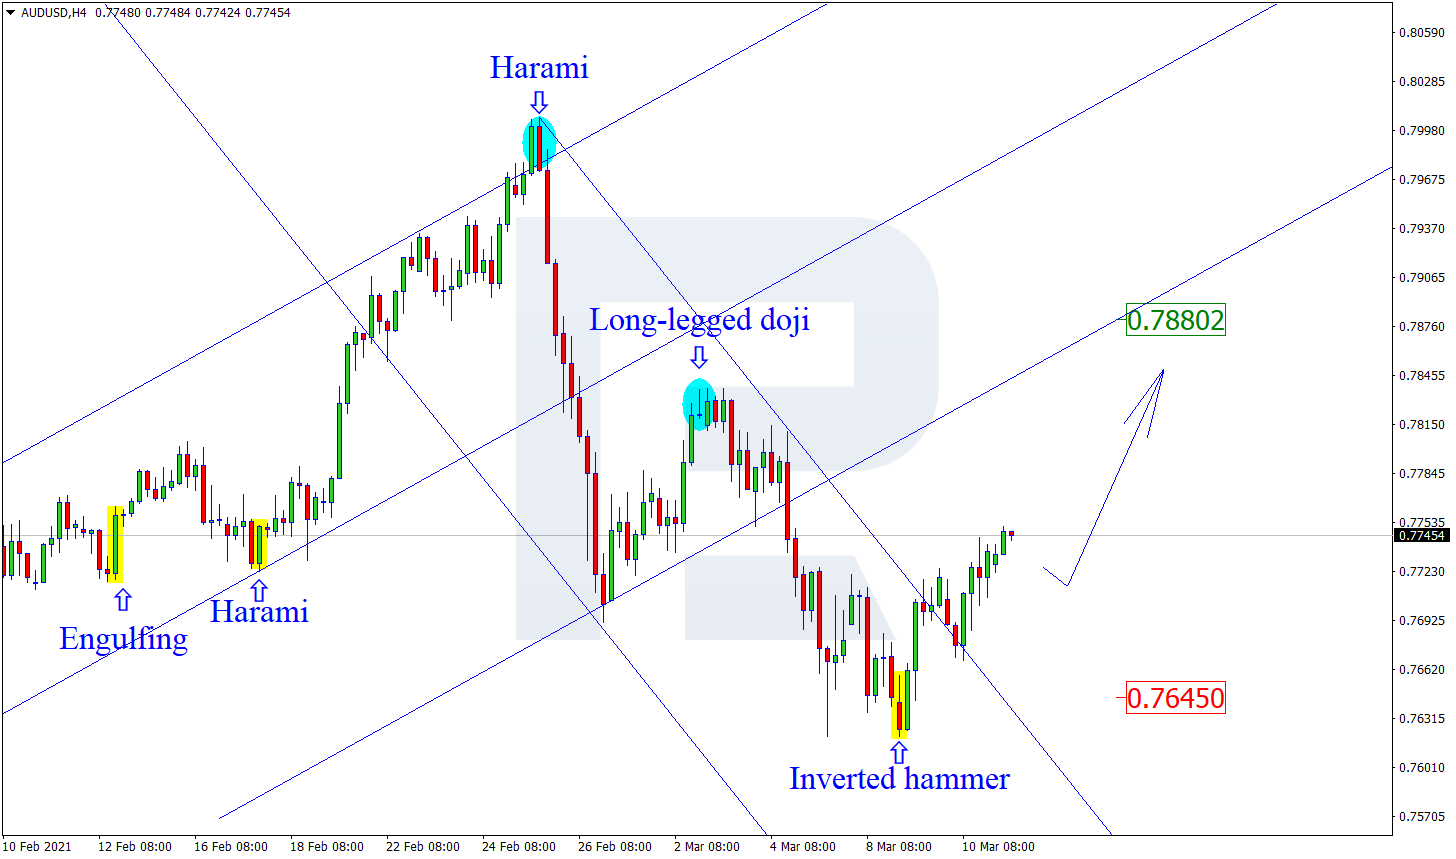
AUDUSD, “Australian Dollar vs US Dollar”
As we can see in the H4 chart, after forming several reversal patterns, such as Inverted Hammer, not far from the support area, the pair may reverse and resume growing to reach the resistance level at 0.7880. After testing it, the instrument may resume its decline to reach the downside target at the next support level at 0.7645.
Free Reports:
 Get our Weekly Commitment of Traders Reports - See where the biggest traders (Hedge Funds and Commercial Hedgers) are positioned in the futures markets on a weekly basis.
 Sign Up for Our Stock Market Newsletter – Get updated on News, Charts & Rankings of Public Companies when you join our Stocks Newsletter
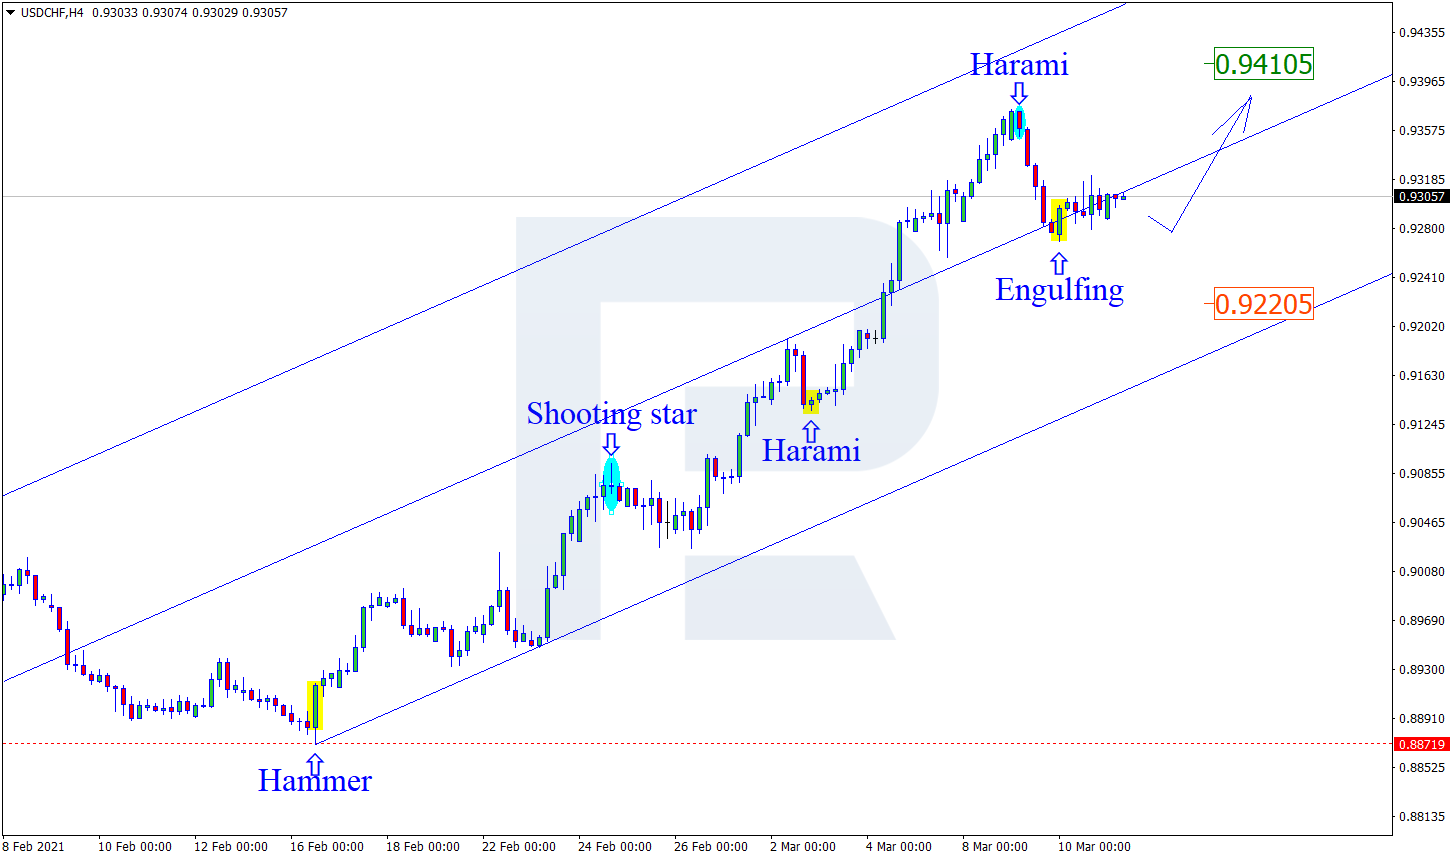
USDCHF, “US Dollar vs Swiss Franc”
As we can see in the H4 chart, the correction within the uptrend continues. At the moment, after forming an Engulfing reversal pattern not far from the support area, USDCHF may reverse and resume growing. In this case, the upside target is the resistance level at 0.9410. Still, there might be an alternative scenario, according to which the asset may correct to reach 0.9220 before resuming its growth.
Article By RoboForex.com
Attention!
Forecasts presented in this section only reflect the author’s private opinion and should not be considered as guidance for trading. RoboForex LP bears no responsibility for trading results based on trading recommendations described in these analytical reviews.

- This week will be one of the most crowded for central‑bank meetings Jul 27, 2026
- EUR/USD Ahead of a Key Week: Holding Near Lows Jul 27, 2026
- COT Metals Charts: Weekly Speculator Changes led by Copper Jul 26, 2026
- COT Bonds Charts: Speculator Bets led by SOFR 3-Months & 5-Year Bonds Jul 26, 2026
- COT Energy Charts: Weekly Speculator Bets led by WTI Crude & Natural Gas Jul 26, 2026
- COT Soft Commodities Charts: Weekly Speculator Bets led by Corn & Soybeans Jul 26, 2026
- The US introduces new import tariffs for 60 countries. Brent crude surpasses $100 per barrel Jul 24, 2026
- USD/JPY Breaks Records: Nothing Slows the Yen’s Decline Jul 24, 2026
- Oil prices reached a 6‑week high. The AUD strengthened on the back of a strong labor‑market report Jul 23, 2026
- EUR/USD Recovers as Dollar Weakens Jul 23, 2026