
Author: Dmitriy Gurkovskiy, Chief Analyst at RoboForex
Another negative issue for the oil appeared today, a new coronavirus strain, which was announced found by the World Health Organization in the Netherlands, Denmark, and Australia. This information elevates risks that the coronavirus pandemic might not be “beaten” soon even if the vaccination procedure starts quickly and some part of the world’s population builds up a specific immunity.
The latest data from Baker Hughes was rather bearish: over the previous week, the total number of rigs expanded by 5 units after adding 12 the week before.
At the same time, market players are positive in their response to decisions of the American regulator to stimulate and jump-start the country’s economy in order to encourage the demand for energies later.
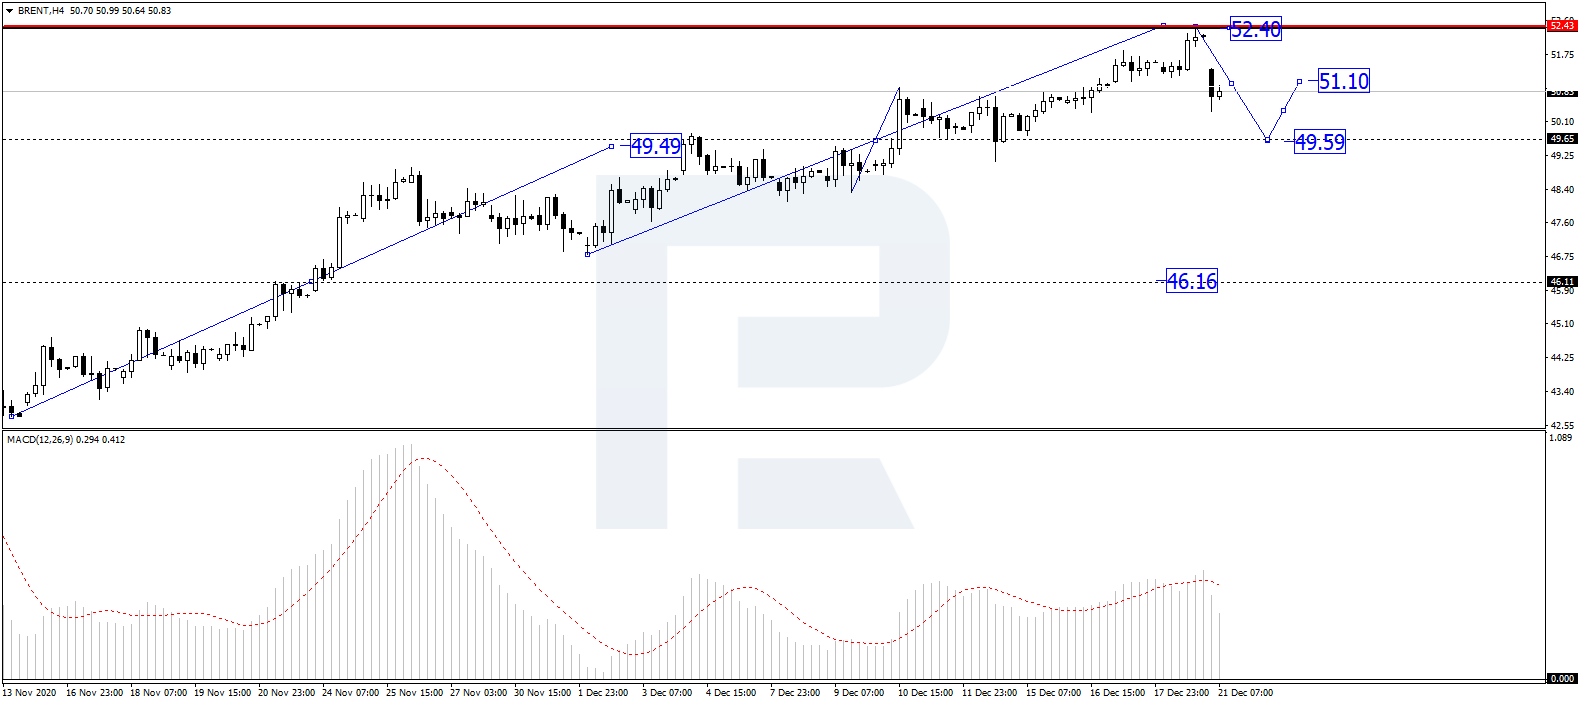
In the H4 chart, after finishing the ascending wave at 49.49 and then forming a new consolidation range around this level, Brent has broken it to the upside to reach 52.40; right now, it is falling. Possibly, the asset may return to test 49.49 from above and then form another ascending wave with the target at 51.10. From the technical point of view, this scenario is confirmed by MACD Oscillator: after leaving the histogram area, its signal line is expected to fall towards 0. If later the line breaks this level, the correctio on the price chart may continue down to 46.16.
Free Reports:
 Sign Up for Our Stock Market Newsletter – Get updated on News, Charts & Rankings of Public Companies when you join our Stocks Newsletter
 Get our Weekly Commitment of Traders Reports - See where the biggest traders (Hedge Funds and Commercial Hedgers) are positioned in the futures markets on a weekly basis.
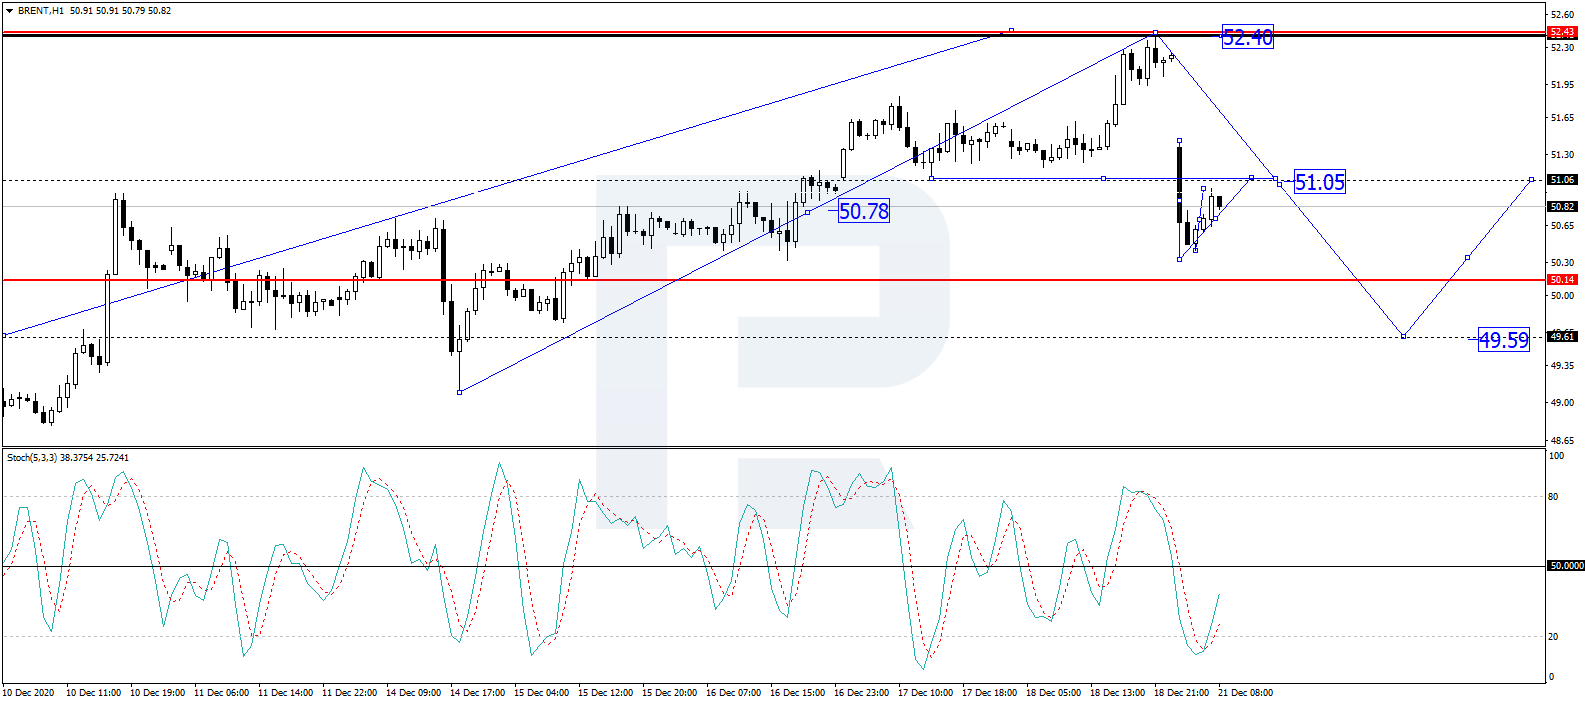
As we can see in the H1 chart, after rebounding from 49.10 and almost completing the ascending wave at 52.40, Brent is moving downwards and has already broken 51.03 to reach the short-term target at 50.33. Possibly, the asset may correct to test 51.05 from below and then start another decline towards 49.59. Later, the market may form one more ascending structure to return to 51.05. From the technical point of view, this idea is confirmed by Stochastic Oscillator: after breaking 20 to the upside, its signal line continues moving towards 50. After that, the line is expected to rebound from 50 and resume falling to return to 20.
Disclaimer
Any forecasts contained herein are based on the author’s particular opinion. This analysis may not be treated as trading advice. RoboForex bears no responsibility for trading results based on trading recommendations and reviews contained herein.

- Bank Indonesia raised its interest rate. Norges Bank and the SNB left rates unchanged Jun 19, 2026
- EUR/USD Loses Ground as Market Sentiment Favours the US Dollar Jun 19, 2026
- GBPUSD Awaits Bank of England Meeting Near April Lows Jun 18, 2026
- Markets disliked the results of the FOMC meeting. HKMA followed the Fed and kept its rate unchanged. Jun 18, 2026
- Gold Surges 2% Since Week Opening Amid Geopolitical Shifts and Fed Expectations Jun 17, 2026
- Your Bourse and FXPRIMUS Bring 24/7 Synthetic Indices to the Global Broker Market Jun 16, 2026
- Institutional investors continue to reduce their presence in metals Jun 16, 2026
- USDJPY Driven by Emotions: Bank of Japan Raises Rate to Highest Level Since 1995 Jun 16, 2026
- The United States and Iran have signed a peace agreement – oil has fallen to 80 dollars per barrel. Jun 15, 2026
- EURUSD Ahead of the New Week: Expecting High Volatility Jun 15, 2026