
Author: Dmitriy Gurkovskiy, Chief Analyst at RoboForex
Another negative issue for the oil appeared today, a new coronavirus strain, which was announced found by the World Health Organization in the Netherlands, Denmark, and Australia. This information elevates risks that the coronavirus pandemic might not be “beaten” soon even if the vaccination procedure starts quickly and some part of the world’s population builds up a specific immunity.
The latest data from Baker Hughes was rather bearish: over the previous week, the total number of rigs expanded by 5 units after adding 12 the week before.
At the same time, market players are positive in their response to decisions of the American regulator to stimulate and jump-start the country’s economy in order to encourage the demand for energies later.
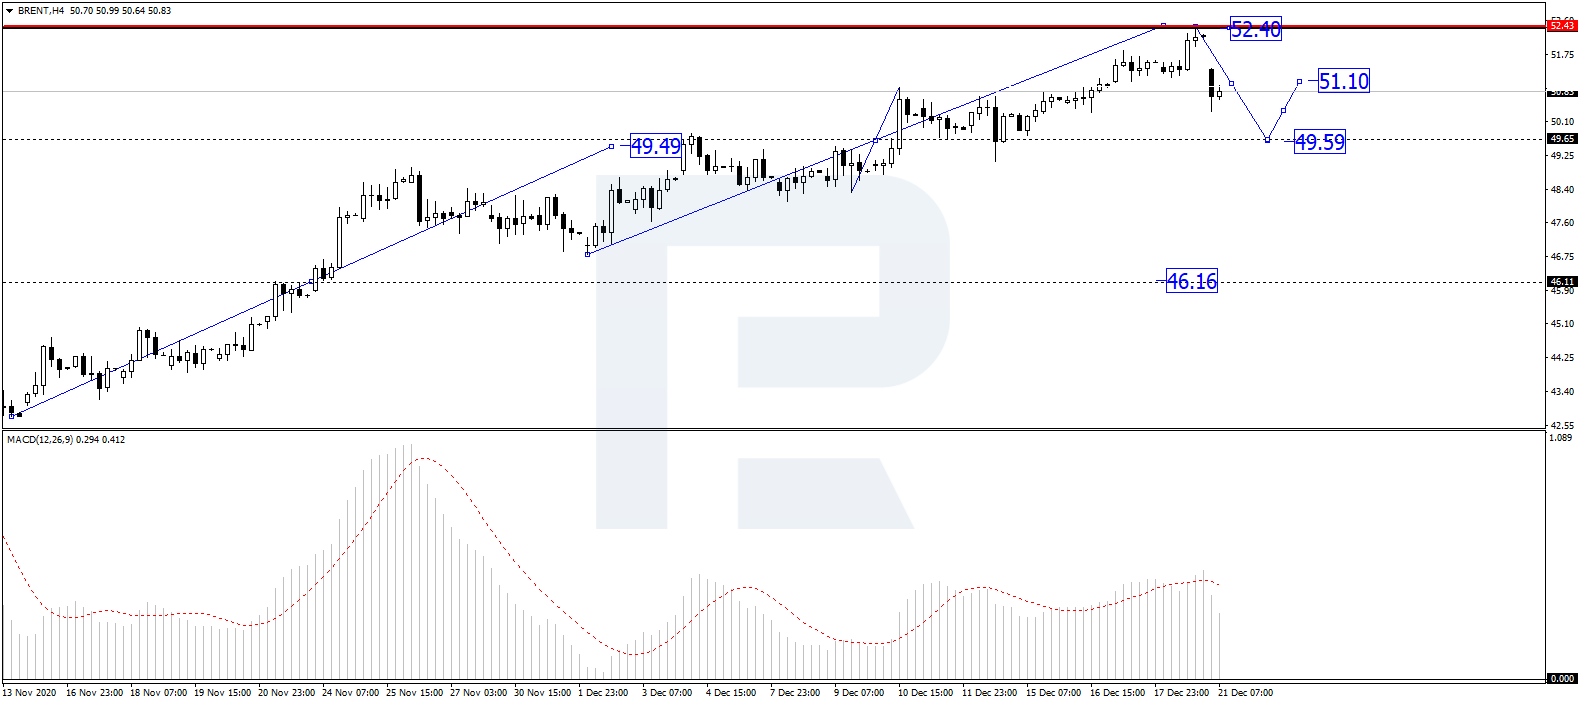
In the H4 chart, after finishing the ascending wave at 49.49 and then forming a new consolidation range around this level, Brent has broken it to the upside to reach 52.40; right now, it is falling. Possibly, the asset may return to test 49.49 from above and then form another ascending wave with the target at 51.10. From the technical point of view, this scenario is confirmed by MACD Oscillator: after leaving the histogram area, its signal line is expected to fall towards 0. If later the line breaks this level, the correctio on the price chart may continue down to 46.16.
Free Reports:
 Download Our Metatrader 4 Indicators – Put Our Free MetaTrader 4 Custom Indicators on your charts when you join our Weekly Newsletter
 Get our Weekly Commitment of Traders Reports - See where the biggest traders (Hedge Funds and Commercial Hedgers) are positioned in the futures markets on a weekly basis.
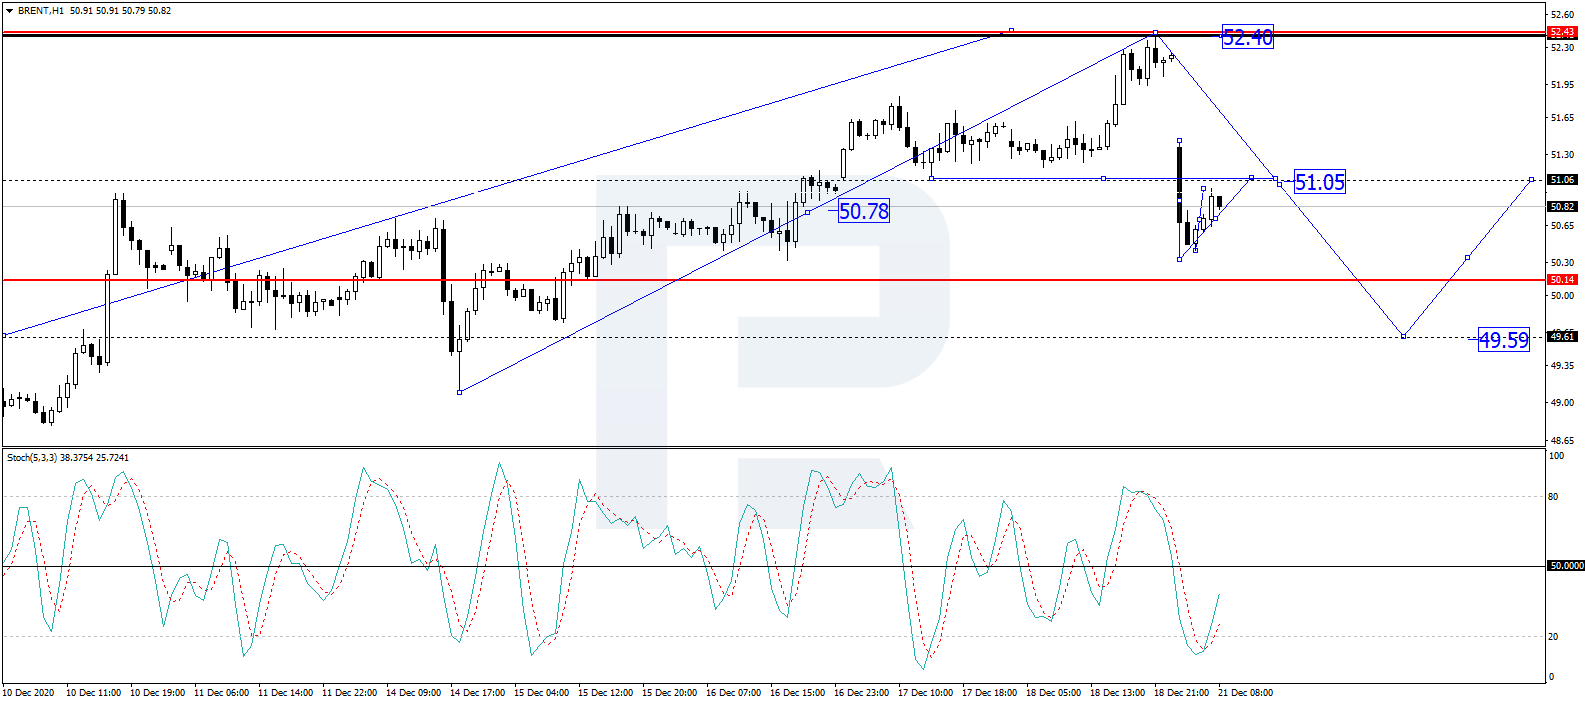
As we can see in the H1 chart, after rebounding from 49.10 and almost completing the ascending wave at 52.40, Brent is moving downwards and has already broken 51.03 to reach the short-term target at 50.33. Possibly, the asset may correct to test 51.05 from below and then start another decline towards 49.59. Later, the market may form one more ascending structure to return to 51.05. From the technical point of view, this idea is confirmed by Stochastic Oscillator: after breaking 20 to the upside, its signal line continues moving towards 50. After that, the line is expected to rebound from 50 and resume falling to return to 20.
Disclaimer
Any forecasts contained herein are based on the author’s particular opinion. This analysis may not be treated as trading advice. RoboForex bears no responsibility for trading results based on trading recommendations and reviews contained herein.

- The US and European stock indices are rising again amid renewed investor interest in the AI industry. Jul 10, 2026
- USD/JPY Falls as Yen Recovers Weekly Losses Jul 10, 2026
- Crude oil prices surged sharply by 7% in reaction to the rapid escalation of the conflict in the Middle East Jul 9, 2026
- Middle East Tensions Weigh on Gold Jul 9, 2026
- Pound Awaits Tighter Policy from Bank of England Jul 8, 2026
- The United States carried out airstrikes on Iran after Iran’s attacked tankers in the Strait of Hormuz. The RBNZ raised the interest rate to 2.5% Jul 8, 2026
- RoboForex Brings Full-Scale Trading to Telegram Jul 7, 2026
- Your Bourse Integrates TradingView Charts and Trading Platform Library with Trade Server Jul 7, 2026
- Yen Still Under Pressure: Markets Await Action from Authorities Jul 7, 2026
- Germany’s DAX Index has updated its all‑time high. OPEC+ countries have agreed to increase production Jul 7, 2026