🚨 HCI – HCI Group, Inc. has been added to our data-driven Watchlist.
Here are the details:
📈 HCI – HCI Group, Inc.
🏭 Sector: Financial Services (Insurance)
📊 Market Cap: Small / Micro Cap
⚡ Beta: 1.21 (High Risk)
📈 52W Performance: +11.09%
📊 Quant Score: 59/100 (Watchlist)
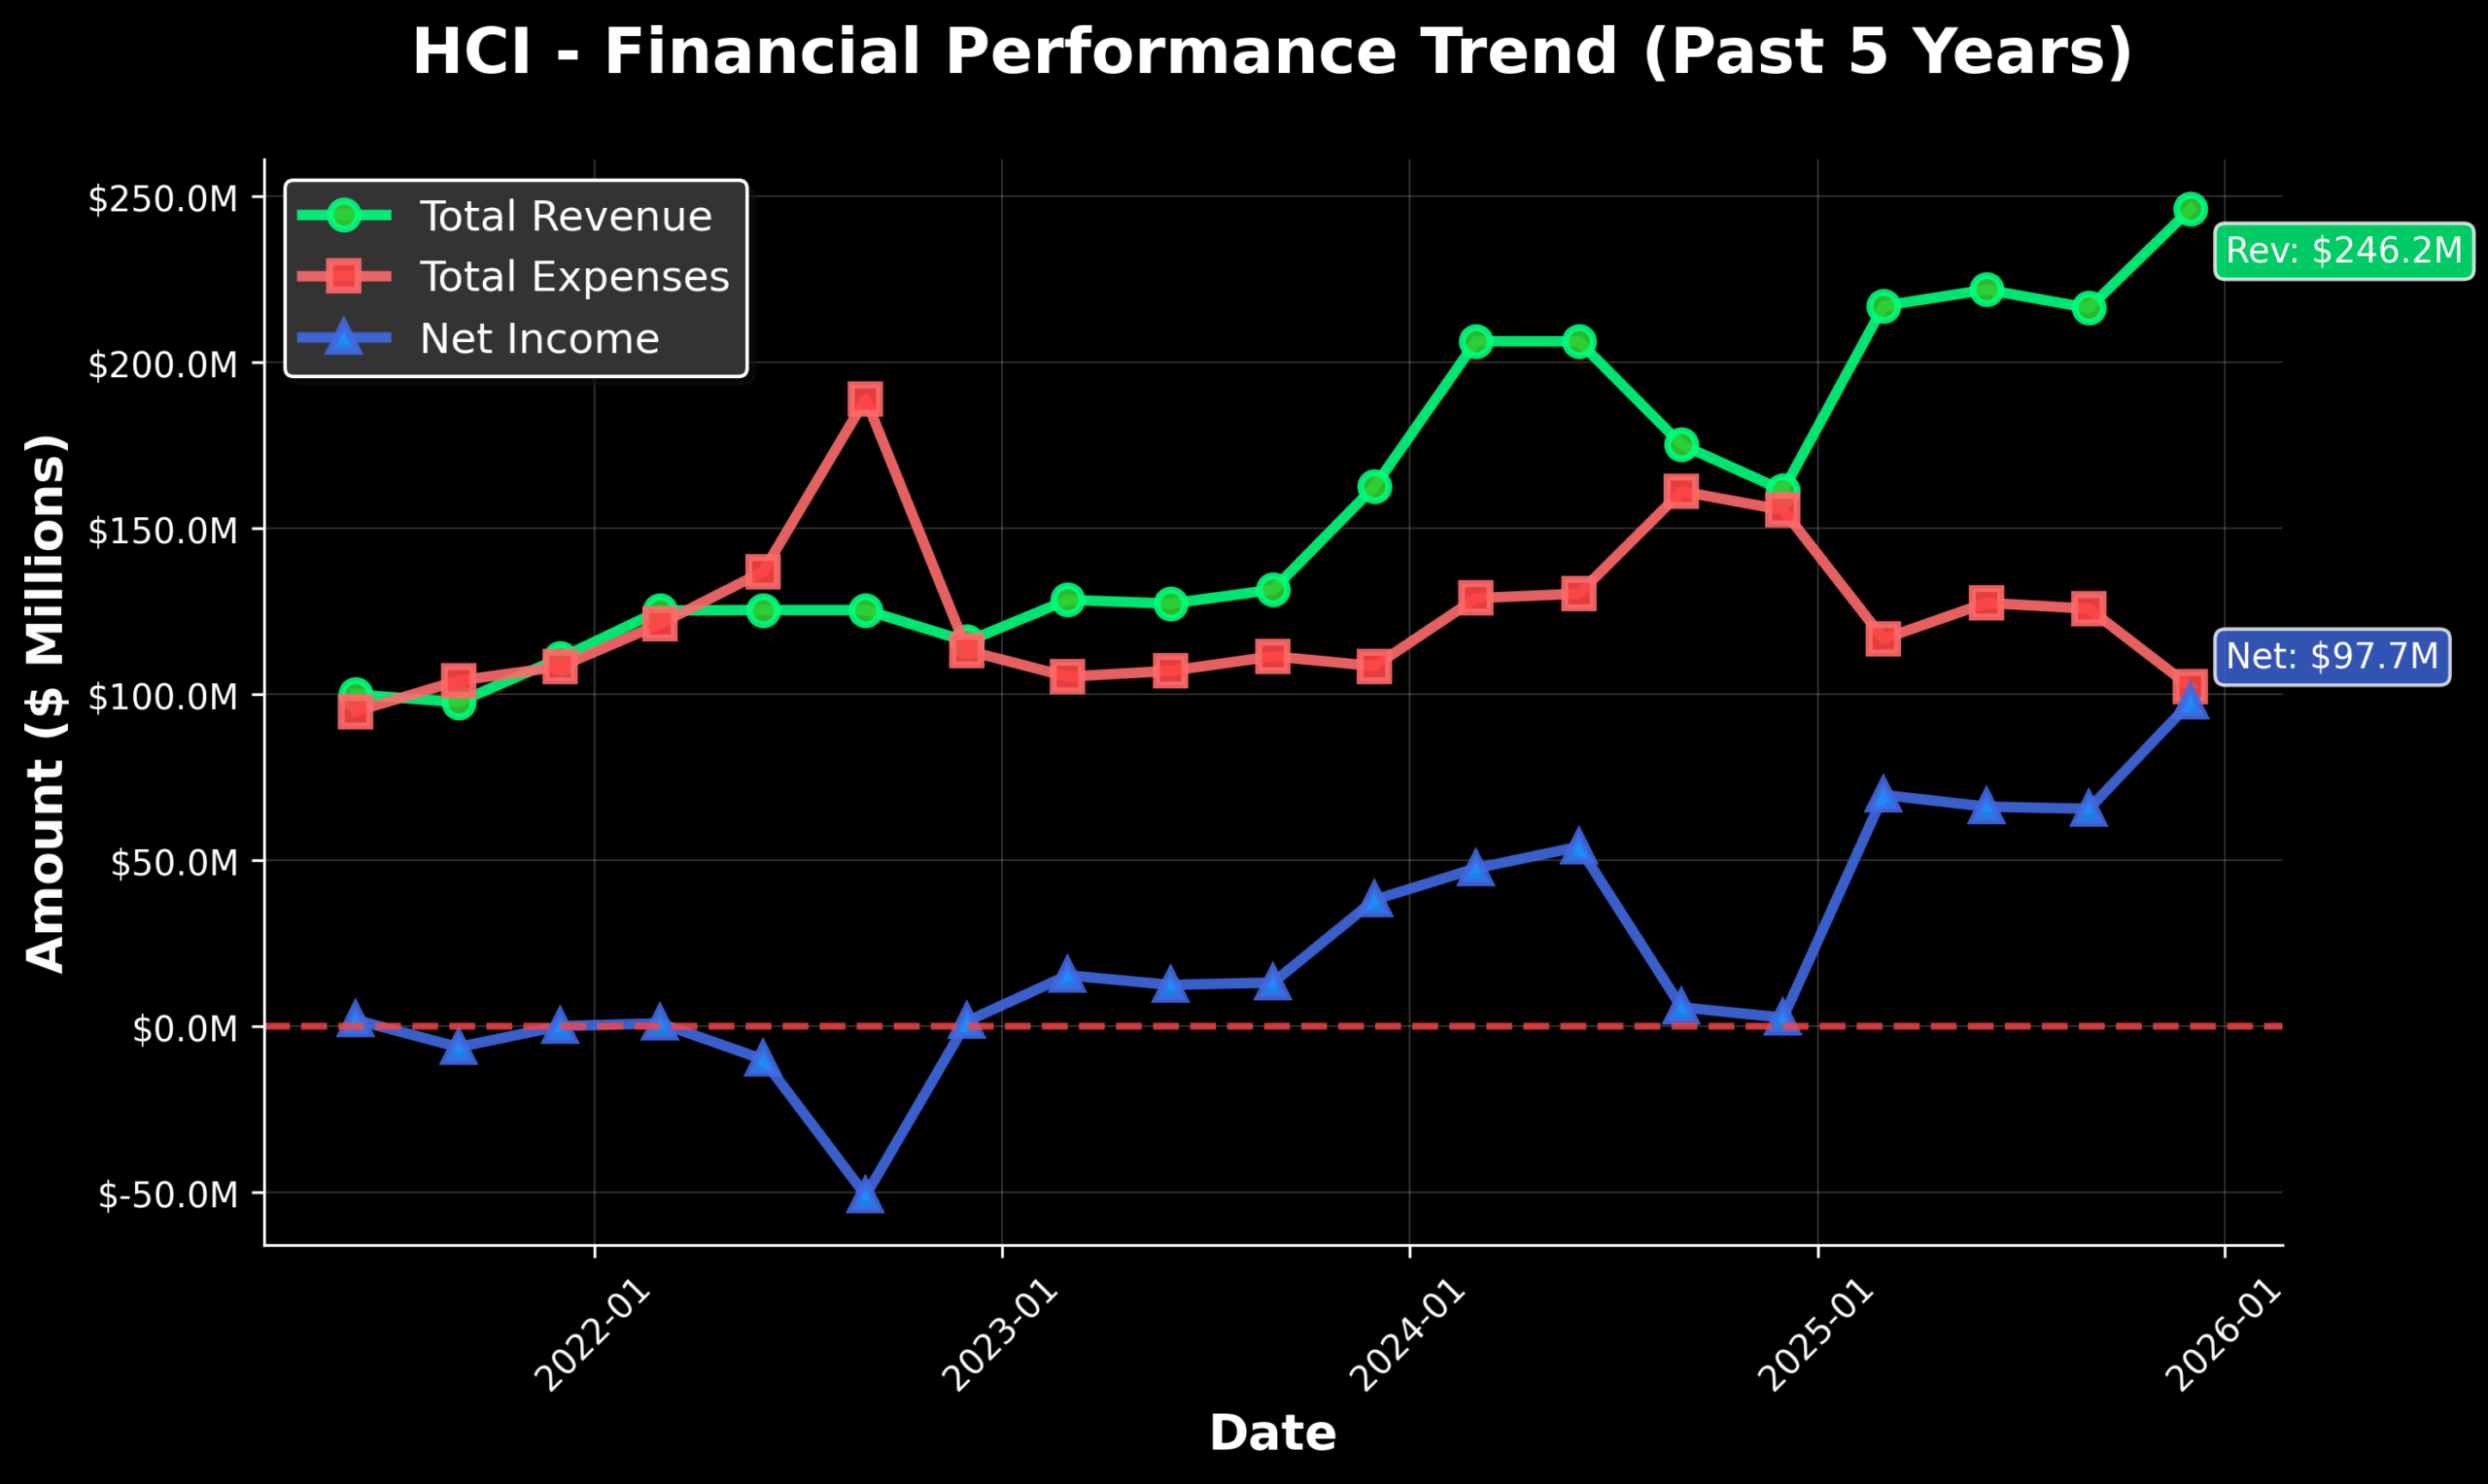
HCI Group has beaten its earnings-per-share estimates for four consecutive quarters. Currently, it has a dividend slightly above 1.00 percent, with a payout ratio of approximately just 7%. The current TTM P/E ratio is slightly above 6.50 with a 5-year average P/E around 12.33. The HCI earnings yield measures approximately 14.74 percent at time of writing
The price trend for HCI has been moving higher over the long-term with a sustained uptrend since a low of $27.65 in October of 2022. However, the stock has been retreating since a recent high in October 2025 at $210.50. Currently, the stock is hovering around the $153.85 per share level. The weekly Relative Strength Index (RSI) is currently at around 44.1 level and our trend-following model labels the current situation as bearish.
Full Disclosure: I do not currently own this stock. Disclaimer: Content is educational purposes and not intended as investment advice.
These stock selections are data-driven based on a number of financial metrics and ratios every quarter when earnings are released. These selections are intended to be a step one idea (not a buy signal) but to spur further research into the stock, its competitors and its industry.
By JustMarkets On Thursday, the US stock indices posted strong gains, fully recovering from the…
By Analytical Department RoboForex USD/JPY recovered to 160.60 on Friday following a sharp drop the…
By Patrick J. Schena, Tufts University Creating a government fund to own AI stock and…
By JustMarkets The US equity indices ended Wednesday’s session with notable declines as geopolitical risks…
By Analytical Department RoboForex USD/JPY held near 163.50 on Thursday, with the yen retreating slightly…
By Analytical Department RoboForex GBP/USD continued to consolidate at 1.3283 on Wednesday. The British pound…
This website uses cookies.