
By RoboForex Analytical Department
The USD/JPY pair paused on Monday after a sharp rally to around 157.95, with the yen holding near its lowest levels of the year. Trading activity was subdued as Japanese markets were closed for a public holiday.
Political uncertainty increased after Prime Minister Sanae Takaichi, a key coalition partner, raised the possibility of early elections on 8 or 15 February, adding another layer of caution to the market.
The yen also faced pressure from recent mixed macroeconomic data, which have clouded the outlook for the Bank of Japan’s future rate-hike trajectory.
Last week, BoJ Governor Kazuo Ueda reiterated that the central bank would continue to raise interest rates if economic momentum and inflation align with forecasts, while also emphasising a flexible approach to policy adjustments.
Over the coming week, traders will focus on a series of key Japanese economic indicators, including current account figures, machine tool orders, manufacturing PMI, and business sentiment data. Any surprises could prompt a shift in the yen’s direction.
Free Reports:
 Get our Weekly Commitment of Traders Reports - See where the biggest traders (Hedge Funds and Commercial Hedgers) are positioned in the futures markets on a weekly basis.
 Sign Up for Our Stock Market Newsletter – Get updated on News, Charts & Rankings of Public Companies when you join our Stocks Newsletter
Technical Analysis: USD/JPY
H4 Chart:
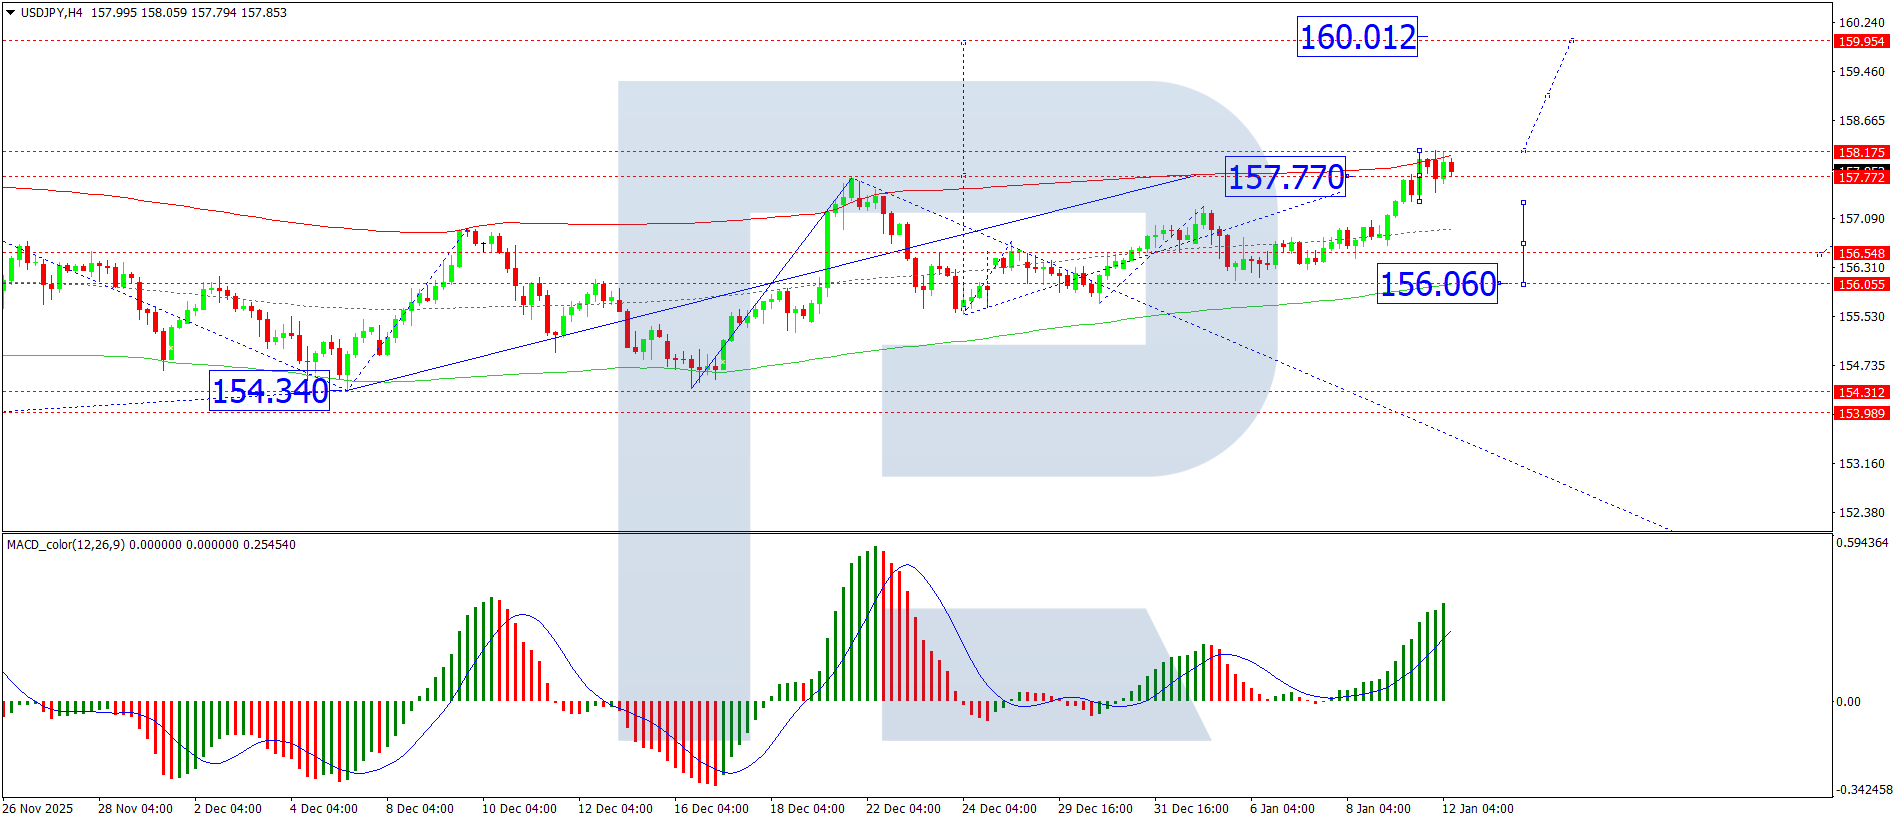
On the H4 chart, the pair has completed a local advance to 157.77 and is likely to enter a period of consolidation around this level. A break below this range could trigger a corrective move towards 156.60. Conversely, an upward break would open the potential for the rally to extend towards 159.33. This outlook is supported by the MACD indicator, with its signal line positioned above zero and pointing firmly upward, indicating ongoing bullish momentum.
H1 Chart:
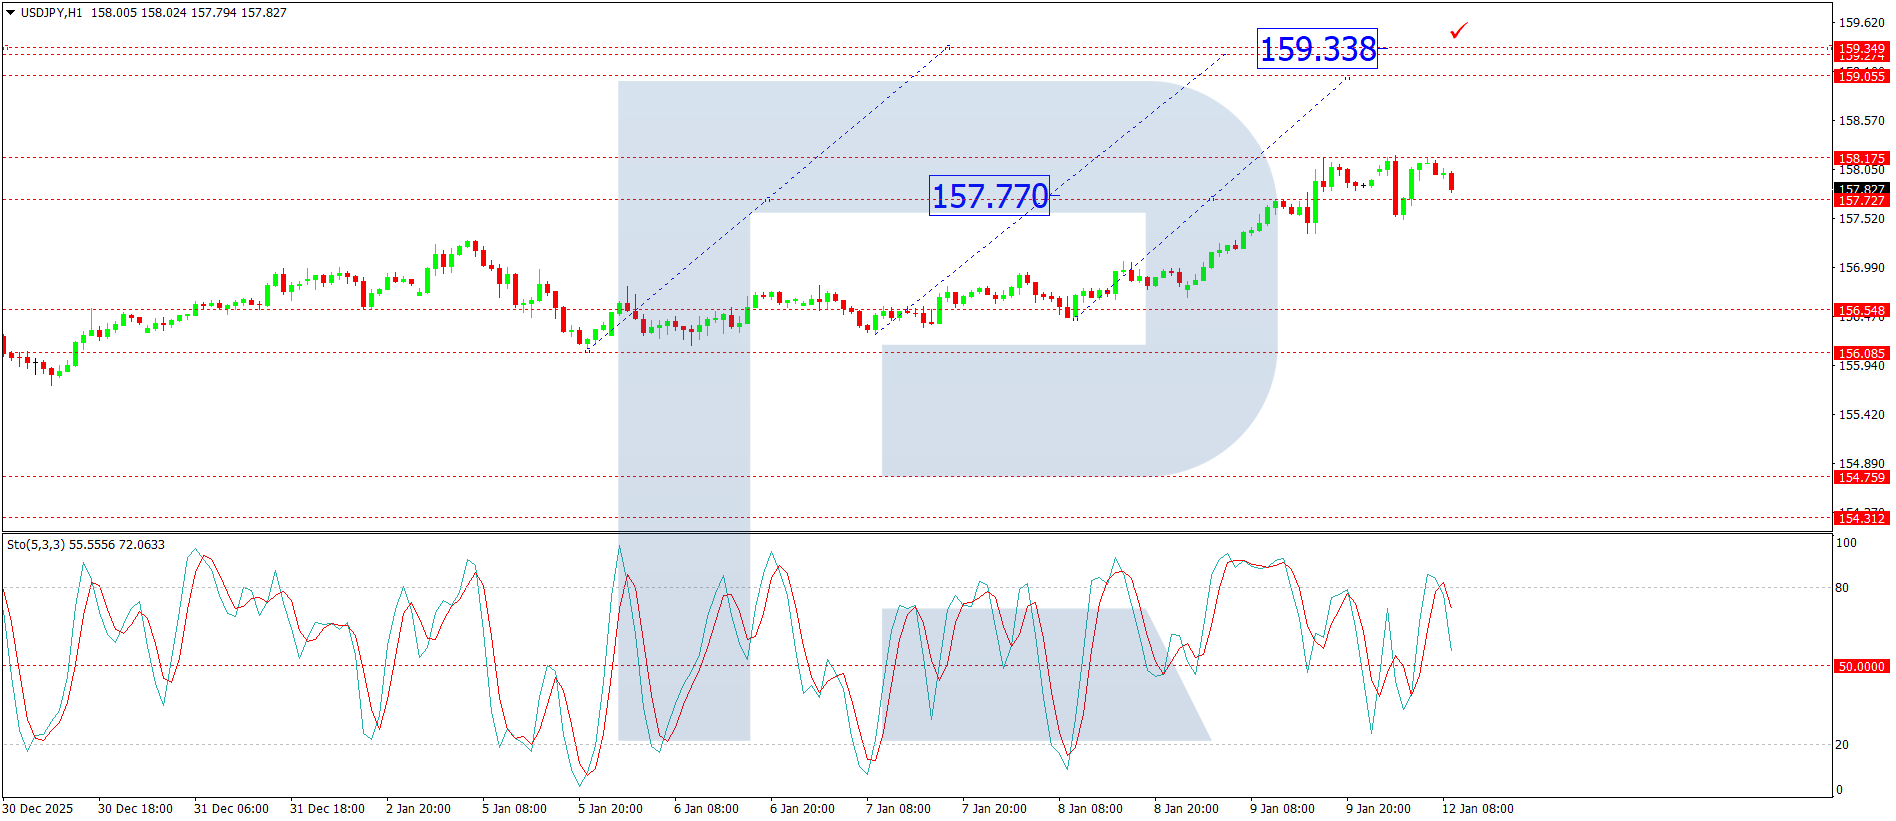
On the H1 chart, the market is forming a consolidation range centred around 157.77, with interim boundaries at 158.18 to the upside and 157.50 to the downside. A downward exit from this range could see a decline towards 156.60, while an upward resolution would signal potential for a further move towards 159.33. The Stochastic oscillator aligns with this view, as its signal line is above 50 and rising towards 80, suggesting continued near-term upward momentum.
Conclusion
USD/JPY has entered a period of consolidation near annual highs, with direction likely to be determined by upcoming Japanese data and political developments. While the broader technical bias remains bullish, a break below 157.50 could signal the start of a short-term correction.
Disclaimer:
Any forecasts contained herein are based on the author’s particular opinion. This analysis may not be treated as trading advice. RoboForex bears no responsibility for trading results based on trading recommendations and reviews contained herein.

- The US Tech sector hit by sell‑off. Oil prices decline on renewed negotiations Jul 28, 2026
- Gold Declines, Focus on Fed and Falling Oil Prices Jul 28, 2026
- This week will be one of the most crowded for central‑bank meetings Jul 27, 2026
- EUR/USD Ahead of a Key Week: Holding Near Lows Jul 27, 2026
- COT Metals Charts: Weekly Speculator Changes led by Copper Jul 26, 2026
- COT Bonds Charts: Speculator Bets led by SOFR 3-Months & 5-Year Bonds Jul 26, 2026
- COT Energy Charts: Weekly Speculator Bets led by WTI Crude & Natural Gas Jul 26, 2026
- COT Soft Commodities Charts: Weekly Speculator Bets led by Corn & Soybeans Jul 26, 2026
- The US introduces new import tariffs for 60 countries. Brent crude surpasses $100 per barrel Jul 24, 2026
- USD/JPY Breaks Records: Nothing Slows the Yen’s Decline Jul 24, 2026