
By RoboForex Analytical Department
Gold prices rose above 4,622 USD per ounce on Wednesday, challenging previous record levels. The rally is underpinned by growing expectations of US interest rate cuts this year and heightened demand for defensive assets.
December data pointed to a moderation in core US inflation, confirming a gradual easing of price pressures and clarifying the economic picture following earlier disruptions.
In this environment, interest rate futures reflect a divergence in expectations: investors are pricing in two to three rate cuts from the Federal Reserve in 2025, exceeding the median forecast from policymakers themselves, which signals only one reduction.
Safe-haven demand has also been reinforced by concerns over the Fed’s independence following the launch of a criminal investigation related to Chair Jerome Powell’s congressional testimony in June.
Geopolitical tensions remain elevated, with markets closely monitoring the risk of US involvement in political instability in Iran amid recurring warnings of potential military action.
Free Reports:
 Get our Weekly Commitment of Traders Reports - See where the biggest traders (Hedge Funds and Commercial Hedgers) are positioned in the futures markets on a weekly basis.
 Download Our Metatrader 4 Indicators – Put Our Free MetaTrader 4 Custom Indicators on your charts when you join our Weekly Newsletter
Technical Analysis: XAU/USD
H4 Chart:
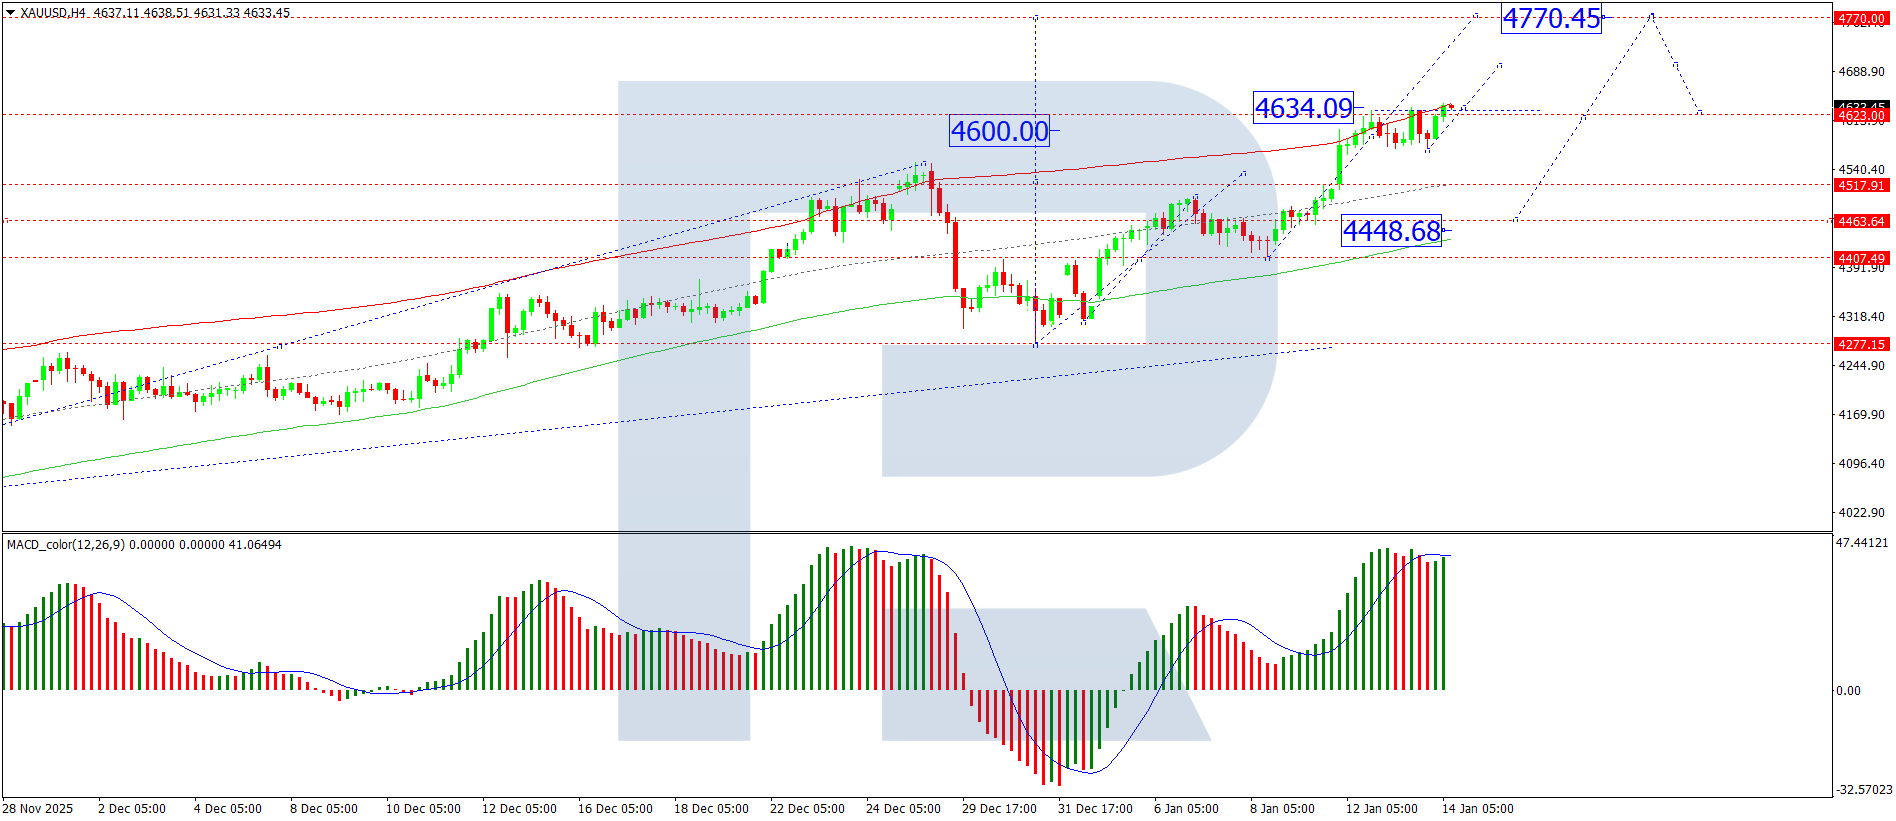
On the H4 chart, XAU/USD is consolidating around 4,623 USD. An upward expansion of this range towards 4,770 USD is anticipated, likely to be followed by a corrective pullback towards 4,620 USD. A break below this level would open the door to a deeper correction towards 4,520 USD.
The MACD indicator supports the bullish outlook, with its signal line turning upward and pressing towards new highs, indicating sustained upward momentum.
H1 Chart:
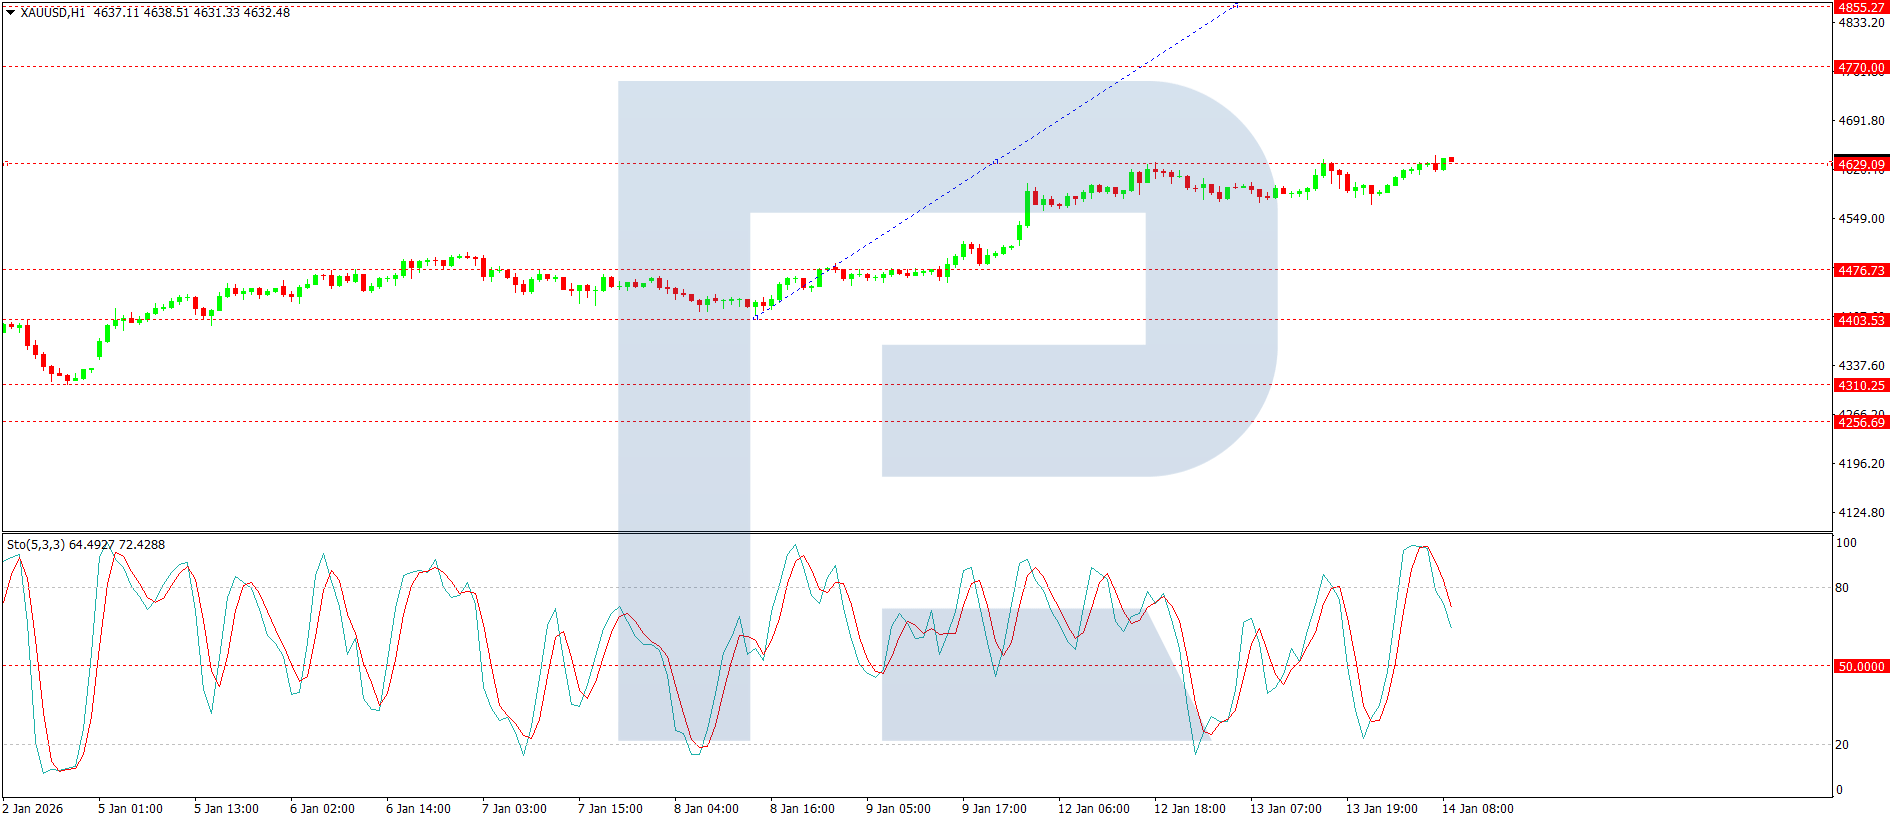
On the H1 chart, the market has formed a consolidation range around 4,629 USD and is now building the next leg higher, targeting at least 4,770 USD. This structure reinforces the broader uptrend.
The Stochastic oscillator aligns with this view, as its signal line is positioned at 80 and continues to point upward, signalling strong near-term bullish momentum.
Conclusion
Gold continues to draw strength from shifting rate expectations, political uncertainty, and persistent geopolitical risks. While the near-term technical structure suggests potential for further gains towards 4,770 USD, traders should remain mindful of overextended conditions and the likelihood of a corrective pullback thereafter. A sustained move above current levels would reinforce the longer-term bullish narrative, while a break below 4,620 USD could signal a deeper retracement before the next leg higher.
Disclaimer:
Any forecasts contained herein are based on the author’s particular opinion. This analysis may not be treated as trading advice. RoboForex bears no responsibility for trading results based on trading recommendations and reviews contained herein.

- The Tech‑heavy NASDAQ Index jumped by more than 3.3%. The offshore yuan is trading at its highest level since 2023 Jul 31, 2026
- USD/JPY After Volatility: Multiple Events in One Day Jul 31, 2026
- The US indices sell off amid renewed US-Iran clashes. Oil jumps by 7% Jul 30, 2026
- USD/JPY Temporary in Equilibrium: Multiple Factors in Focus Jul 30, 2026
- GBP/USD at Month’s Lows: The Outlook Remains Weak Jul 29, 2026
- Crude oil falls below $80 per barrel. Australia sees inflation slowdown Jul 29, 2026
- The US Tech sector hit by sell‑off. Oil prices decline on renewed negotiations Jul 28, 2026
- Gold Declines, Focus on Fed and Falling Oil Prices Jul 28, 2026
- This week will be one of the most crowded for central‑bank meetings Jul 27, 2026
- EUR/USD Ahead of a Key Week: Holding Near Lows Jul 27, 2026
