
By RoboForex Analytical Department
The GBP/USD pair climbed to a two-week high on Thursday, holding near 1.3578, bolstered by improved global risk sentiment following the US-Japan trade agreement.
The deal, which replaces previously proposed 25% tariffs with a 15% levy, also includes the creation of a $550 billion investment fund to support the US economy. President Donald Trump hailed the agreement as mutually beneficial, further lifting market confidence.
Investors are now turning their attention to key UK economic indicators. PMI forecasts suggest the smallest contraction in manufacturing activity in six months, accompanied by the sharpest rise in services sector growth in nearly a year. Retail sales are also expected to rebound, aided by recent warm weather.
However, concerns linger after the UK reported a June budget deficit of £20.7 billion – the second-highest June figure since 1993. Rising inflation-linked bond repayments pushed debt servicing costs to £16.4 billion, adding pressure on public finances.
Amid these developments, speculation is mounting that Chancellor Rachel Reeves could announce tax increases as early as the autumn to address fiscal challenges.
Free Reports:
 Download Our Metatrader 4 Indicators – Put Our Free MetaTrader 4 Custom Indicators on your charts when you join our Weekly Newsletter
 Get our Weekly Commitment of Traders Reports - See where the biggest traders (Hedge Funds and Commercial Hedgers) are positioned in the futures markets on a weekly basis.
Technical Analysis: GBP/USD
H4 Chart:
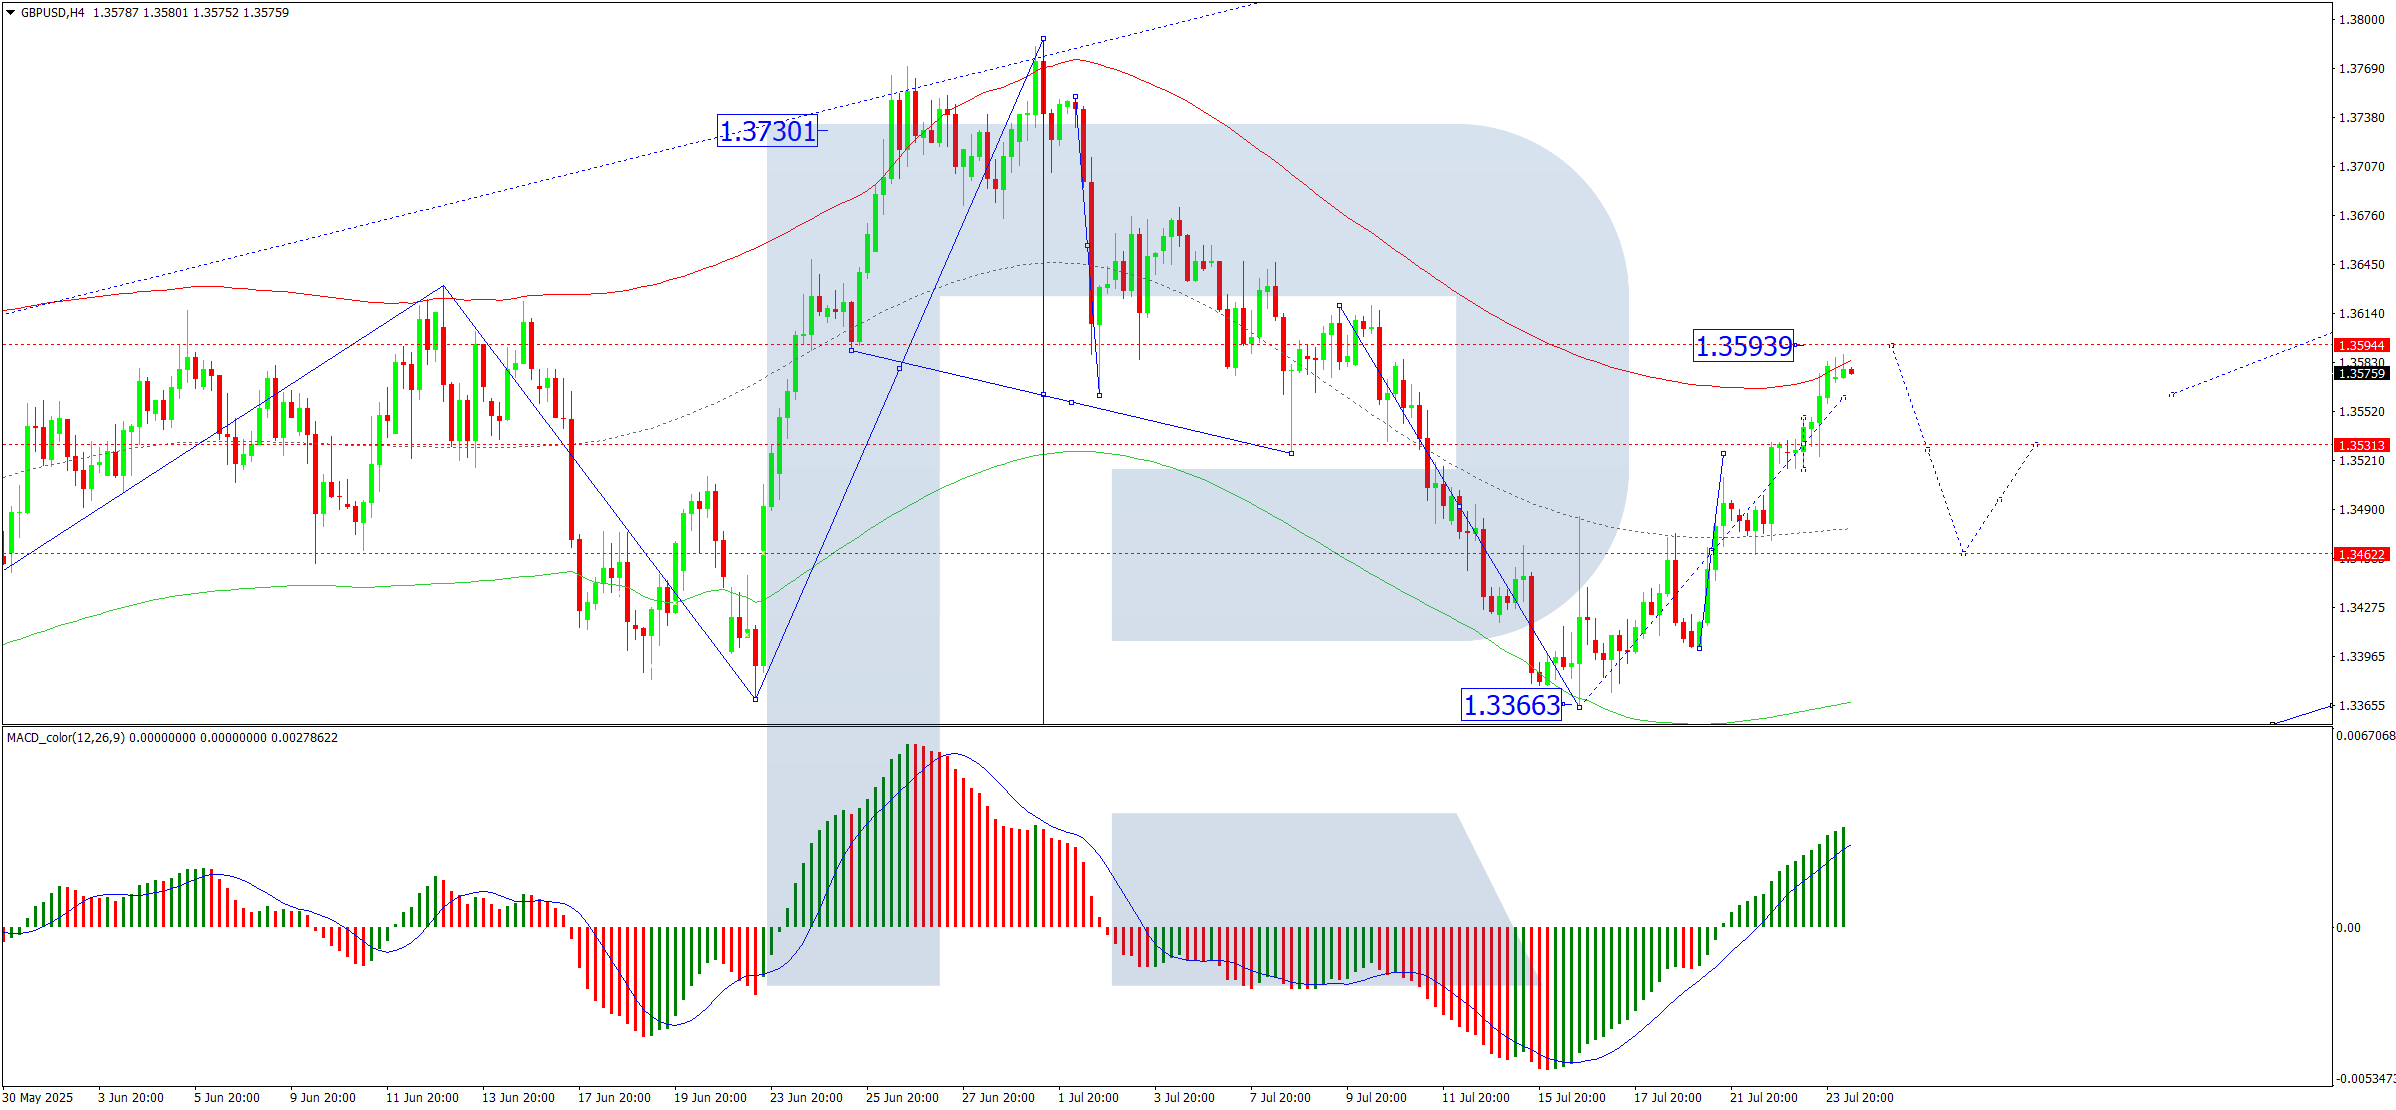
On the H4 chart, GBP/USD completed an upward wave to 1.3535, forming a consolidation range around this level. A breakout above this range could extend gains towards 1.3593. However, a subsequent correction downwards to 1.3530 remains possible. This scenario is supported by the MACD indicator, where the signal line sits above zero and is pointing firmly upward.
H1 Chart:

The H1 chart shows the pair finding support at 1.3462, with the current growth wave reaching its initial target of 1.3585. A short-term pullback to 1.3530 may occur before another upward move towards 1.3593. The Stochastic oscillator aligns with this outlook, as its signal line hovers below 5 and is trending downward towards 20.
Conclusion
The GBP/USD rally reflects an improvement in risk sentiment and anticipation of stronger UK economic data. However, fiscal concerns and technical indicators suggest potential volatility ahead. Traders should monitor PMI releases and fiscal policy announcements for further direction.
Disclaimer
Any forecasts contained herein are based on the author’s particular opinion. This analysis may not be treated as trading advice. RoboForex bears no responsibility for trading results based on trading recommendations and reviews contained herein.

- GBP/USD at Month’s Lows: The Outlook Remains Weak Jul 29, 2026
- Crude oil falls below $80 per barrel. Australia sees inflation slowdown Jul 29, 2026
- The US Tech sector hit by sell‑off. Oil prices decline on renewed negotiations Jul 28, 2026
- Gold Declines, Focus on Fed and Falling Oil Prices Jul 28, 2026
- This week will be one of the most crowded for central‑bank meetings Jul 27, 2026
- EUR/USD Ahead of a Key Week: Holding Near Lows Jul 27, 2026
- COT Metals Charts: Weekly Speculator Changes led by Copper Jul 26, 2026
- COT Bonds Charts: Speculator Bets led by SOFR 3-Months & 5-Year Bonds Jul 26, 2026
- COT Energy Charts: Weekly Speculator Bets led by WTI Crude & Natural Gas Jul 26, 2026
- COT Soft Commodities Charts: Weekly Speculator Bets led by Corn & Soybeans Jul 26, 2026
