
By RoboForex Analytical Department
Gold held steady at $3,330 per troy ounce on Monday following three consecutive days of declines. The metal faced downward pressure after news emerged of a trade agreement between the US and the EU, dampening investor interest in safe-haven assets.
On Sunday, the US and EU reached a broad trade deal, which includes a 15% tariff on most European goods, alongside commitments to invest hundreds of billions of dollars in American industry. This agreement mirrors last week’s US–Japan trade pact in structure.
Traders are now bracing for a busy week of economic events, with the Federal Reserve meeting at the centre of attention. While interest rates are expected to remain unchanged, markets will scrutinise any signals about a potential rate cut in September.
Key US labour market data will also be in focus, including JOLTS reports, ADP employment figures, and the crucial nonfarm payrolls release. Equally significant will be the PCE price index – the Fed’s preferred inflation gauge – which will indicate whether price pressures are intensifying amid new tariffs.
Technical Analysis: XAU/USD
Free Reports:
 Get our Weekly Commitment of Traders Reports - See where the biggest traders (Hedge Funds and Commercial Hedgers) are positioned in the futures markets on a weekly basis.
 Sign Up for Our Stock Market Newsletter – Get updated on News, Charts & Rankings of Public Companies when you join our Stocks Newsletter
H4 Chart:
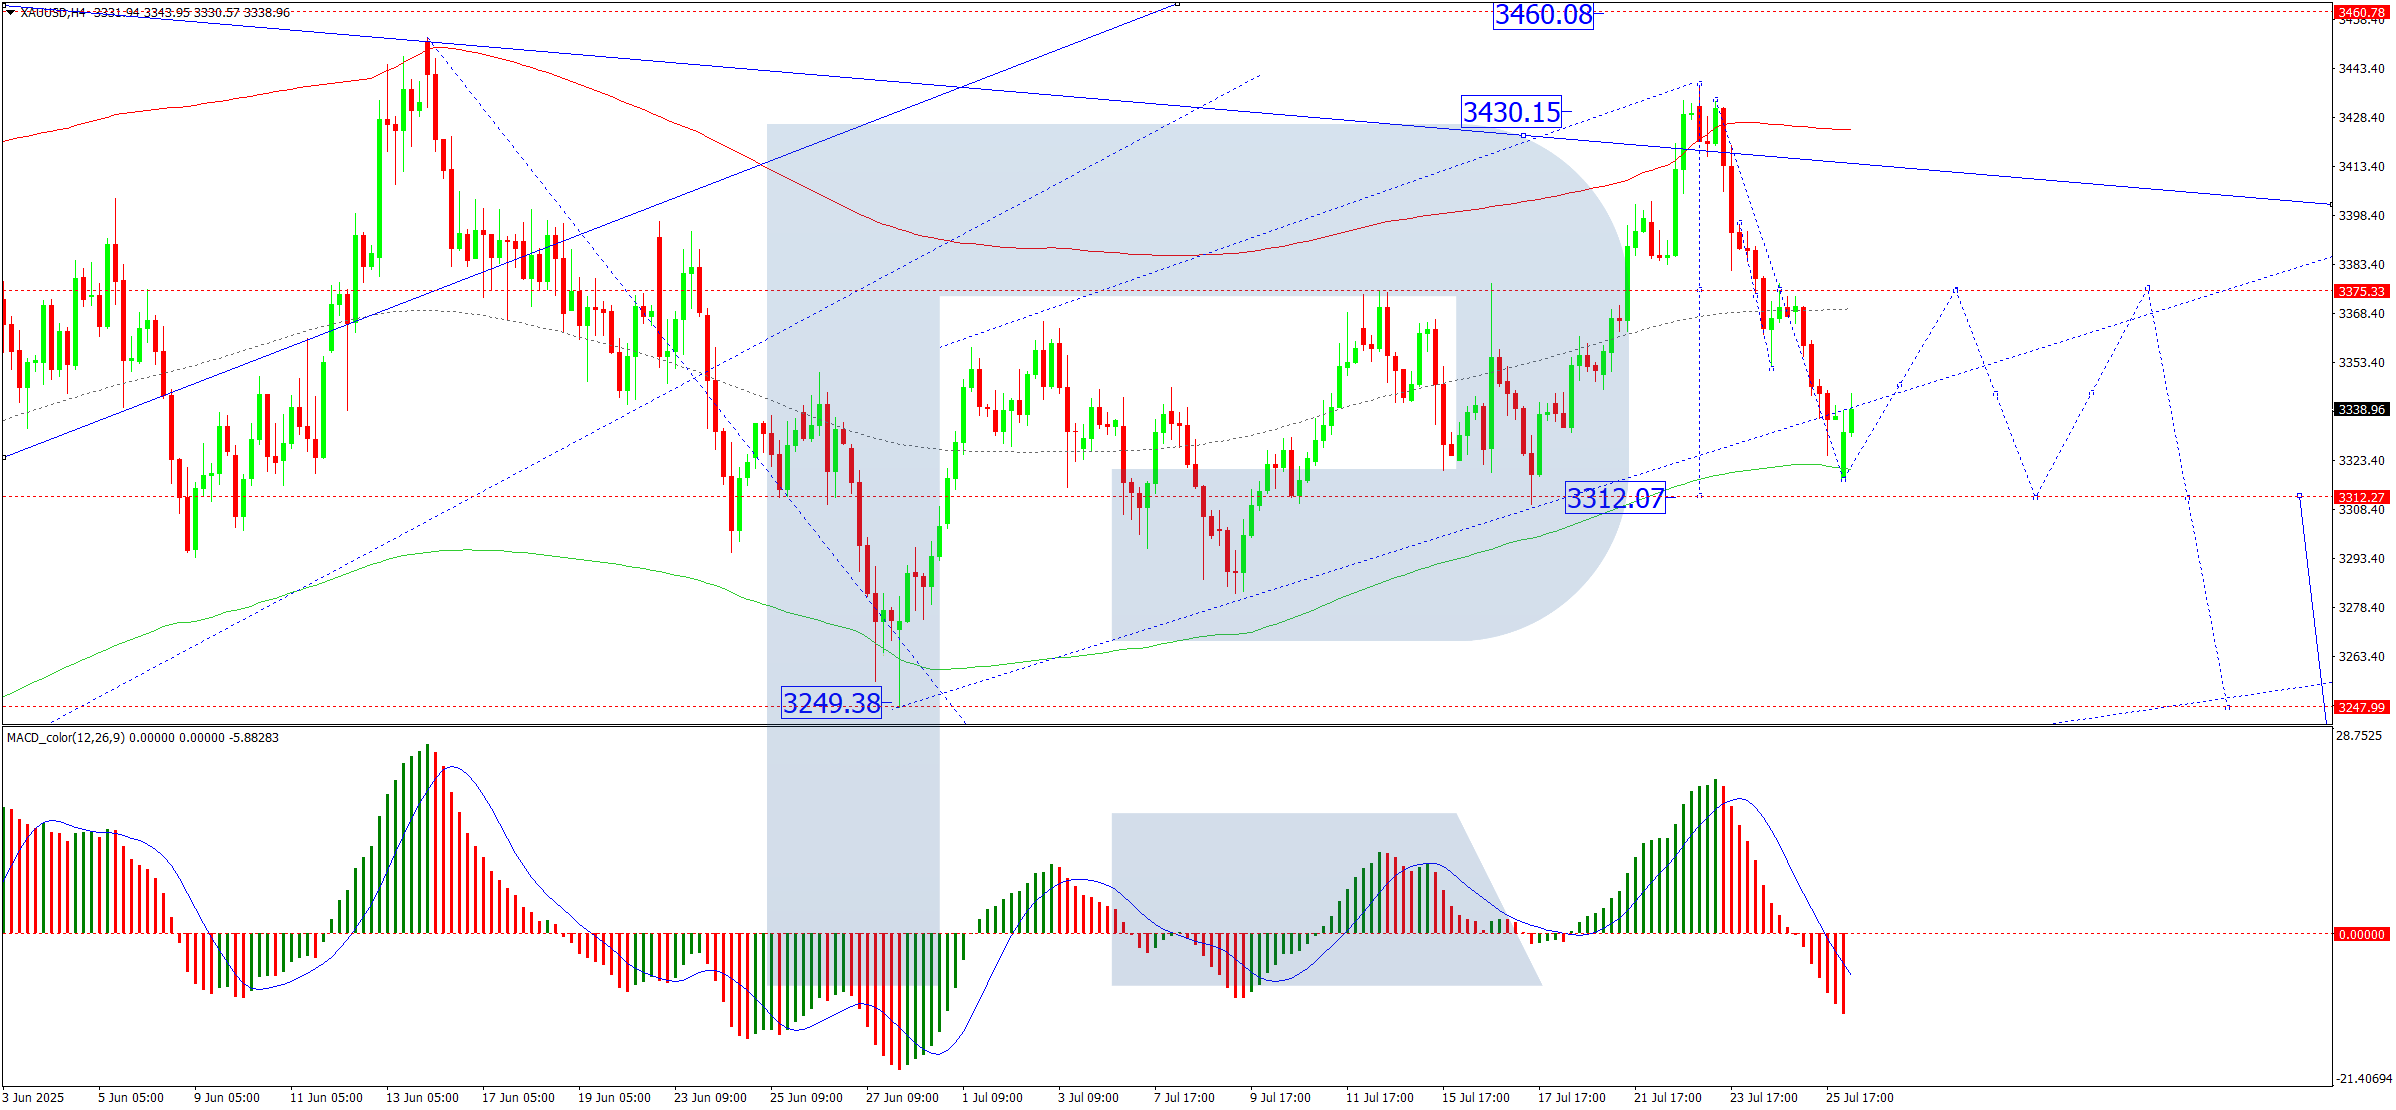
The H4 chart shows XAU/USD forming a broad consolidation range around 3,375. After breaking downward today, the market reached its local downside target at 3,318. Following this, we anticipate a possible upward correction towards 3,375 (testing from below), before a renewed decline towards 3,312. This scenario is supported by the MACD indicator, with its signal line below zero and pointing sharply downward.
H1 Chart:

On the H1 chart, the market has achieved its local decline target at 3,318. Currently, an upward impulse is forming towards 3,349. A consolidation range near 3,346 may develop, with an upside breakout potentially extending gains to 3,375. Thereafter, a new downward wave towards 3,312 could emerge. The Stochastic oscillator aligns with this outlook, as its signal line is above 50 and rising sharply towards 80.
Conclusion
Gold remains under pressure amid shifting global trade dynamics, with technical indicators suggesting further volatility ahead. Traders should monitor key US data releases and signals from the Fed for directional cues.
Disclaimer
Any forecasts contained herein are based on the author’s particular opinion. This analysis may not be treated as trading advice. RoboForex bears no responsibility for trading results based on trading recommendations and reviews contained herein.

- The US Tech sector hit by sell‑off. Oil prices decline on renewed negotiations Jul 28, 2026
- Gold Declines, Focus on Fed and Falling Oil Prices Jul 28, 2026
- This week will be one of the most crowded for central‑bank meetings Jul 27, 2026
- EUR/USD Ahead of a Key Week: Holding Near Lows Jul 27, 2026
- COT Metals Charts: Weekly Speculator Changes led by Copper Jul 26, 2026
- COT Bonds Charts: Speculator Bets led by SOFR 3-Months & 5-Year Bonds Jul 26, 2026
- COT Energy Charts: Weekly Speculator Bets led by WTI Crude & Natural Gas Jul 26, 2026
- COT Soft Commodities Charts: Weekly Speculator Bets led by Corn & Soybeans Jul 26, 2026
- The US introduces new import tariffs for 60 countries. Brent crude surpasses $100 per barrel Jul 24, 2026
- USD/JPY Breaks Records: Nothing Slows the Yen’s Decline Jul 24, 2026