
By RoboForex Analytical Department
The EUR/USD pair dropped to 1.1746 on Tuesday, with the US dollar holding a slight edge before correcting. The greenback faced pressure after Donald Trump announced new tariffs on 14 countries that have yet to secure trade agreements with the US.
Among the affected nations were major exporters such as Japan and South Korea, which will face a 25% duty on their goods starting 1 August.
Trump also signed an executive order delaying the deadline for reciprocal tariffs from 9 July to 1 August, granting more time for negotiations.
Additionally, he warned of a further 10% tariff on countries aligned with the anti-American BRICS policy, coinciding with the bloc’s summit in Brazil.
Earlier in the week, the US dollar had strengthened as trade tensions eased, and expectations of a Federal Reserve rate cut diminished. A robust June labour market report weakened the case for imminent monetary easing, with markets now all but dismissing the likelihood of a July rate reduction.
Free Reports:
 Get our Weekly Commitment of Traders Reports - See where the biggest traders (Hedge Funds and Commercial Hedgers) are positioned in the futures markets on a weekly basis.
 Download Our Metatrader 4 Indicators – Put Our Free MetaTrader 4 Custom Indicators on your charts when you join our Weekly Newsletter
Technical Analysis: EUR/USD
H4 Chart:
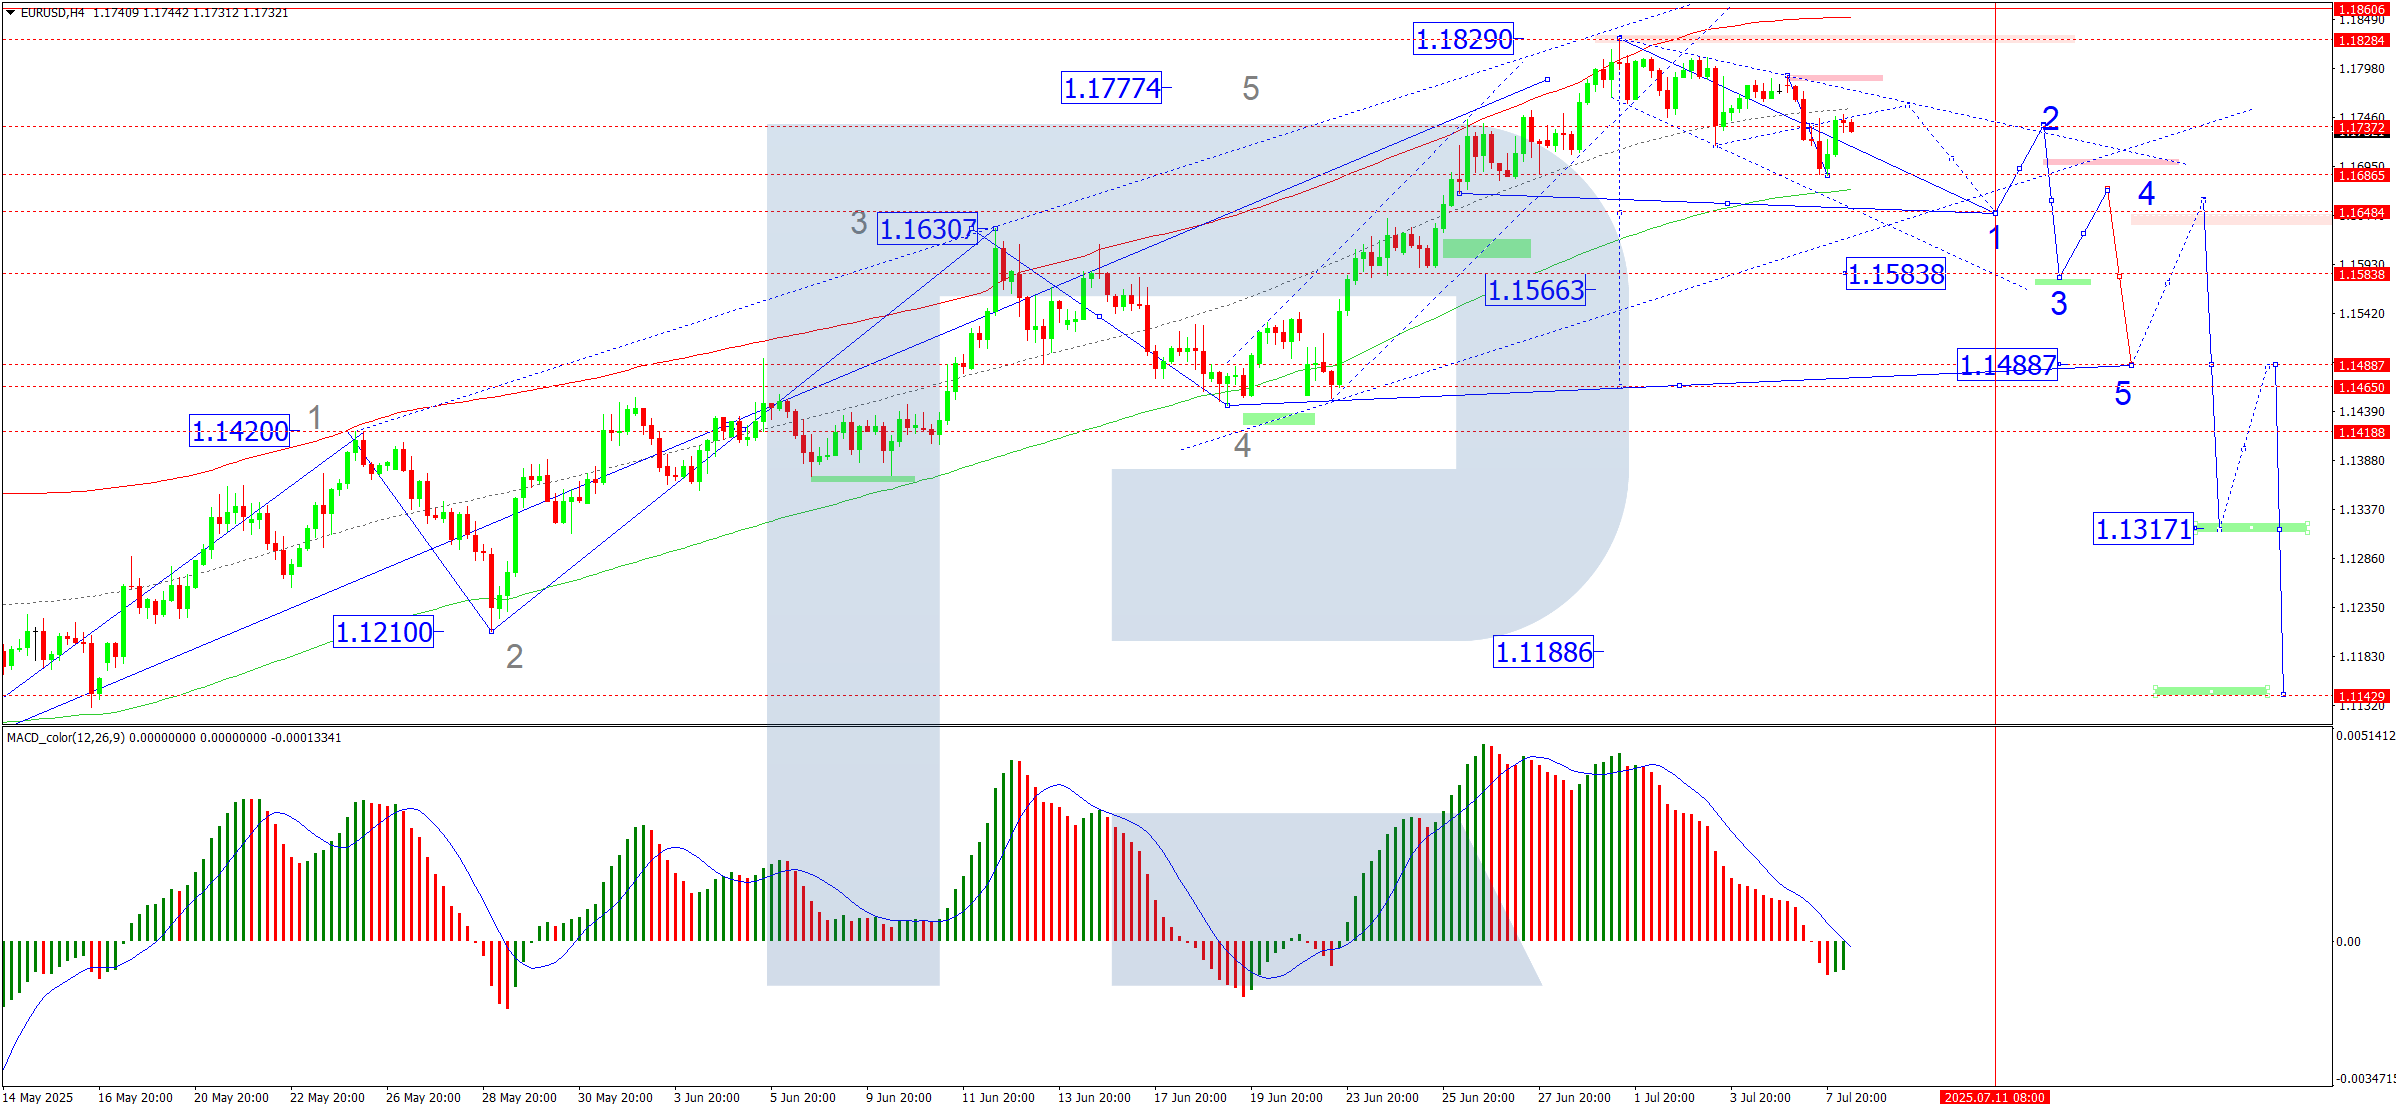
On the H4 chart, EUR/USD saw an upward wave to 1.1747, with a consolidation range now forming around this level. A potential expansion to 1.1760 is possible, followed by a likely decline to 1.1650, which would set the boundaries of this range. If the pair breaks above the range, gains could extend towards 1.1885. Conversely, a downside break may trigger a fall to 1.1611, with further downside potential towards 1.1570. This outlook is supported by the MACD indicator, where the signal line remains below zero, indicating a sharp downward trend.
H1 Chart:

On the H1 chart, the pair continues consolidating around 1.1717, with an expected upward expansion to 1.1777. However, the bullish momentum appears exhausted, and a downward wave to 1.1700 could materialise at any moment, potentially extending to 1.1611. The Stochastic oscillator reinforces this view, with its signal line below 80 and trending downward towards 20.
Conclusion
The EUR/USD remains under pressure amid uncertainties over tariffs and shifting expectations for the Fed’s rate outlook. Technically, the pair shows limited upside potential, with key support levels at 1.1650 (H4) and 1.1611 (H1). A break lower could accelerate declines, while an upward breakout may signal a short-term recovery.
Disclaimer
Any forecasts contained herein are based on the author’s particular opinion. This analysis may not be treated as trading advice. RoboForex bears no responsibility for trading results based on trading recommendations and reviews contained herein.

- This week will be one of the most crowded for central‑bank meetings Jul 27, 2026
- EUR/USD Ahead of a Key Week: Holding Near Lows Jul 27, 2026
- COT Metals Charts: Weekly Speculator Changes led by Copper Jul 26, 2026
- COT Bonds Charts: Speculator Bets led by SOFR 3-Months & 5-Year Bonds Jul 26, 2026
- COT Energy Charts: Weekly Speculator Bets led by WTI Crude & Natural Gas Jul 26, 2026
- COT Soft Commodities Charts: Weekly Speculator Bets led by Corn & Soybeans Jul 26, 2026
- The US introduces new import tariffs for 60 countries. Brent crude surpasses $100 per barrel Jul 24, 2026
- USD/JPY Breaks Records: Nothing Slows the Yen’s Decline Jul 24, 2026
- Oil prices reached a 6‑week high. The AUD strengthened on the back of a strong labor‑market report Jul 23, 2026
- EUR/USD Recovers as Dollar Weakens Jul 23, 2026