
By RoboForex Analytical Department
Gold prices held firm at 3,373 USD per troy ounce on Thursday, remaining near a four-week high. The metal’s strength is being fuelled by mounting concerns over the US economic slowdown, boosting demand for non-yielding safe-haven assets.
US data signals economic distress
The latest reports revealed a contraction in the US service sector for the first time in nearly a year – an alarming sign of broader weakness.
Additionally, the ADP employment report indicated a notable slowdown in private-sector hiring. In May, only 37,000 new jobs were added, far below the expected 111,000 and lower than April’s figure of 60,000.
These weak indicators have bolstered expectations that the Federal Reserve will cut interest rates at least twice this year. Such prospects typically favour gold, as the metal becomes more attractive in a low-rate environment.
Despite Donald Trump’s repeated calls for rate cuts, Fed officials remain cautious, especially in light of persistent trade risks and volatile global conditions.
Free Reports:
 Sign Up for Our Stock Market Newsletter – Get updated on News, Charts & Rankings of Public Companies when you join our Stocks Newsletter
 Get our Weekly Commitment of Traders Reports - See where the biggest traders (Hedge Funds and Commercial Hedgers) are positioned in the futures markets on a weekly basis.
Attention now shifts to the US non-farm payrolls report, due on Friday, which could provide further clarity on the Fed’s policy path.
Technical analysis of XAU/USD
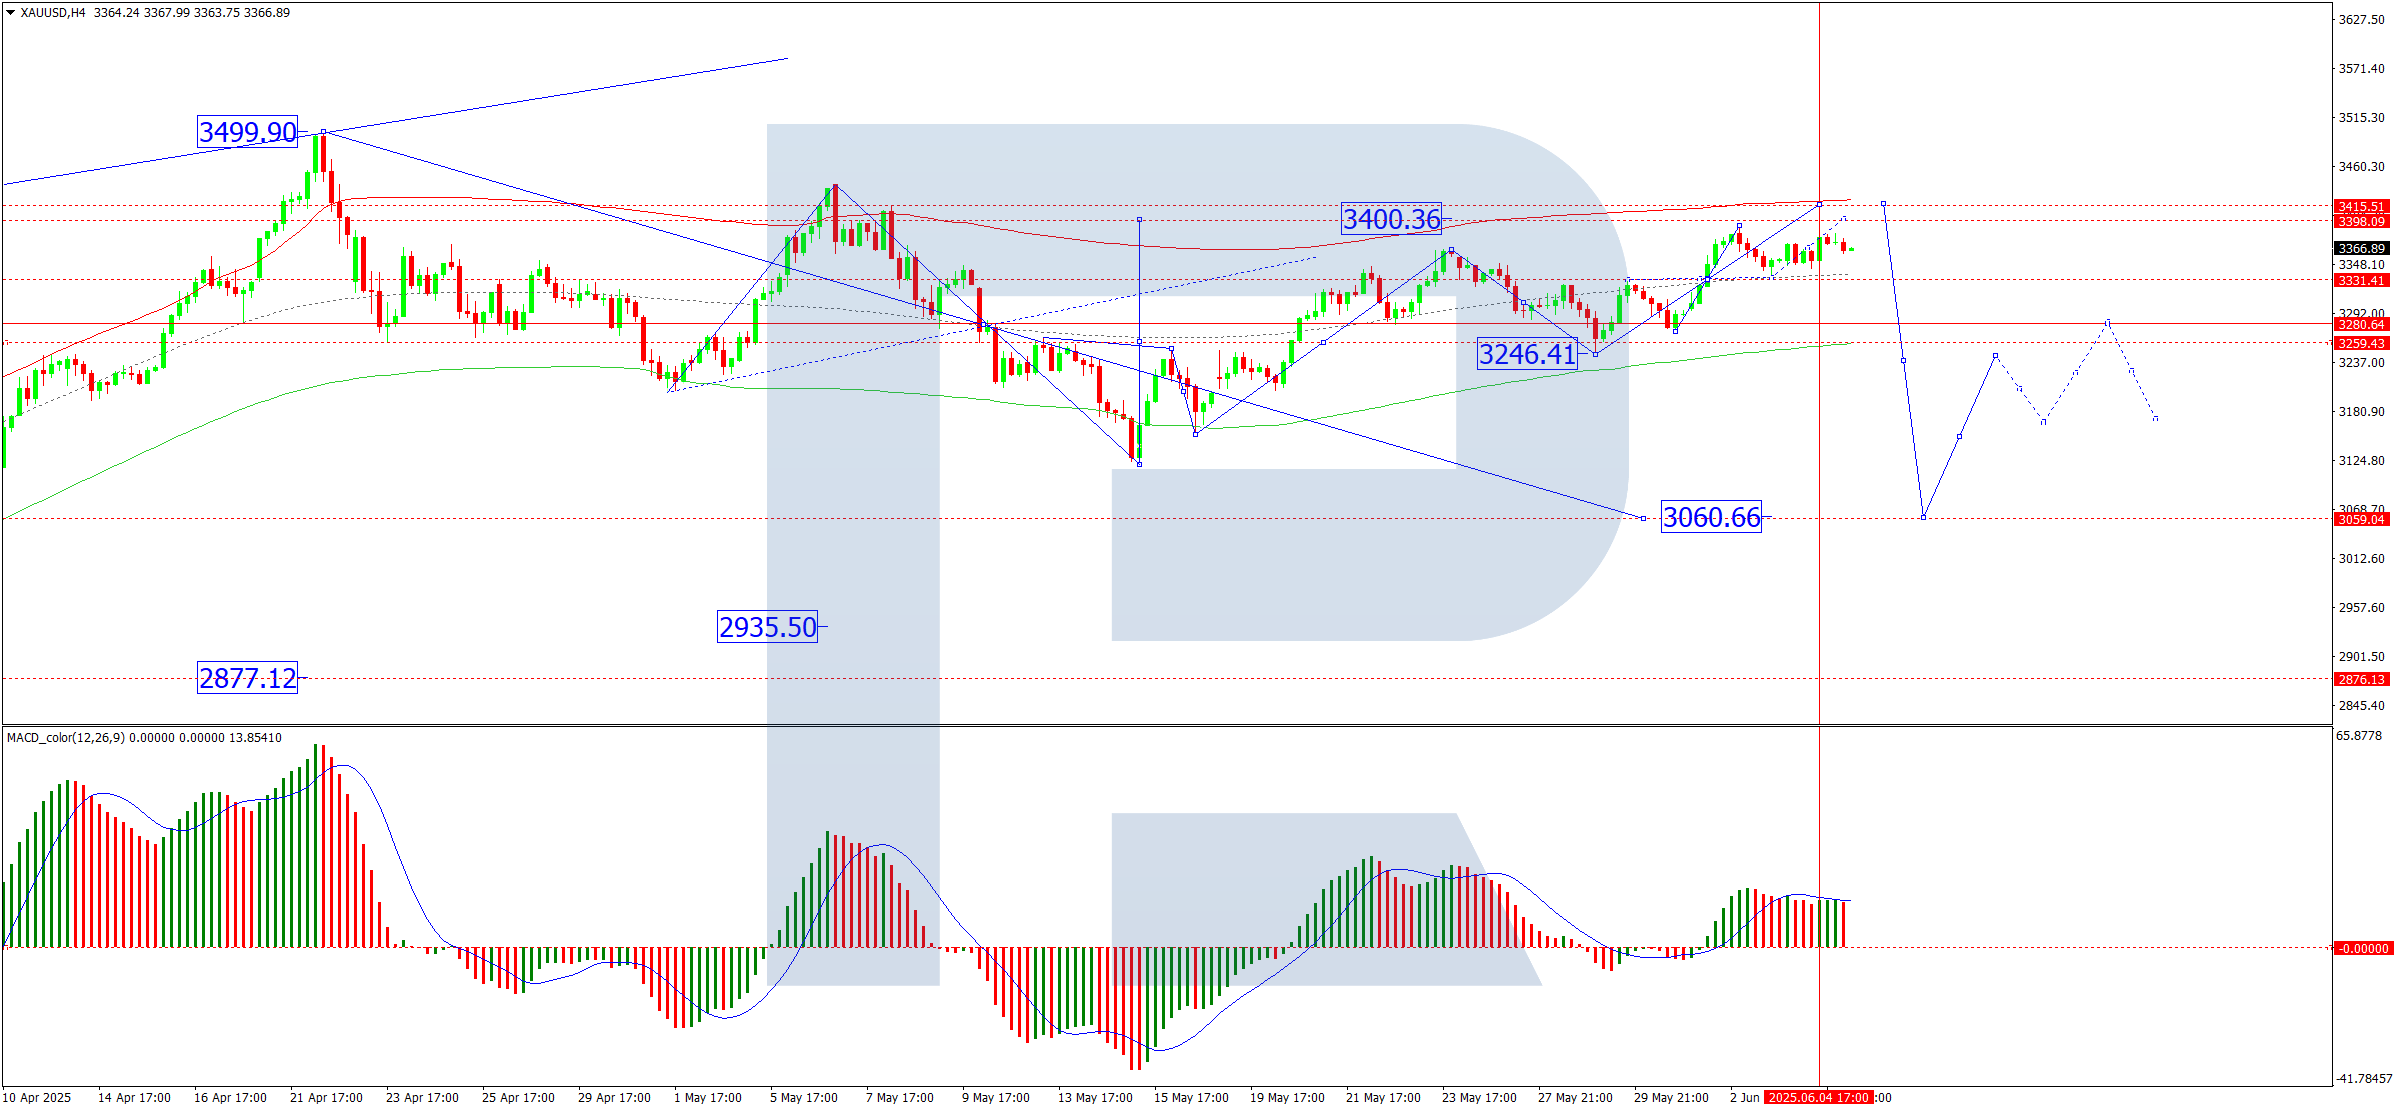
On the H4 chart, gold is forming the fifth wave of growth, targeting 3,415 USD. The entire structure is viewed as a corrective phase following the previous decline. Once this wave is complete, a new downtrend towards 3,060 USD is anticipated. The MACD indicator supports this scenario, with its signal line above zero and pointing sharply upwards, indicating continued bullish momentum for now.

On the H1 chart, gold formed a consolidation range around 3,331 USD, then broke out upwards, reaching the local target of 3,391 USD. A correction to 3,333 USD has already played out. Currently, the market is developing the final leg of the fifth wave towards 3,417 USD, with a compact consolidation zone forming around 3,374 USD. If gold breaks upwards, the next resistance will be at 3,404 USD, followed by a pullback to 3,374 USD, and then further growth to the 3,417 USD target. The Stochastic oscillator confirms this scenario, with its signal line below 20 and moving sharply upwards towards 80, signalling the potential for near-term upward continuation.
Conclusion
Gold remains well-supported by deteriorating US economic data and expectations of monetary easing by the Fed. As long as concerns over employment, services activity, and trade uncertainty persist, gold’s upward momentum is likely to continue. Key technical levels include support at 3,333 USD and resistance at 3,404-3,417 USD, with broader downside risk emerging only after the current bullish wave concludes.
Disclaimer
Any forecasts contained herein are based on the author’s particular opinion. This analysis may not be treated as trading advice. RoboForex bears no responsibility for trading results based on trading recommendations and reviews contained herein.

- GBP/USD at Month’s Lows: The Outlook Remains Weak Jul 29, 2026
- Crude oil falls below $80 per barrel. Australia sees inflation slowdown Jul 29, 2026
- The US Tech sector hit by sell‑off. Oil prices decline on renewed negotiations Jul 28, 2026
- Gold Declines, Focus on Fed and Falling Oil Prices Jul 28, 2026
- This week will be one of the most crowded for central‑bank meetings Jul 27, 2026
- EUR/USD Ahead of a Key Week: Holding Near Lows Jul 27, 2026
- COT Metals Charts: Weekly Speculator Changes led by Copper Jul 26, 2026
- COT Bonds Charts: Speculator Bets led by SOFR 3-Months & 5-Year Bonds Jul 26, 2026
- COT Energy Charts: Weekly Speculator Bets led by WTI Crude & Natural Gas Jul 26, 2026
- COT Soft Commodities Charts: Weekly Speculator Bets led by Corn & Soybeans Jul 26, 2026
