
By RoboForex Analytical Department
EUR/USD dropped to 1.1110 on Tuesday, with the US dollar surging by over 1% in the previous trading session. The rally was driven by market reactions to news of a provisional agreement between China and the US to reduce tariffs, which helped alleviate global recession fears.
Key factors driving EUR/USD movement
Washington and Beijing have agreed to cut tariffs to 30% and 10%, respectively, for 90 days.
Meanwhile, US Treasury Secretary Scott Bessent confirmed plans to meet with Chinese representatives again in the coming weeks to begin negotiations on a broader trade deal.
The tariff reductions boosted market sentiment towards the dollar, which had previously faced pressure over concerns that President Donald Trump’s trade policies were diminishing the appeal of US assets. However, market nervousness is likely to persist until the White House establishes stable trade terms with all key partners.
Free Reports:
 Get our Weekly Commitment of Traders Reports - See where the biggest traders (Hedge Funds and Commercial Hedgers) are positioned in the futures markets on a weekly basis.
 Download Our Metatrader 4 Indicators – Put Our Free MetaTrader 4 Custom Indicators on your charts when you join our Weekly Newsletter
Attention now turns to the latest US inflation report, which may show how the new tariff policy affects prices.
Technical analysis: EUR/USD
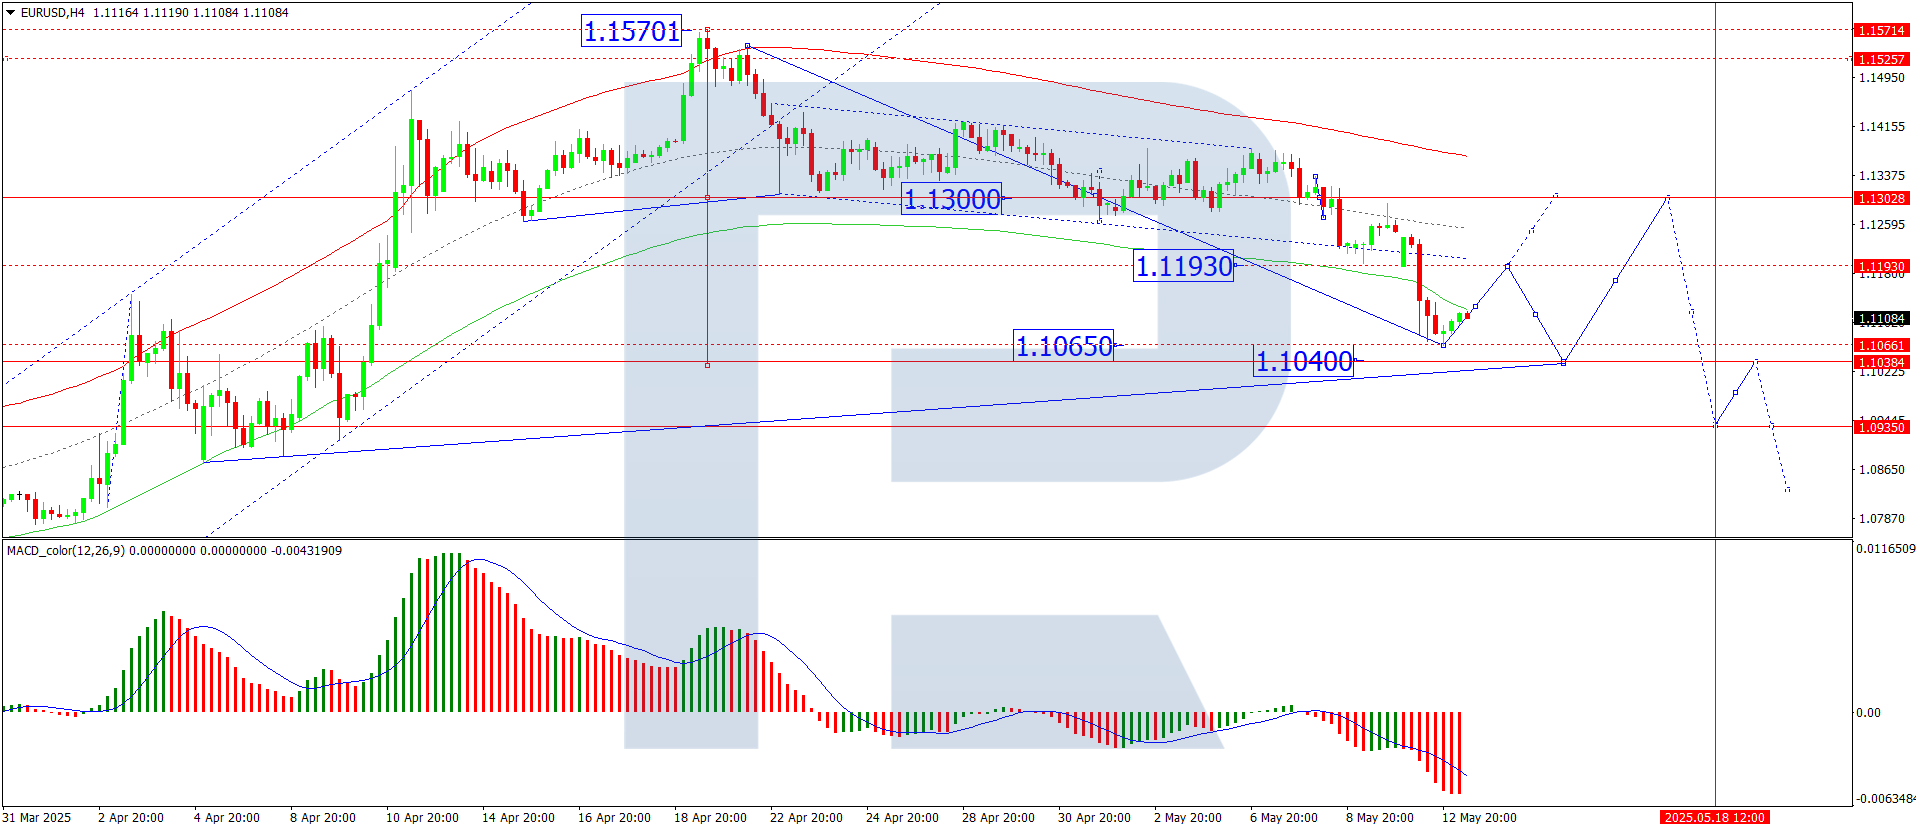
On the H4 chart, EUR/USD broke below 1.1190, completing the third wave of decline towards 1.1065. Today, we anticipate a corrective wave retesting 1.1190 (from below). Once this correction concludes, a new downward wave towards 1.1040 is expected. This scenario is technically confirmed by the MACD indicator, with its signal line below zero and pointing decisively downward.
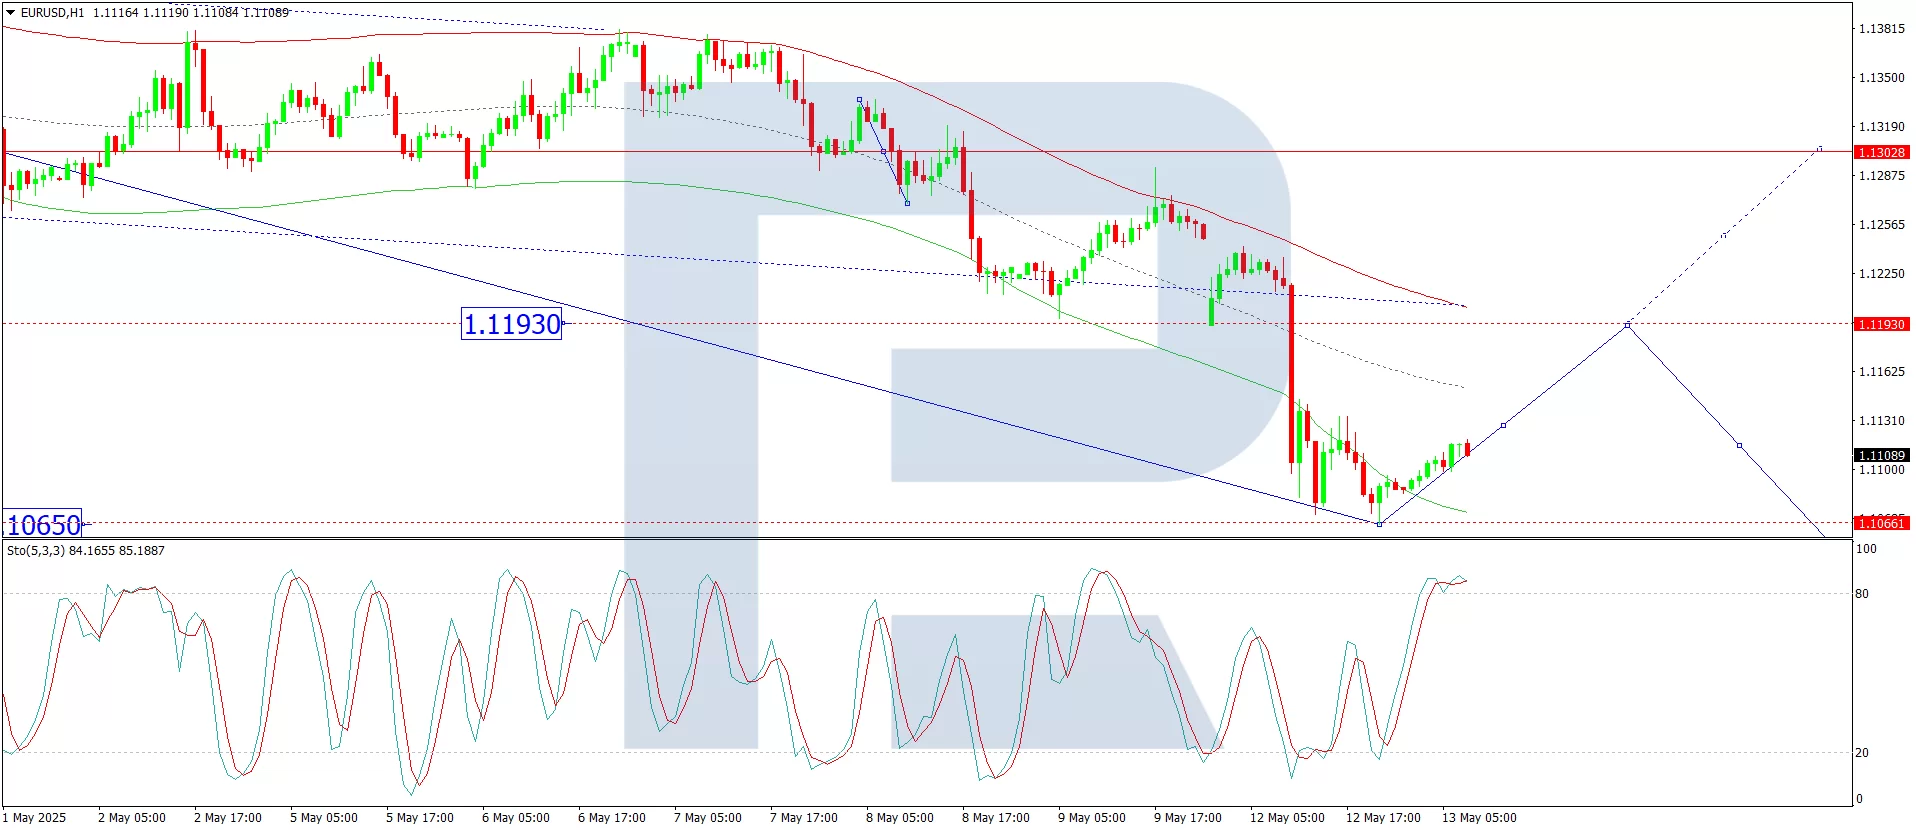
On the H1 chart, the market has achieved the local downside target at 1.1065. Today, a potential rebound to 1.1126 is in focus. If this level is breached upwards, a further correction towards 1.1190 may follow. Subsequently, the downward trend could resume, targeting 1.1040. This outlook is supported by the Stochastic oscillator, whose signal line is above 80 but poised to decline towards 20.
Conclusion
The US dollar’s resurgence reflects improved risk sentiment following the US-China tariff truce, though uncertainty lingers over long-term trade relations. Technically, EUR/USD remains under pressure, with further downside likely after a brief correction.
Disclaimer
Any forecasts contained herein are based on the author’s particular opinion. This analysis may not be treated as trading advice. RoboForex bears no responsibility for trading results based on trading recommendations and reviews contained herein.

- COT Metals Charts: Weekly Speculator Changes led by Copper Jul 26, 2026
- COT Bonds Charts: Speculator Bets led by SOFR 3-Months & 5-Year Bonds Jul 26, 2026
- COT Energy Charts: Weekly Speculator Bets led by WTI Crude & Natural Gas Jul 26, 2026
- COT Soft Commodities Charts: Weekly Speculator Bets led by Corn & Soybeans Jul 26, 2026
- The US introduces new import tariffs for 60 countries. Brent crude surpasses $100 per barrel Jul 24, 2026
- USD/JPY Breaks Records: Nothing Slows the Yen’s Decline Jul 24, 2026
- Oil prices reached a 6‑week high. The AUD strengthened on the back of a strong labor‑market report Jul 23, 2026
- EUR/USD Recovers as Dollar Weakens Jul 23, 2026
- Bitcoin rose to $66,000. The New Zealand dollar continues to strengthen Jul 22, 2026
- Inflationary pressure is easing in Canada. In New Zealand, on the contrary, inflation is rising Jul 21, 2026
