
By RoboForex Analytical Department
Gold prices dipped below 2,620.00 USD per troy ounce on Friday, marking a second consecutive session of decline. The value of the precious metal continues to be influenced by developments in US economic indicators and expectations surrounding the Federal Reserve’s monetary policy.
Investor attention is particularly focused on the upcoming November US labour market data, poised to provide further insights into the Federal Reserve’s monetary policy directions. Recent statistics indicating an increase in unemployment claims suggest potential cooling in the employment sector. This data arrives just ahead of the highly anticipated nonfarm payrolls report, which is crucial for gauging the health of the US labour market.
The probability of a Fed interest rate cut in December currently stands at 70%, with expectations of a 25-basis-point reduction. Such a cut would likely benefit Gold, as lower interest rates decrease the opportunity cost of holding non-yielding assets like Gold.
On the demand side, despite a decline in interest in jewellery, China’s investment in Gold remains robust, according to World Bank data, providing fundamental support to Gold prices.
Technical analysis of XAU/USD
Free Reports:
 Get our Weekly Commitment of Traders Reports - See where the biggest traders (Hedge Funds and Commercial Hedgers) are positioned in the futures markets on a weekly basis.
 Sign Up for Our Stock Market Newsletter – Get updated on News, Charts & Rankings of Public Companies when you join our Stocks Newsletter
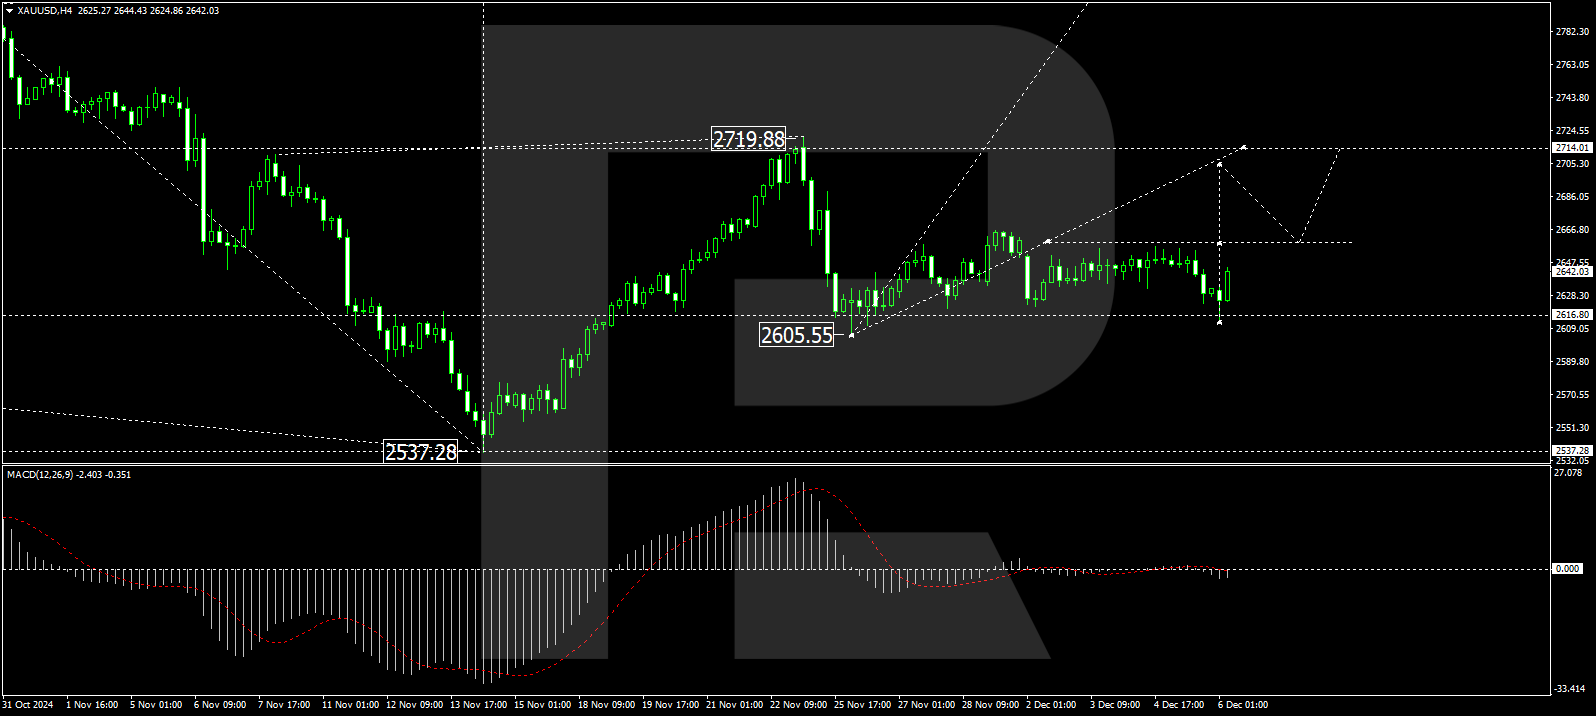
H4 chart: Gold has experienced a growth wave, peaking at 2,666.35, followed by a correction down to 2,616.60. A new growth impulse towards 2,663.00 is underway, and we anticipate the formation of a consolidation range around this level. If the price breaks upward, it may continue its ascent towards 2,714.00. The MACD indicator supports this bullish outlook, with its signal line hovering near zero and pointing upwards.
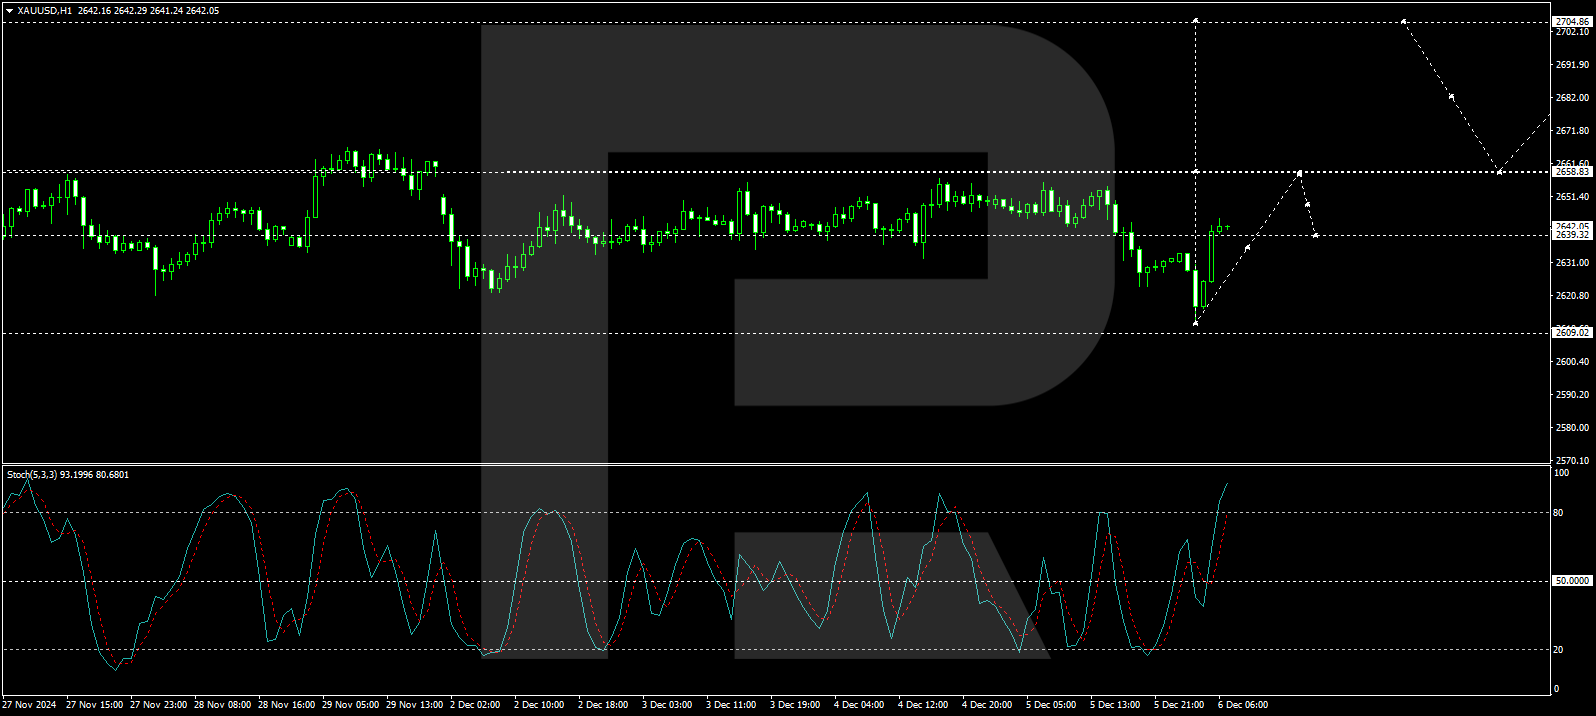
H1 chart: the XAU/USD has completed a growth impulse to 2,640.00 and is likely to form a narrow consolidation range around this level. An upward breakout would suggest the continuation of the growth impulse to 2,663.00, potentially extending to 2,666.00. This scenario is corroborated by the Stochastic oscillator, with its signal line currently above 50 and trending upwards towards 80, indicating strong upward momentum.
Disclaimer
Any forecasts contained herein are based on the author’s particular opinion. This analysis may not be treated as trading advice. RoboForex bears no responsibility for trading results based on trading recommendations and reviews contained herein.

- GBP/USD at Month’s Lows: The Outlook Remains Weak Jul 29, 2026
- Crude oil falls below $80 per barrel. Australia sees inflation slowdown Jul 29, 2026
- The US Tech sector hit by sell‑off. Oil prices decline on renewed negotiations Jul 28, 2026
- Gold Declines, Focus on Fed and Falling Oil Prices Jul 28, 2026
- This week will be one of the most crowded for central‑bank meetings Jul 27, 2026
- EUR/USD Ahead of a Key Week: Holding Near Lows Jul 27, 2026
- COT Metals Charts: Weekly Speculator Changes led by Copper Jul 26, 2026
- COT Bonds Charts: Speculator Bets led by SOFR 3-Months & 5-Year Bonds Jul 26, 2026
- COT Energy Charts: Weekly Speculator Bets led by WTI Crude & Natural Gas Jul 26, 2026
- COT Soft Commodities Charts: Weekly Speculator Bets led by Corn & Soybeans Jul 26, 2026