
By RoboForex Analytical Department
The EUR/USD pair declined to 1.0504 on Thursday, influenced by investor reactions to the latest US inflation data. The November US Consumer Price Index (CPI) showed a rise of 0.3% month-over-month, aligning with forecasts but indicating a slight acceleration from the previous 0.2% increase. This recent uptick has adjusted market expectations significantly, reducing hopes for a substantial interest rate cut by the Federal Reserve in the upcoming meeting. According to CME Watch, the likelihood of a 25-basis-point cut is now pegged at 94%.
US inflation stands at 2.7% year-on-year, slightly up from 2.6%, suggesting persistent inflationary pressures despite elevated interest rates. This scenario indicates that consumers remain active, which could complicate the Federal Reserve’s monetary policy strategy.
Meanwhile, the political situation in France has been factored into the EUR/USD rates, though some underlying tensions persist.
Attention now turns to the European Central Bank (ECB), whose interest rate is 3.4%. Market participants are keenly awaiting whether the ECB will adjust rates in its upcoming meeting.
Technical analysis of EUR/USD
Free Reports:
 Download Our Metatrader 4 Indicators – Put Our Free MetaTrader 4 Custom Indicators on your charts when you join our Weekly Newsletter
 Get our Weekly Commitment of Traders Reports - See where the biggest traders (Hedge Funds and Commercial Hedgers) are positioned in the futures markets on a weekly basis.
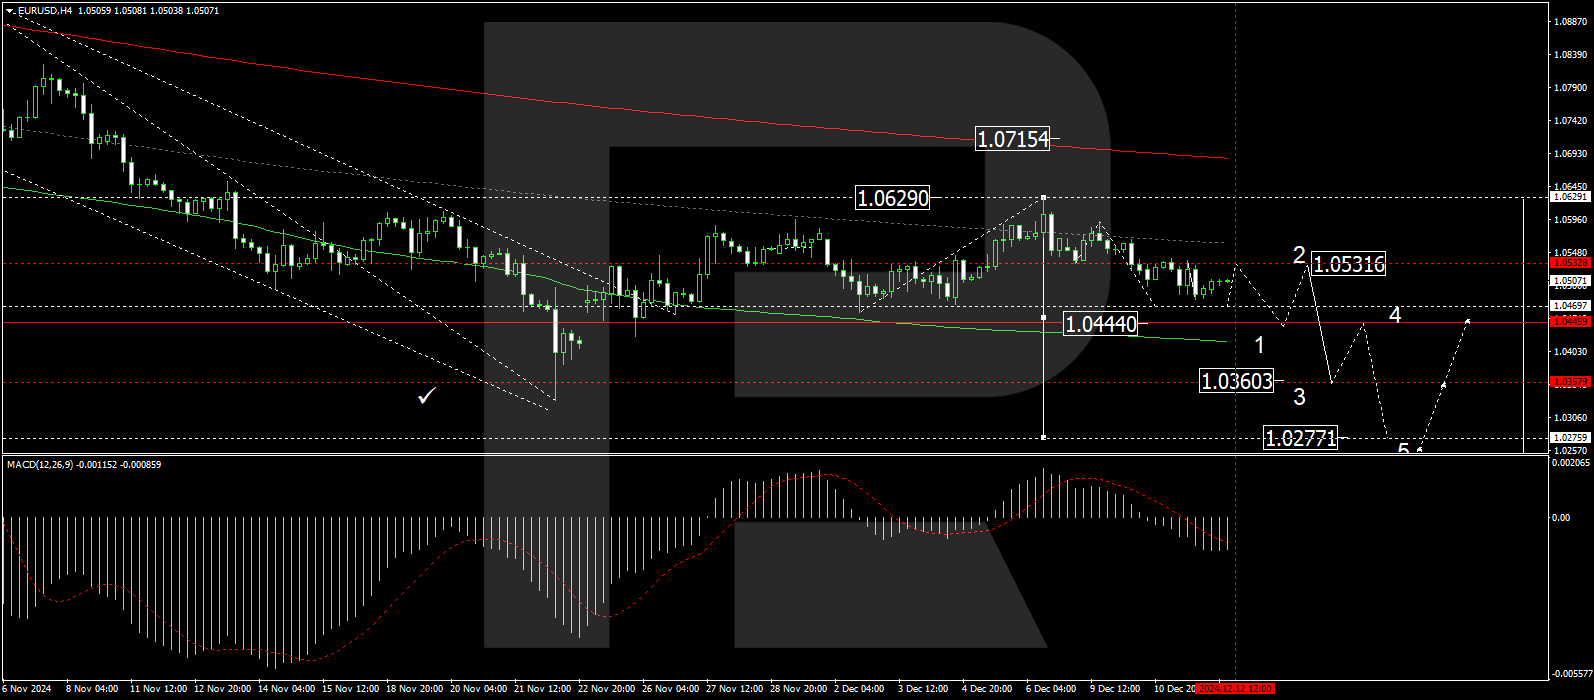
H4 chart: the EUR/USD has recently completed a decline to the level of 1.0479 and appears poised to continue this downward trend towards 1.0470. Following this, a corrective move to 1.0535 is anticipated, and once this is complete, another decline to 1.0444 could follow. This bearish outlook is supported by the MACD indicator, with its signal line positioned below zero and trending downwards, indicating continued selling pressure.
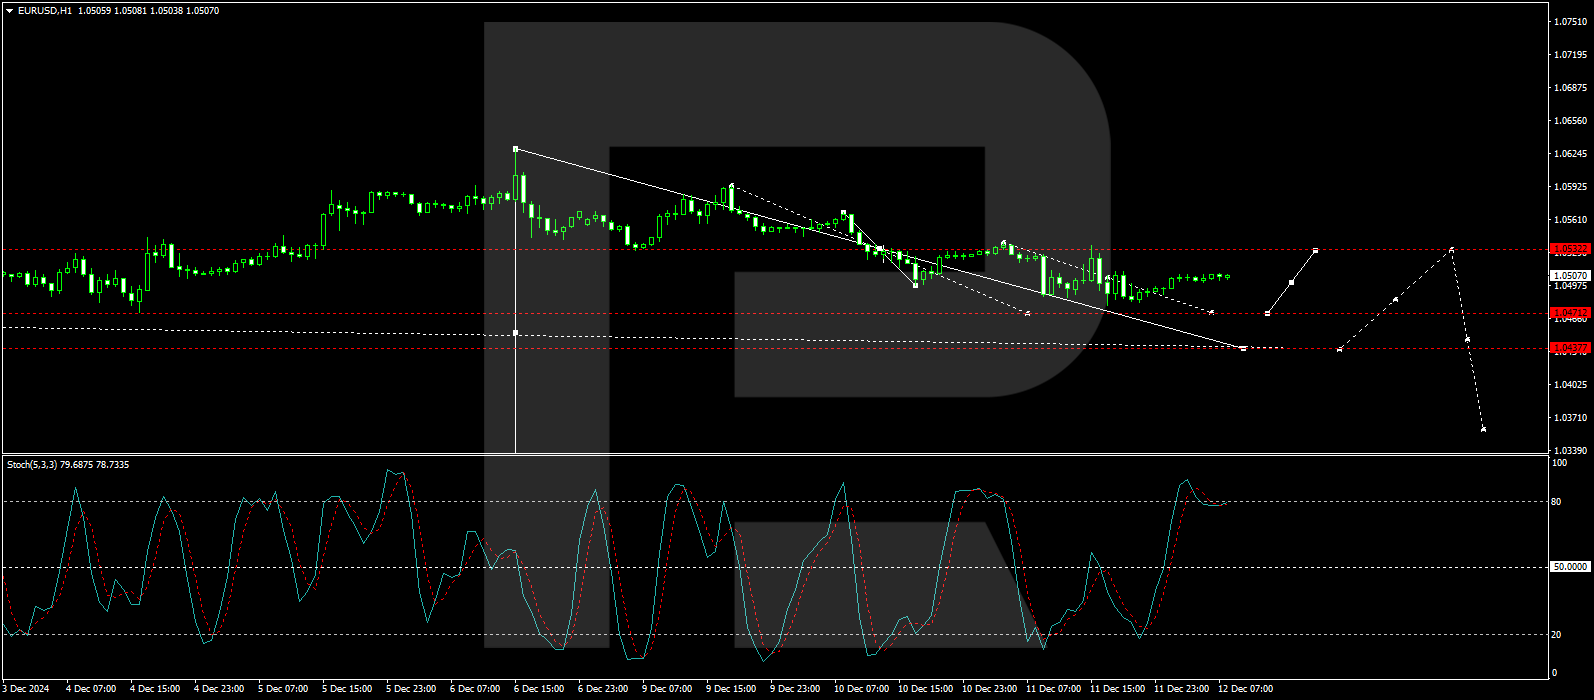
H1 chart: the pair is developing a downward structure towards 1.0470, currently consolidating around 1.0505. A breakout below this level could lead to reaching the target level of 1.0470. Subsequently, a rebound to 1.0535 might occur, followed by a further decline to 1.0444. This scenario is supported by the Stochastic Oscillator, with its signal line above 80 but poised to drop towards 20, suggesting a potential shift from overbought conditions to lower levels.
Disclaimer
Any forecasts contained herein are based on the author’s particular opinion. This analysis may not be treated as trading advice. RoboForex bears no responsibility for trading results based on trading recommendations and reviews contained herein.

- GBP/USD at Month’s Lows: The Outlook Remains Weak Jul 29, 2026
- Crude oil falls below $80 per barrel. Australia sees inflation slowdown Jul 29, 2026
- The US Tech sector hit by sell‑off. Oil prices decline on renewed negotiations Jul 28, 2026
- Gold Declines, Focus on Fed and Falling Oil Prices Jul 28, 2026
- This week will be one of the most crowded for central‑bank meetings Jul 27, 2026
- EUR/USD Ahead of a Key Week: Holding Near Lows Jul 27, 2026
- COT Metals Charts: Weekly Speculator Changes led by Copper Jul 26, 2026
- COT Bonds Charts: Speculator Bets led by SOFR 3-Months & 5-Year Bonds Jul 26, 2026
- COT Energy Charts: Weekly Speculator Bets led by WTI Crude & Natural Gas Jul 26, 2026
- COT Soft Commodities Charts: Weekly Speculator Bets led by Corn & Soybeans Jul 26, 2026
