
By RoboForex Analytical Department
The AUD/USD pair continues its downward trajectory, reaching a four-week low of 0.6386 on Wednesday. This decline is primarily influenced by the Reserve Bank of Australia’s (RBA) decision to maintain interest rates at 4.35% per annum for the ninth consecutive meeting. This decision, which was widely expected, reflects the central bank’s cautious approach despite ongoing inflation concerns.
RBA Governor Michelle Bullock emphasised that the central bank’s current stance on inflation is deliberate, aiming to signal responsiveness to softening economic indicators. The market currently anticipates a high likelihood of an RBA rate cut in February, with a 63% probability of a 25-basis-point reduction. Expectations are set for further cuts at subsequent meetings through May as investors and analysts factor in potential easing measures.
AUD supporters’ focus is shifting towards Thursday’s release of Australian employment data, which could provide further clues about the economic outlook and influence RBA policy decisions.
The Australian dollar is also experiencing significant pressure from a strengthening US dollar, which adds to its challenges.
Technical analysis of AUD/USD
Free Reports:
 Get our Weekly Commitment of Traders Reports - See where the biggest traders (Hedge Funds and Commercial Hedgers) are positioned in the futures markets on a weekly basis.
 Sign Up for Our Stock Market Newsletter – Get updated on News, Charts & Rankings of Public Companies when you join our Stocks Newsletter
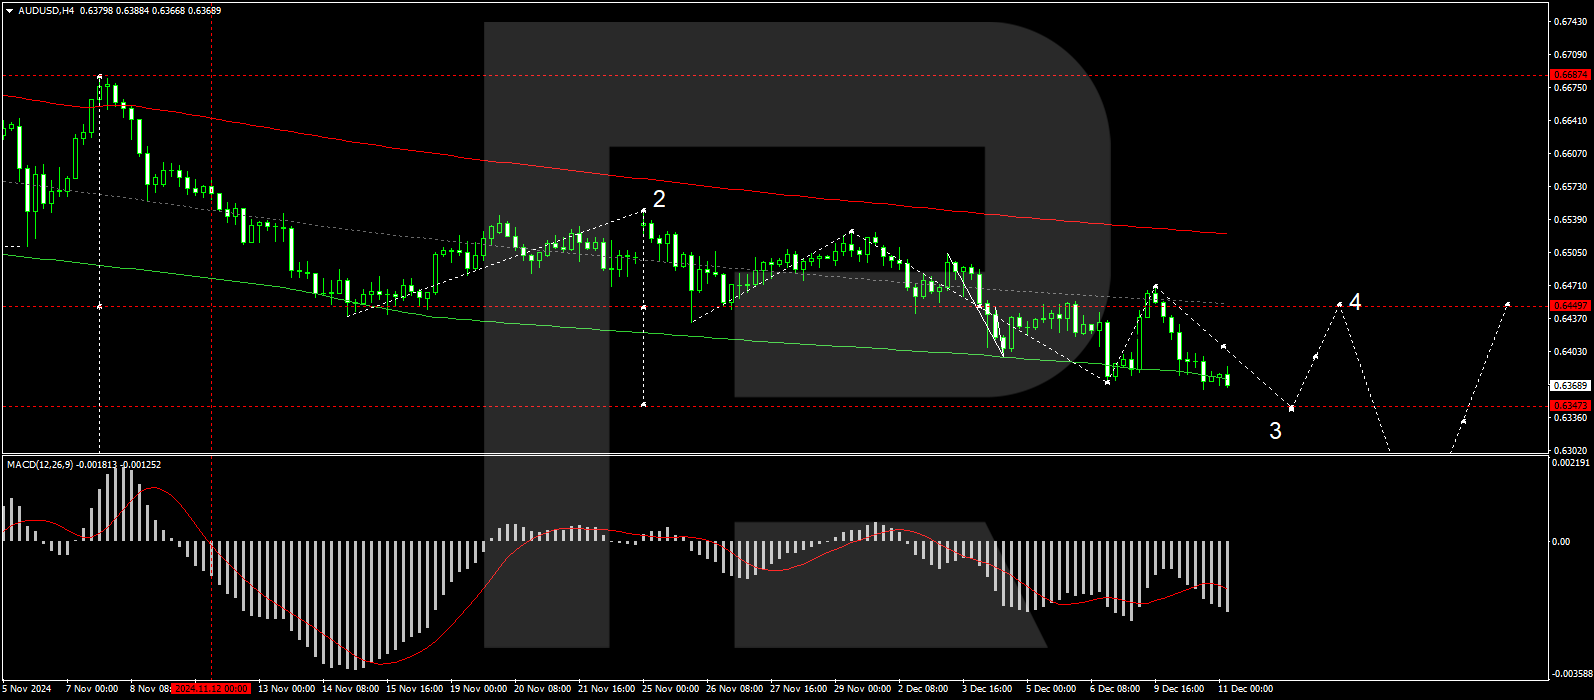
H4 chart: the AUD/USD is navigating a wide consolidation range centred around 0.6450. The pair is currently forming a downward movement towards 0.6347. Upon reaching this level, a corrective rise to 0.6450 is expected, potentially testing this resistance from below before possibly initiating a new decline towards 0.6215. This bearish outlook is supported by the MACD indicator, whose signal line is below zero and continues to trend downwards.
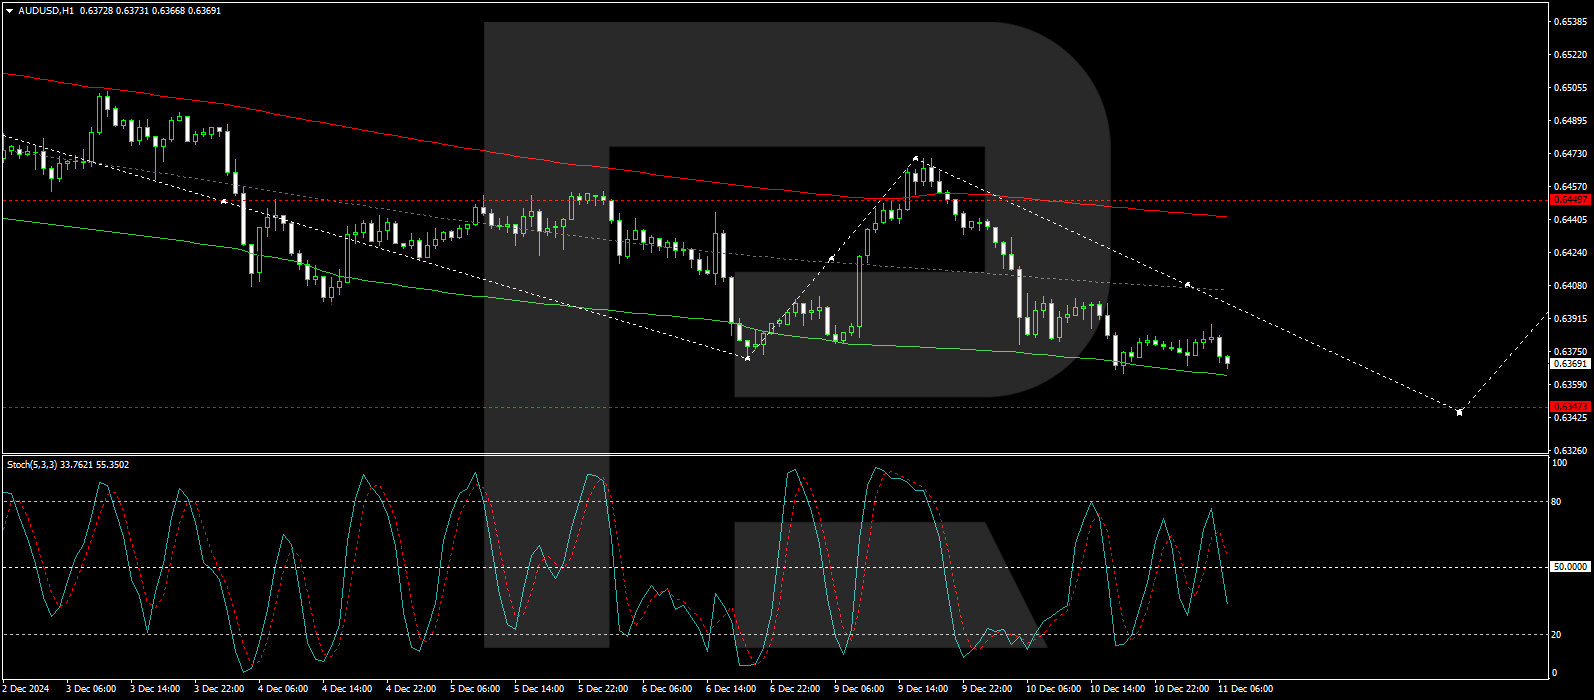
H1 chart: the market is actively developing a downward wave towards 0.6347. After hitting this target, a corrective movement towards 0.6450 could occur. The Stochastic oscillator, with its signal line below 50 and moving towards 20, confirms this scenario, indicating the potential for further downward pressure before any corrective rebound.
Disclaimer
Any forecasts contained herein are based on the author’s particular opinion. This analysis may not be treated as trading advice. RoboForex bears no responsibility for trading results based on trading recommendations and reviews contained herein.

- GBP/USD at Month’s Lows: The Outlook Remains Weak Jul 29, 2026
- Crude oil falls below $80 per barrel. Australia sees inflation slowdown Jul 29, 2026
- The US Tech sector hit by sell‑off. Oil prices decline on renewed negotiations Jul 28, 2026
- Gold Declines, Focus on Fed and Falling Oil Prices Jul 28, 2026
- This week will be one of the most crowded for central‑bank meetings Jul 27, 2026
- EUR/USD Ahead of a Key Week: Holding Near Lows Jul 27, 2026
- COT Metals Charts: Weekly Speculator Changes led by Copper Jul 26, 2026
- COT Bonds Charts: Speculator Bets led by SOFR 3-Months & 5-Year Bonds Jul 26, 2026
- COT Energy Charts: Weekly Speculator Bets led by WTI Crude & Natural Gas Jul 26, 2026
- COT Soft Commodities Charts: Weekly Speculator Bets led by Corn & Soybeans Jul 26, 2026