
By RoboForex Analytical Department
The US dollar has seen a significant increase in strength against the Euro, with the EUR/USD pair falling to 1.0770 by Monday morning. This movement is largely attributed to the recent release of robust employment sector reports in the US for January, which have shifted investor expectations regarding the Federal Reserve’s interest rate decisions.
The Nonfarm Payrolls (NFP) report for January revealed an impressive increase of 353 thousand jobs, far exceeding the anticipated 187 thousand. Additionally, December’s NFP figures were revised upwards to 333 thousand. Average hourly earnings also saw a notable rise of 0.6% month-over-month, doubling the forecast. These indicators suggest mounting inflationary pressures, potentially complicating the Federal Reserve’s plans to normalize interest rates.
The latest employment data effectively solidified market projections, especially after Federal Reserve officials indicated that a rate cut in March was unlikely, with adjustments possibly being postponed until May.
EUR/USD Technical Analysis

Free Reports:
 Get our Weekly Commitment of Traders Reports - See where the biggest traders (Hedge Funds and Commercial Hedgers) are positioned in the futures markets on a weekly basis.
 Download Our Metatrader 4 Indicators – Put Our Free MetaTrader 4 Custom Indicators on your charts when you join our Weekly Newsletter
The H4 chart analysis of EUR/USD indicates that a corrective wave reaching 1.0896 has concluded. The market is now in the midst of a downward trend aiming for 1.0722. Upon achieving this target, a potential corrective movement to 1.0808 might occur, serving as a test from below, before the trend resumes its descent towards 1.0682. This outlook is supported by the MACD indicator, which is positioned below zero and indicates a continued downward trajectory.
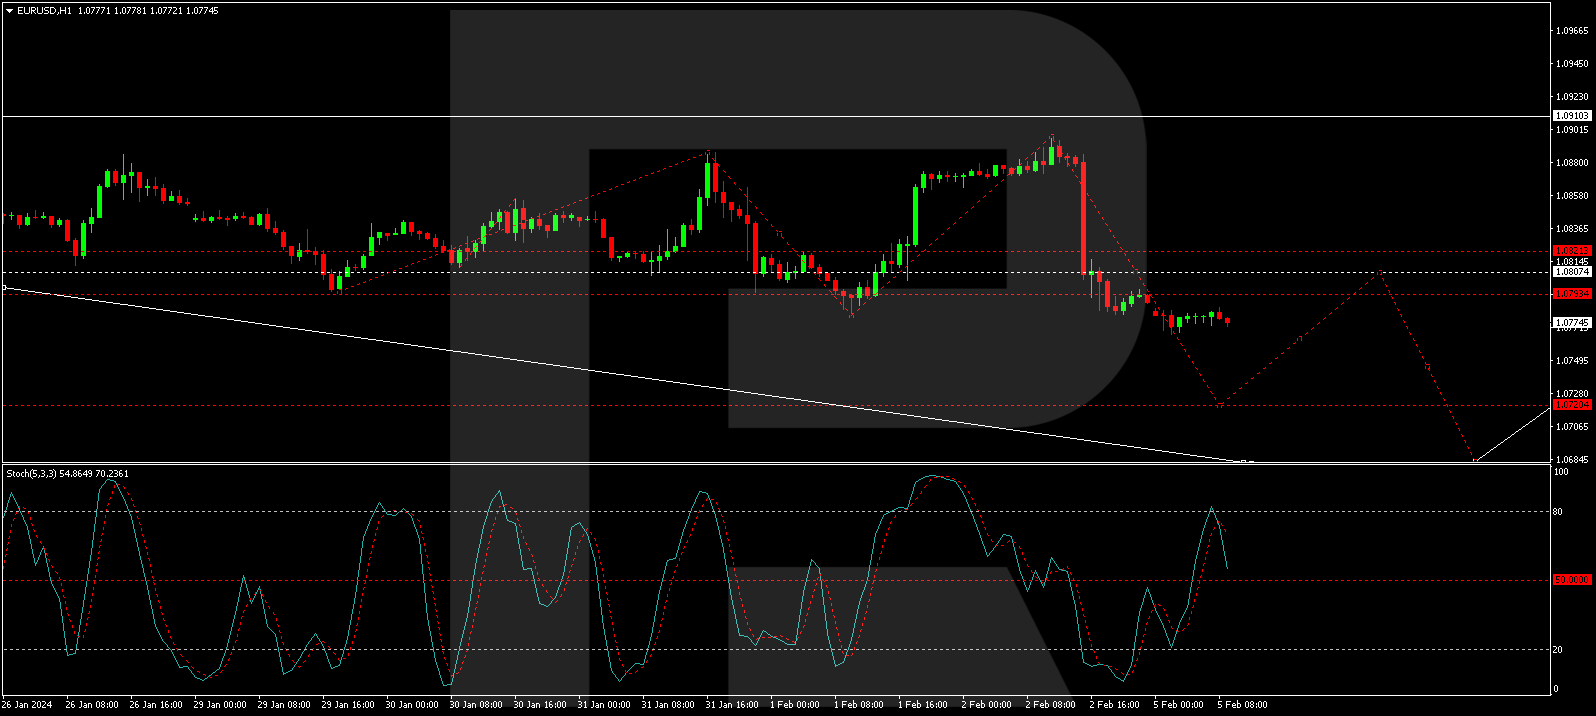
On the H1 chart, the EUR/USD pair has established a consolidation range around 1.0808. Following a downward breakout, the declining wave is expected to proceed towards 1.0722. After reaching this milestone, a correction back to 1.0808 could be anticipated. The Stochastic oscillator, with its signal line currently above 50, suggests a potential climb to 80 before a decline to 20, reinforcing the bearish scenario outlined.
Disclaimer
Any forecasts contained herein are based on the author’s particular opinion. This analysis may not be treated as trading advice. RoboForex bears no responsibility for trading results based on trading recommendations and reviews contained herein.

- COT Metals Charts: Speculator Bets led by Gold, Copper & Platinum Aug 9, 2026
- COT Bonds Charts: Speculator Bets led by 2-Year Bonds & US Treasury Bonds Aug 9, 2026
- COT Energy Charts: Speculator Bets led by Heating Oil & Bloomberg Index Aug 9, 2026
- COT Soft Commodities Charts: Speculator Bets led by Sugar & Cotton Aug 9, 2026
- The Central Bank of Mexico kept its interest rate unchanged. Iran plans to introduce strict bans for US and Israeli vessels in the Strait of Hormuz Aug 7, 2026
- USD/JPY Holds Firm: Yen Loses Some Support Aug 7, 2026
- Australian trade balance returned to positive territory Aug 6, 2026
- Results in Line for Most Reporting Companies Aug 5, 2026
- Stock indices continue to break records. Oil is falling amid intensified diplomatic dialogue between the US and Iran Aug 5, 2026
- USD/JPY Holds Steady After Intervention: Outlook Remains Uncertain Aug 5, 2026
