By InvestMacro.com | #stocks #NVDA #NVIDIA
NVIDIA Corporation End of Day Update: October 13 2022
The NVIDIA Corporation (NVDA) stock finished the day with an advance of 9.01 percent and closed the day around the 119.60 price level, according to unofficial data at the New York close.
NVIDIA, a technology company that is recognized as a leader in GPU units for computers, opened the trading day at 109.71 price level with the high of the day at 120.78 and the low of the day falling to 108.13.
NVIDIA’s stock had fallen in four out of the previous five days and has dipped to trading at its lowest levels in two years, dating back to August 2020.
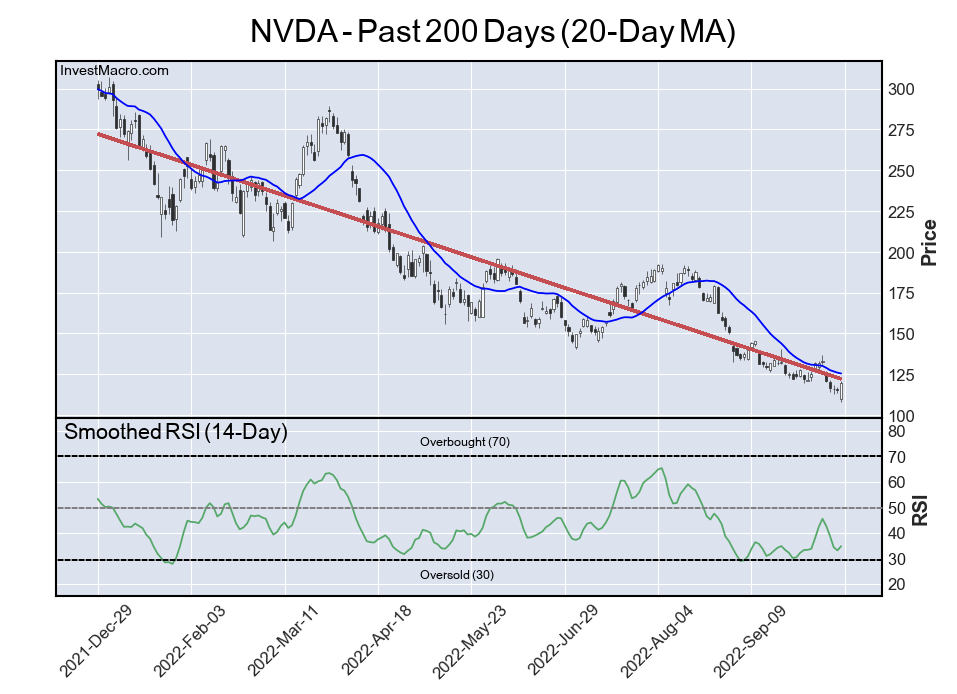
The NVDA Trend is Lower, RSI level is Bearish
The stock is currently trending sharply lower over the past 200 trading days, according to the linear regression line (red) seen on the chart below. NVDA has lost approximately over half of its share price value since December 2021.
The Relative Strength Index, an indicator that can identify overbought (above 70) and oversold levels (below 30), shows that the current RSI is at a 38.5 score. This is a Bearish reading on the daily time-frame.
Free Reports:
 Get our Weekly Commitment of Traders Reports - See where the biggest traders (Hedge Funds and Commercial Hedgers) are positioned in the futures markets on a weekly basis.
 Download Our Metatrader 4 Indicators – Put Our Free MetaTrader 4 Custom Indicators on your charts when you join our Weekly Newsletter
NVDA Price Returns (Closing Price Changes)
The NVDA is lower by -2.13 percent over the past 10 days while seeing a step lower by -20.76 over the past 30 days. The 90-day change is -36.32 while the 180-day return and the 365-day return are -47.46 and -16.59, respectively.
By InvestMacro.com – – Get our stock market newsletter for stock rankings, charts & updates

- GBP/USD Starts the Week on a Strong Footing Aug 10, 2026
- The US stock indices finished the session with solid gains following the release of weak labor‑market data Aug 10, 2026
- COT Metals Charts: Speculator Bets led by Gold, Copper & Platinum Aug 9, 2026
- COT Bonds Charts: Speculator Bets led by 2-Year Bonds & US Treasury Bonds Aug 9, 2026
- COT Energy Charts: Speculator Bets led by Heating Oil & Bloomberg Index Aug 9, 2026
- COT Soft Commodities Charts: Speculator Bets led by Sugar & Cotton Aug 9, 2026
- The Central Bank of Mexico kept its interest rate unchanged. Iran plans to introduce strict bans for US and Israeli vessels in the Strait of Hormuz Aug 7, 2026
- USD/JPY Holds Firm: Yen Loses Some Support Aug 7, 2026
- Australian trade balance returned to positive territory Aug 6, 2026
- Results in Line for Most Reporting Companies Aug 5, 2026
