
By InvestMacro.com | #stocks #NFLX #Netflix
Netflix, Inc. End of Day Update: October 13 2022
The Netflix, Inc. (NFLX) stock jumped today with a strong increase of 9.32 percent and closed the day around the 232.51 price level, according to unofficial data at the New York close.
Netflix, a leading technology streaming company, opened the trading day at 212.69 price level with the high of the day at 234.47 and the low of the day at 211.73.
There was news out today for Netflix as the company announced a new ad-supported membership plan that will cost $6.99 in the US and international markets.
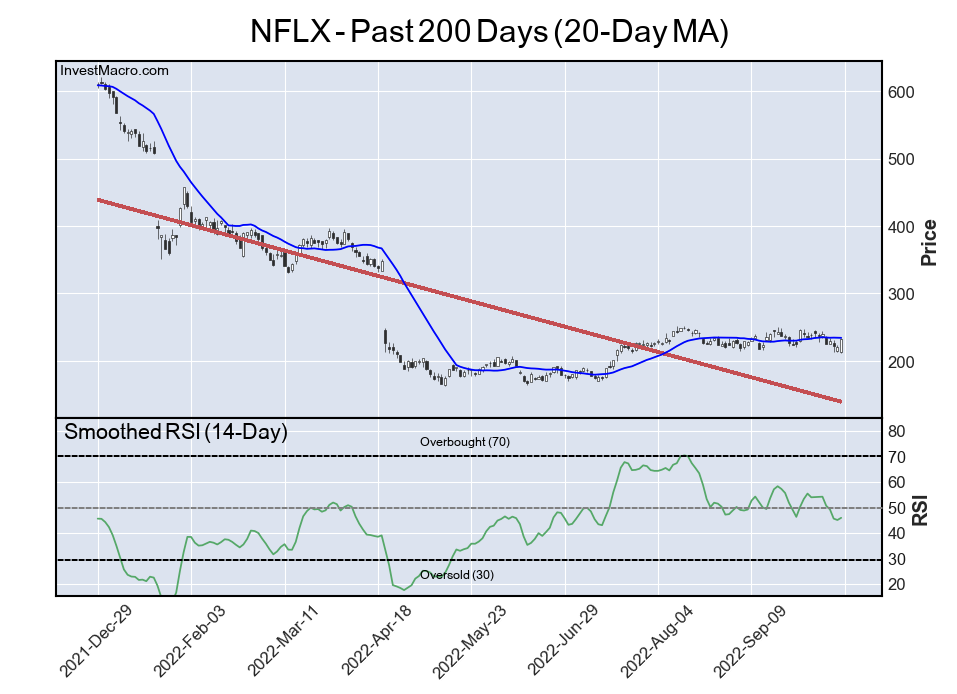
The NFLX Trend is Down, RSI level is Bullish
The stock is currently trending lower over the past 200 trading days, according to the linear regression line (red) seen on the chart below. Despite the downtrend this year, the Netflix stock has started to see a moderate uptick from its lows of earlier in the year and the 20-day moving average has been flat in the past few months.
The Relative Strength Index, an indicator that can identify overbought (above 70) and oversold levels (below 30), shows that the current RSI is at a 50.7 score. This is a Bullish reading on the daily time-frame of the standard RSI Indicator. The chart below uses a smoothed (moving average of levels) version of the RSI that will lag slightly but be more consistent.
Free Reports:
 Get our Weekly Commitment of Traders Reports - See where the biggest traders (Hedge Funds and Commercial Hedgers) are positioned in the futures markets on a weekly basis.
 Sign Up for Our Stock Market Newsletter – Get updated on News, Charts & Rankings of Public Companies when you join our Stocks Newsletter
NFLX Price Returns (Closing Price Changes)
The NFLX has declined by -3.00 percent over the past 10 days while seeing a move higher by 4.00 over the past 30 days. The 90-day change is 17.94 while the 180-day return and the 365-day return are -35.36 and -53.79, respectively.
By InvestMacro.com – – Get our stock market newsletter for stock rankings, charts & updates

- Geopolitical and macroeconomic conditions continue to pressure market sentiment Jul 20, 2026
- USD/JPY Poised to Continue Gains as Expensive Oil and Lack of Support Weigh on Yen Jul 20, 2026
- COT Metals Charts: Weekly Speculator Bets led by Copper & Steel Jul 18, 2026
- COT Bonds Charts: Weekly Speculator Bets led by 2-Year, SOFR 3M & 5-Year Bonds Jul 18, 2026
- COT Energy Charts: Weekly Speculator Bets led by Brent Oil & Heating Oil Jul 18, 2026
- COT Soft Commodities Charts: Weekly Speculator Bets led by Wheat, Corn & Soybean Meal Jul 18, 2026
- The Bank of Canada kept its interest rate unchanged. Platinum prices reached a three‑week high Jul 16, 2026
- Stock indices rose after the release of US inflation data. China’s GDP slowed sharply Jul 15, 2026
- GBP/USD Awaits Political News: What Will Happen Next Jul 15, 2026
- USD/JPY Holds at Highs: Pressure Lingers on Yen Jul 14, 2026