By InvestMacro.com | #stocks #INTC #RSIDivergence
Intel Corporation End of Day Update: October 13 2022
The Intel Corporation (INTC) stock finished the day with an advance of 6.86 percent and closed the day around the 26.42 price level, according to unofficial data at the New York close.
Intel, an American technology and chip company, opened the trading day at 24.725 price level with the high of the day being 26.84 and the low of the day bottoming at 24.59.
The stock today hit its lowest level for share prices since August of 2015 before turning around and surging higher to close out the day ahead.
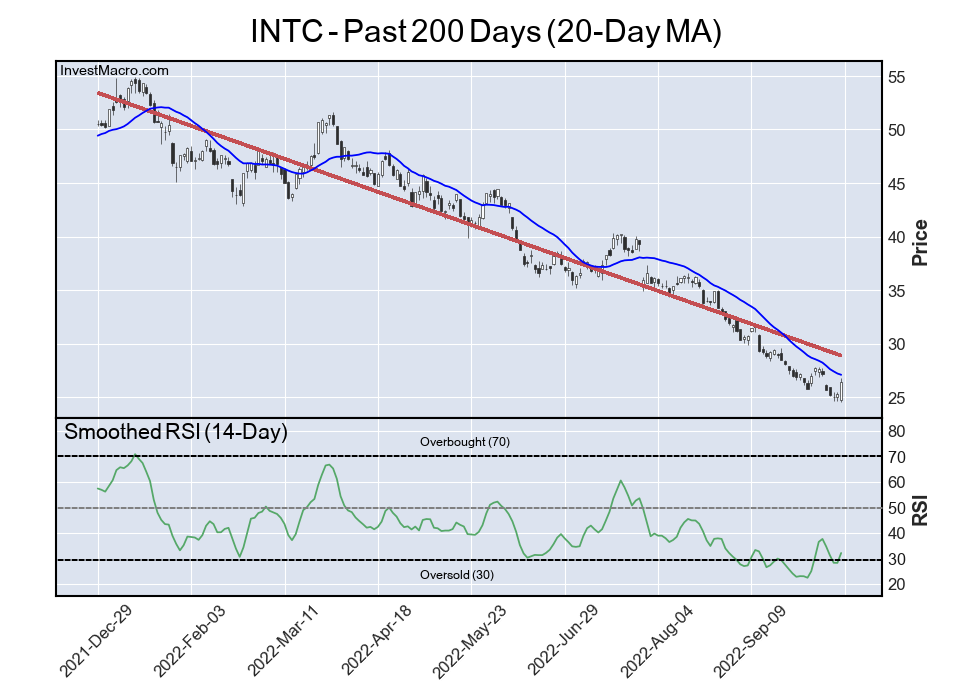
The INTC Trend is Down, RSI level is Bearish
The stock is currently trending sharply lower over the past 200 trading days, according to the linear regression line (red) seen on the chart below. Intel has lost approximately half of its share price value from December 2021 when it was trading in the $50s compared to the current state of the price.
The Relative Strength Index, an indicator that can identify overbought (above 70) and oversold levels (below 30), shows that the current RSI is at a 39.4 score. This is a Bearish reading on the daily time-frame currently. The RSI had recently been in oversold territory and has emerged with an RSI divergence at the current moment (price lower while RSI score higher).
Free Reports:
 Get our Weekly Commitment of Traders Reports - See where the biggest traders (Hedge Funds and Commercial Hedgers) are positioned in the futures markets on a weekly basis.
 Sign Up for Our Stock Market Newsletter – Get updated on News, Charts & Rankings of Public Companies when you join our Stocks Newsletter
INTC Price Returns (Closing Price Changes)
INTC has seen an increase by 0.15 percent over the past 10 days while seeing a decline by -17.23 over the past 30 days. The 90-day change is -38.42 while the 180-day return and the 365-day return are -47.57 and -51.43, respectively.
By InvestMacro.com – – Get our stock market newsletter for stock rankings, charts & updates

- COT Metals Charts: Speculator Bets led lower by Gold, Platinum & Silver Apr 13, 2025
- COT Bonds Charts: Speculator Bets led by SOFR-3M, Fed Funds & Ultra Treasury Bonds Apr 13, 2025
- COT Soft Commodities Charts: Speculator Bets led by Soybean Oil & Wheat Apr 13, 2025
- COT Stock Market Charts: Speculator Bets led higher by Nasdaq, Russell & DowJones Apr 13, 2025
- The US stocks are back to selling off. The US raised tariffs on China to 145% Apr 11, 2025
- EUR/USD Hits Three-Year High as the US Dollar Suffers Heavy Losses Apr 11, 2025
- Markets rallied sharply on the back of a 90-day tariff postponement. China became an exception with tariffs of 125% Apr 10, 2025
- Pound Rallies Sharply Weak Dollar Boosts GBP, but BoE Rate Outlook May Complicate Future Gains Apr 10, 2025
- Tariffs on US imports come into effect today. The RBNZ expectedly lowered the rate by 0.25% Apr 9, 2025
- Volatility in financial markets is insane. Oil fell to $60.7 per barrel Apr 8, 2025