By RoboForex Analytical Department
Early in another week of October, the major currency pair is falling. At the moment, EUR/USD is balancing around 0.9720.
Global capital markets are trying to escape risks amid recession concerns and this fact makes the “greenback” attractive again. On the other hand, the Euro is getting a huge hit from external economic stress – the upcoming heating season in Europe and many problems around it.
Last Friday’s statistics on the US labour market in September turned out to be better than expected. As a result, the US FOMC has a good reason to continue tightening its monetary policy – the employment sector is stable.
The Unemployment Rate dropped from 3.7% in August to 3.5% in September, while the Non-Farm Payrolls shoed 263K against the expected reading of 248K.
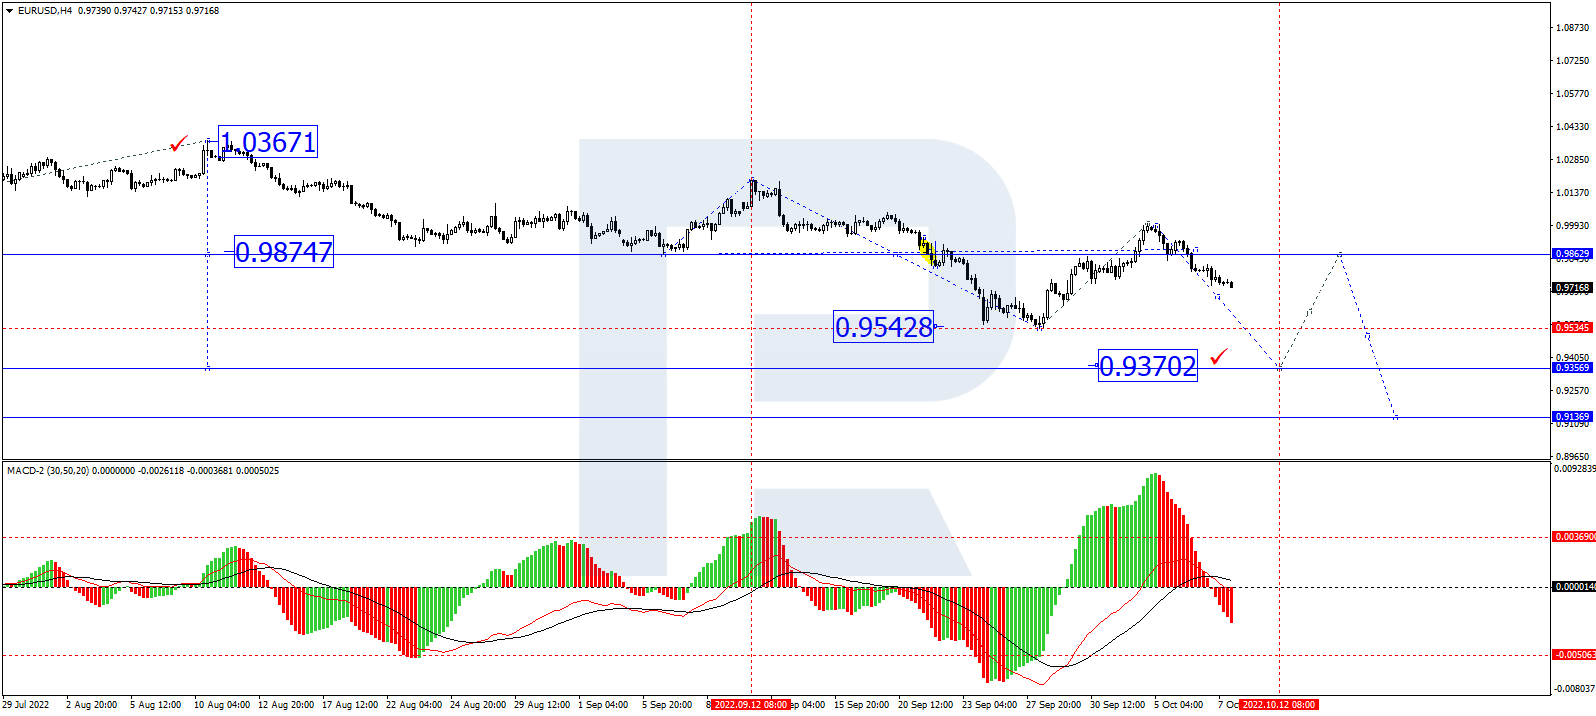
In the H4 chart, after rebounding from 0.9990, EUR/USD is forming a new descending wave towards 0.9360; right now, it is forming the first structure of this wave with the predicted target at 0.9680 and may later consolidate there. In the future, the asset may break the range to the downside and resume falling to reach 0.9360. From the technical point of view, this scenario is confirmed by MACD Oscillator: having broken 0 downwards, its signal line continues falling to update the lows.
Free Reports:
 Sign Up for Our Stock Market Newsletter – Get updated on News, Charts & Rankings of Public Companies when you join our Stocks Newsletter
 Get our Weekly Commitment of Traders Reports - See where the biggest traders (Hedge Funds and Commercial Hedgers) are positioned in the futures markets on a weekly basis.
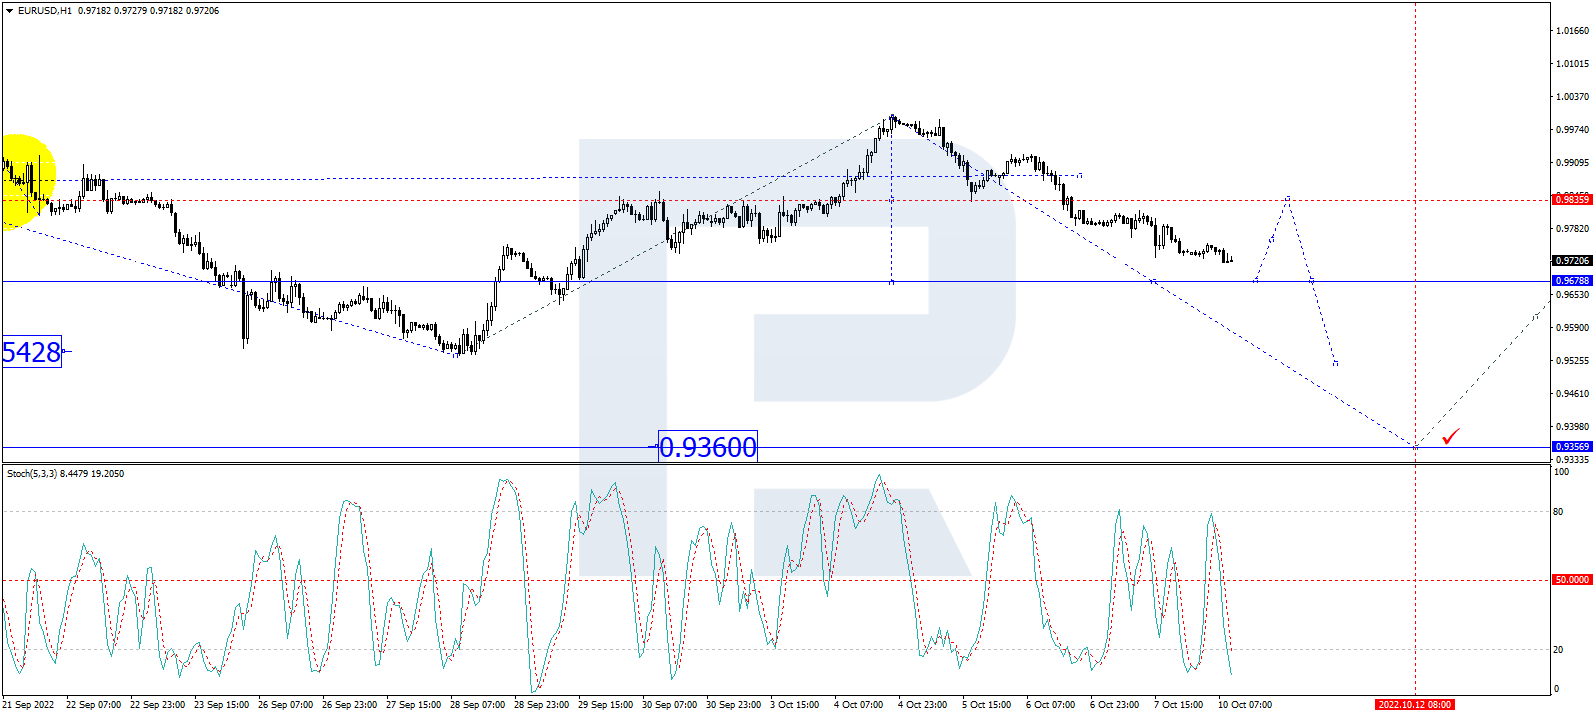
As we can see in the H1 chart, having finished the descending structure at 0.9815 and forming a new consolidation range there, EUR/USD has broken it downwards; right now, it is still falling and forming another descending structure towards 0.9700. After that, the instrument may start a new correction to test 0.9815 from below and then resume falling with the target at 0.9630. From the technical point of view, this idea is confirmed by the Stochastic Oscillator: its signal line is falling towards 20.
Disclaimer
Any forecasts contained herein are based on the author’s particular opinion. This analysis may not be treated as trading advice. RoboForex bears no responsibility for trading results based on trading recommendations and reviews contained herein.

- GBP/USD Starts the Week on a Strong Footing Aug 10, 2026
- The US stock indices finished the session with solid gains following the release of weak labor‑market data Aug 10, 2026
- COT Metals Charts: Speculator Bets led by Gold, Copper & Platinum Aug 9, 2026
- COT Bonds Charts: Speculator Bets led by 2-Year Bonds & US Treasury Bonds Aug 9, 2026
- COT Energy Charts: Speculator Bets led by Heating Oil & Bloomberg Index Aug 9, 2026
- COT Soft Commodities Charts: Speculator Bets led by Sugar & Cotton Aug 9, 2026
- The Central Bank of Mexico kept its interest rate unchanged. Iran plans to introduce strict bans for US and Israeli vessels in the Strait of Hormuz Aug 7, 2026
- USD/JPY Holds Firm: Yen Loses Some Support Aug 7, 2026
- Australian trade balance returned to positive territory Aug 6, 2026
- Results in Line for Most Reporting Companies Aug 5, 2026
