
By InvestMacro | COT | Data Tables | COT Leaders | Downloads | COT Newsletter

Here are the latest charts and statistics for the Commitment of Traders (COT) data published by the Commodities Futures Trading Commission (CFTC).
The latest COT data is updated through Tuesday May 10th and shows a quick view of how large traders (for-profit speculators and commercial entities) were positioned in the futures markets.
Metals speculator bets overall were lower this week with four out of the five metals markets we cover seeing lower bets on the week. The metals markets are seeing a cool off in their speculative positions as well as their prices as most of these markets are down from a short-term peak in early March.
The only market with higher speculator bets this week was Platinum (2,904 contracts).
Free Reports:
 Sign Up for Our Stock Market Newsletter – Get updated on News, Charts & Rankings of Public Companies when you join our Stocks Newsletter
 Get our Weekly Commitment of Traders Reports - See where the biggest traders (Hedge Funds and Commercial Hedgers) are positioned in the futures markets on a weekly basis.
The markets with declining speculator bets this week were Silver (-8,986 contracts), Gold (-5,853 contracts), Copper (-7,003 contracts) and Palladium (-493 contracts).

Speculator strength standings for each Commodity where strength index is current net position compared to past three years, above 80 is bullish extreme, below 20 is bearish extreme OI Strength = Current Open Interest level compared to last 3 years range Spec Strength = Current Net Speculator level compared to last 3 years range Strength Move = Six week change of Spec Strength
May-10-2022 | OI | OI-Index | Spec-Net | Spec-Index | Com-Net | COM-Index | Smalls-Net | Smalls-Index |
|---|---|---|---|---|---|---|---|---|
| WTI Crude | 1,736,594 | 0 | 310,803 | 2 | -354,479 | 98 | 43,676 | 77 |
| Corn | 1,510,783 | 23 | 470,908 | 90 | -415,345 | 13 | -55,563 | 11 |
| Natural Gas | 1,108,451 | 6 | -112,529 | 45 | 64,006 | 51 | 48,523 | 100 |
| Sugar | 797,453 | 0 | 187,185 | 75 | -220,611 | 26 | 33,426 | 49 |
| Soybeans | 694,454 | 20 | 174,608 | 72 | -147,698 | 33 | -26,910 | 26 |
| Gold | 571,447 | 34 | 193,315 | 40 | -227,756 | 57 | 34,441 | 57 |
| Heating Oil | 349,618 | 31 | 6,455 | 52 | -32,434 | 37 | 25,979 | 88 |
| Wheat | 308,326 | 0 | 21,686 | 48 | -17,779 | 34 | -3,907 | 92 |
| Coffee | 212,659 | 5 | 32,555 | 69 | -33,559 | 37 | 1,004 | 0 |
| Copper | 184,502 | 15 | -22,626 | 26 | 19,249 | 73 | 3,377 | 45 |
| Brent | 173,911 | 19 | -31,215 | 59 | 30,562 | 44 | 653 | 18 |
| Silver | 142,752 | 9 | 19,082 | 41 | -30,519 | 69 | 11,437 | 9 |
| Platinum | 66,064 | 32 | 1,363 | 5 | -5,373 | 98 | 4,010 | 18 |
| Palladium | 8,832 | 11 | -3,245 | 3 | 3,434 | 96 | -189 | 33 |
Gold Comex Futures:
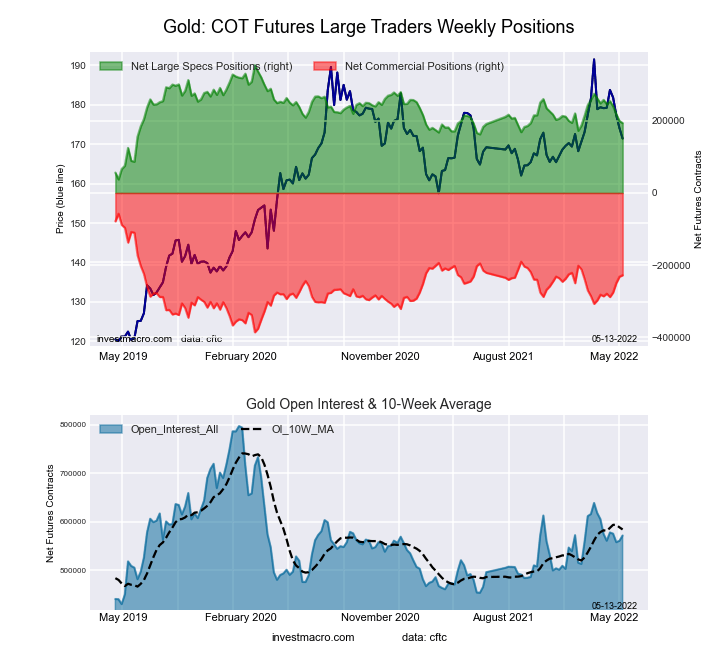 The Gold Comex Futures large speculator standing this week reached a net position of 193,315 contracts in the data reported through Tuesday. This was a weekly lowering of -5,853 contracts from the previous week which had a total of 199,168 net contracts.
This week’s current strength score (the trader positioning range over the past three years, measured from 0 to 100) shows the speculators are currently Bearish with a score of 39.9 percent. The commercials are Bullish with a score of 56.8 percent and the small traders (not shown in chart) are Bullish with a score of 57.3 percent.
| Gold Futures Statistics | SPECULATORS | COMMERCIALS | SMALL TRADERS |
| – Percent of Open Interest Longs: | 50.6 | 23.1 | 9.1 |
| – Percent of Open Interest Shorts: | 16.7 | 63.0 | 3.1 |
| – Net Position: | 193,315 | -227,756 | 34,441 |
| – Gross Longs: | 288,947 | 132,251 | 52,098 |
| – Gross Shorts: | 95,632 | 360,007 | 17,657 |
| – Long to Short Ratio: | 3.0 to 1 | 0.4 to 1 | 3.0 to 1 |
| NET POSITION TREND: | |||
| – Strength Index Score (3 Year Range Pct): | 39.9 | 56.8 | 57.3 |
| – Strength Index Reading (3 Year Range): | Bearish | Bullish | Bullish |
| NET POSITION MOVEMENT INDEX: | |||
| – 6-Week Change in Strength Index: | -24.1 | 21.0 | 19.4 |
Silver Comex Futures:
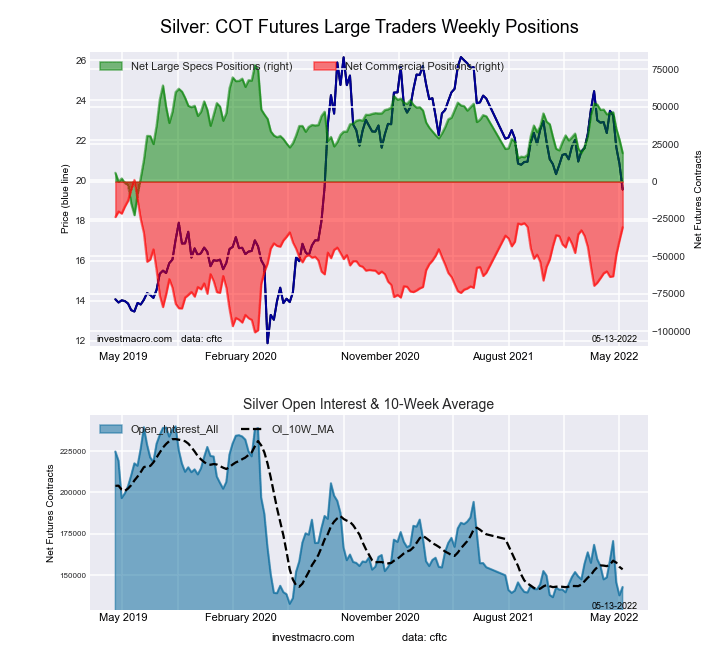 The Silver Comex Futures large speculator standing this week reached a net position of 19,082 contracts in the data reported through Tuesday. This was a weekly fall of -8,986 contracts from the previous week which had a total of 28,068 net contracts.
This week’s current strength score (the trader positioning range over the past three years, measured from 0 to 100) shows the speculators are currently Bearish with a score of 41.4 percent. The commercials are Bullish with a score of 69.0 percent and the small traders (not shown in chart) are Bearish-Extreme with a score of 9.5 percent.
| Silver Futures Statistics | SPECULATORS | COMMERCIALS | SMALL TRADERS |
| – Percent of Open Interest Longs: | 41.9 | 36.9 | 17.4 |
| – Percent of Open Interest Shorts: | 28.5 | 58.3 | 9.4 |
| – Net Position: | 19,082 | -30,519 | 11,437 |
| – Gross Longs: | 59,829 | 52,637 | 24,862 |
| – Gross Shorts: | 40,747 | 83,156 | 13,425 |
| – Long to Short Ratio: | 1.5 to 1 | 0.6 to 1 | 1.9 to 1 |
| NET POSITION TREND: | |||
| – Strength Index Score (3 Year Range Pct): | 41.4 | 69.0 | 9.5 |
| – Strength Index Reading (3 Year Range): | Bearish | Bullish | Bearish-Extreme |
| NET POSITION MOVEMENT INDEX: | |||
| – 6-Week Change in Strength Index: | -29.1 | 30.3 | -9.9 |
Copper Grade #1 Futures:

The Copper Grade #1 Futures large speculator standing this week reached a net position of -22,626 contracts in the data reported through Tuesday. This was a weekly lowering of -7,003 contracts from the previous week which had a total of -15,623 net contracts.
This week’s current strength score (the trader positioning range over the past three years, measured from 0 to 100) shows the speculators are currently Bearish with a score of 26.1 percent. The commercials are Bullish with a score of 72.7 percent and the small traders (not shown in chart) are Bearish with a score of 44.8 percent.
| Copper Futures Statistics | SPECULATORS | COMMERCIALS | SMALL TRADERS |
| – Percent of Open Interest Longs: | 31.2 | 50.6 | 9.3 |
| – Percent of Open Interest Shorts: | 43.4 | 40.1 | 7.5 |
| – Net Position: | -22,626 | 19,249 | 3,377 |
| – Gross Longs: | 57,510 | 93,318 | 17,183 |
| – Gross Shorts: | 80,136 | 74,069 | 13,806 |
| – Long to Short Ratio: | 0.7 to 1 | 1.3 to 1 | 1.2 to 1 |
| NET POSITION TREND: | |||
| – Strength Index Score (3 Year Range Pct): | 26.1 | 72.7 | 44.8 |
| – Strength Index Reading (3 Year Range): | Bearish | Bullish | Bearish |
| NET POSITION MOVEMENT INDEX: | |||
| – 6-Week Change in Strength Index: | -38.3 | 38.9 | -19.5 |
Platinum Futures:

The Platinum Futures large speculator standing this week reached a net position of 1,363 contracts in the data reported through Tuesday. This was a weekly rise of 2,904 contracts from the previous week which had a total of -1,541 net contracts.
This week’s current strength score (the trader positioning range over the past three years, measured from 0 to 100) shows the speculators are currently Bearish-Extreme with a score of 5.3 percent. The commercials are Bullish-Extreme with a score of 97.6 percent and the small traders (not shown in chart) are Bearish-Extreme with a score of 17.9 percent.
| Platinum Futures Statistics | SPECULATORS | COMMERCIALS | SMALL TRADERS |
| – Percent of Open Interest Longs: | 43.6 | 39.8 | 12.2 |
| – Percent of Open Interest Shorts: | 41.5 | 47.9 | 6.1 |
| – Net Position: | 1,363 | -5,373 | 4,010 |
| – Gross Longs: | 28,774 | 26,293 | 8,029 |
| – Gross Shorts: | 27,411 | 31,666 | 4,019 |
| – Long to Short Ratio: | 1.0 to 1 | 0.8 to 1 | 2.0 to 1 |
| NET POSITION TREND: | |||
| – Strength Index Score (3 Year Range Pct): | 5.3 | 97.6 | 17.9 |
| – Strength Index Reading (3 Year Range): | Bearish-Extreme | Bullish-Extreme | Bearish-Extreme |
| NET POSITION MOVEMENT INDEX: | |||
| – 6-Week Change in Strength Index: | -18.1 | 21.2 | -38.4 |
Palladium Futures:
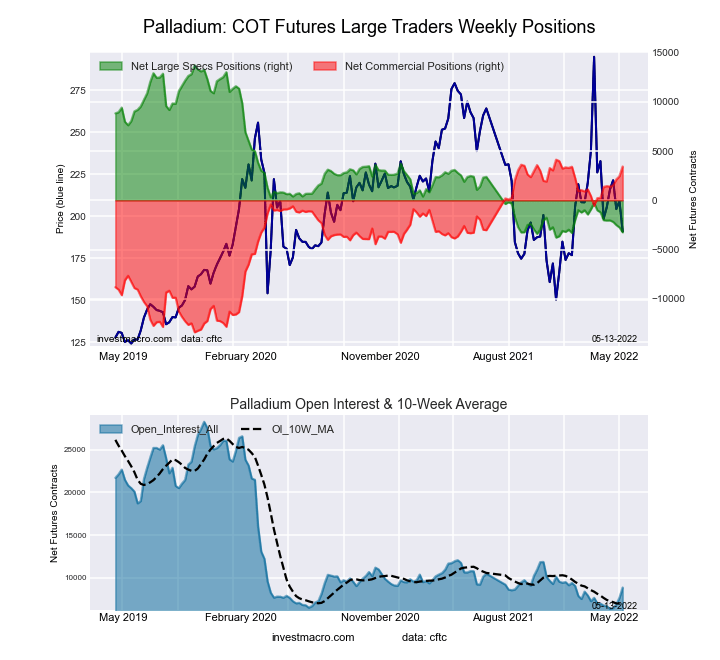 The Palladium Futures large speculator standing this week reached a net position of -3,245 contracts in the data reported through Tuesday. This was a weekly decrease of -493 contracts from the previous week which had a total of -2,752 net contracts.
This week’s current strength score (the trader positioning range over the past three years, measured from 0 to 100) shows the speculators are currently Bearish-Extreme with a score of 3.0 percent. The commercials are Bullish-Extreme with a score of 96.1 percent and the small traders (not shown in chart) are Bearish with a score of 32.9 percent.
| Palladium Futures Statistics | SPECULATORS | COMMERCIALS | SMALL TRADERS |
| – Percent of Open Interest Longs: | 11.5 | 59.0 | 11.1 |
| – Percent of Open Interest Shorts: | 48.2 | 20.1 | 13.3 |
| – Net Position: | -3,245 | 3,434 | -189 |
| – Gross Longs: | 1,013 | 5,209 | 982 |
| – Gross Shorts: | 4,258 | 1,775 | 1,171 |
| – Long to Short Ratio: | 0.2 to 1 | 2.9 to 1 | 0.8 to 1 |
| NET POSITION TREND: | |||
| – Strength Index Score (3 Year Range Pct): | 3.0 | 96.1 | 32.9 |
| – Strength Index Reading (3 Year Range): | Bearish-Extreme | Bullish-Extreme | Bearish |
| NET POSITION MOVEMENT INDEX: | |||
| – 6-Week Change in Strength Index: | -7.1 | 11.8 | -48.4 |
Article By InvestMacro – Receive our weekly COT Reports by Email
*COT Report: The COT data, released weekly to the public each Friday, is updated through the most recent Tuesday (data is 3 days old) and shows a quick view of how large speculators or non-commercials (for-profit traders) were positioned in the futures markets.
The CFTC categorizes trader positions according to commercial hedgers (traders who use futures contracts for hedging as part of the business), non-commercials (large traders who speculate to realize trading profits) and nonreportable traders (usually small traders/speculators) as well as their open interest (contracts open in the market at time of reporting).See CFTC criteria here.

- It Looks Like Its a Good Time To Buy This Gold Stock Mar 28, 2025
- Copper Co. Should Be Up Way Higher Mar 28, 2025
- Banxico cut the rate by 0.5%. The global auto market is under pressure from the introduction of tariffs. Mar 28, 2025
- The Pound Stands Strong Amid Global Trade Tensions Mar 28, 2025
- Uncertainty over the scope and impact of tariffs increased market volatility Mar 27, 2025
- EUR/USD Faces Further Decline Amid Market Jitters and Trump’s Tariff Threat Mar 27, 2025
- Australia’s inflation rate is at a 3-month low. Oil prices are approaching $70 again Mar 26, 2025
- USD/JPY Rises Again: Yen Lacks Support as Bulls Take Control Mar 26, 2025
- Oil prices rise amid a new OPEC+ plan to cut production. Inflation in Singapore continues to weaken. Mar 24, 2025
- SNB cut the interest rate to 0.25%. Inflationary pressures are easing in Hong Kong and Malaysia Mar 21, 2025