
By Orbex

The internal structure of the NZDUSD pair hints at a cycle zigzag pattern that consists of sub-waves a-b-c. On the chart, we see the end of a large correction wave b of the cycle degree. It took the form of a primary triple zigzag Ⓦ-Ⓧ-Ⓨ-Ⓧ-Ⓩ.
After the cycle correction was complete, the market turned around, and we saw the development of a cycle wave c. This has the form of an ending diagonal consisting of primary sub-waves ①-②-③-④-⑤.
Most likely, the formation of a new bearish trend is starting. This could take the form of a primary impulse ①-②-③-④-⑤. In the near future, the price will fall in the primary wave ③ to 0.628. At that level, it will be at 161.8% of wave ①. Then the development of the primary fourth correction is likely.
Free Reports:
 Download Our Metatrader 4 Indicators – Put Our Free MetaTrader 4 Custom Indicators on your charts when you join our Weekly Newsletter
 Get our Weekly Commitment of Traders Reports - See where the biggest traders (Hedge Funds and Commercial Hedgers) are positioned in the futures markets on a weekly basis.
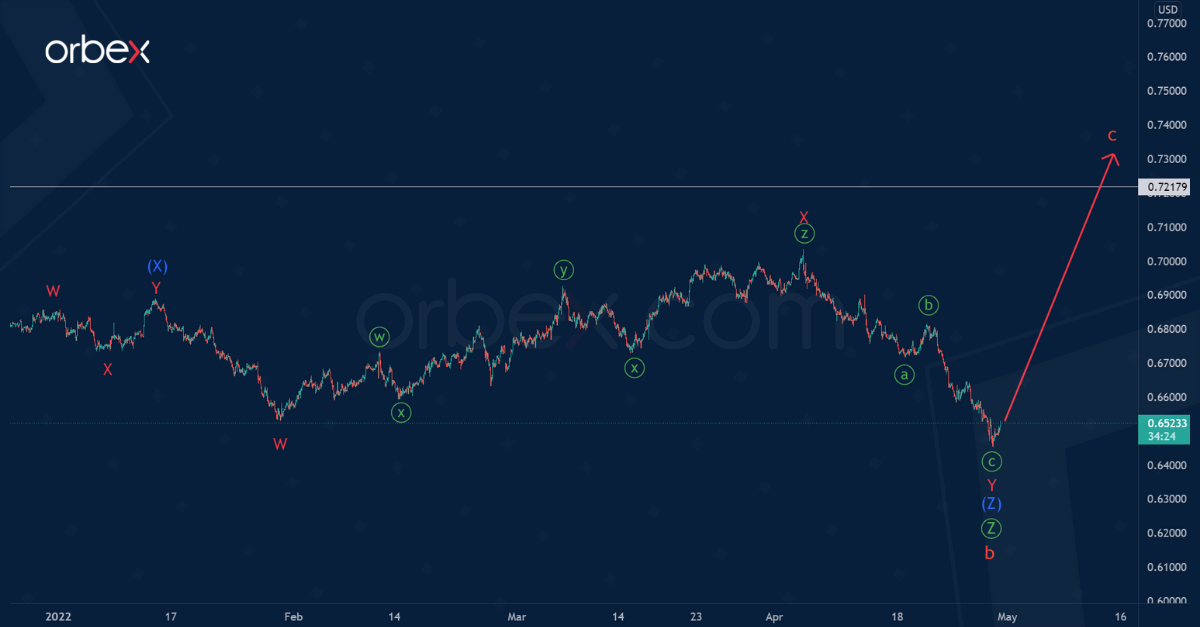
In the second scenario, the formation of a cycle zigzag has not yet ended. The final primary wave Ⓩ, which is part of correction b, took the form of a triple zigzag (W)-(X)-(Y)-(X)-(Z) of the intermediate degree.
According to this view, the first four parts of the intermediate pattern ended. Now the market is in the intermediate wave (Z). Wave (Z) is similar to the minor double zigzag W-X-Y.
Thus, in the upcoming trading weeks, we can expect a price increase and the development of a bullish cycle wave c near 0.721, and possibly even higher. In fact, this is likely to take the form of an impulse.
Join our responsible trading community – Open your Orbex account now!
![]() Article by Orbex
Article by Orbex
Orbex is a fully licensed broker that was established in 2011. Founded with a mission to serve its traders responsibly and provides traders with access to the world’s largest and most liquid financial markets. www.orbex.com

- COT Metals Charts: Speculator Bets led by Silver, Gold & Platinum Mar 7, 2026
- COT Bonds Charts: Speculator Bets led by 10-Year Bonds & Fed Funds Mar 7, 2026
- COT Energy Charts: Speculator Bets led by Brent Oil & Heating Oil Mar 7, 2026
- COT Soft Commodities Charts: Speculator Bets led by Corn & Soybean Meal Mar 7, 2026
- Investors run to safe-haven assets amid Middle East escalation Mar 6, 2026
- EUR/USD Under Pressure: Middle East Risks Outweigh All Else Mar 6, 2026
- Bitcoin shows resilience to Middle East events. Oil market stabilizes Mar 5, 2026
- GBP/USD: Market Not Expecting BoE Rate Cut in March Mar 5, 2026
- Brent headed for $100? Mar 4, 2026
- Global stock indices continue sell-off due to Middle East conflict Mar 4, 2026